

Key Insights
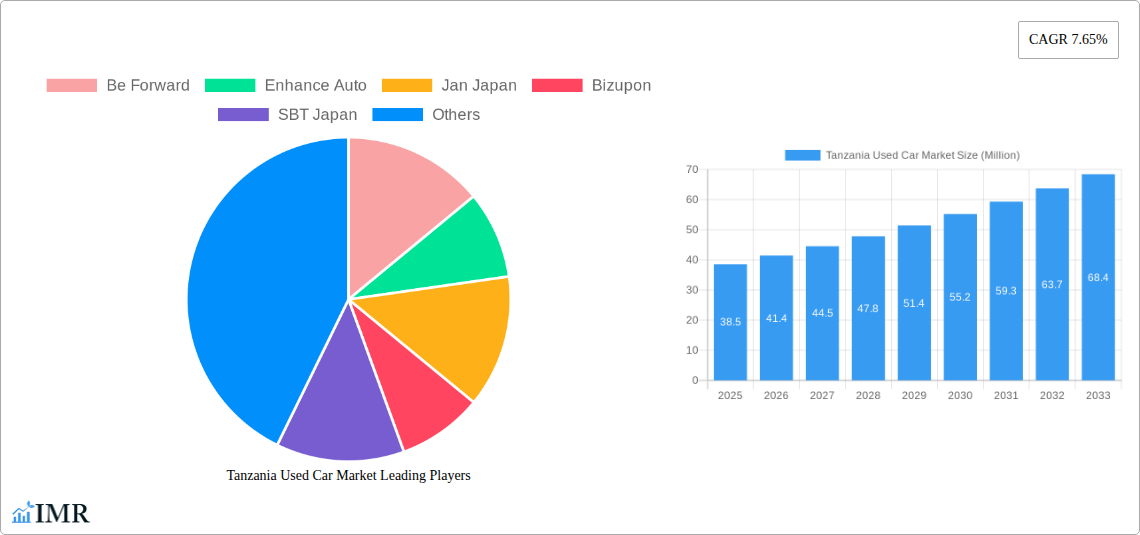
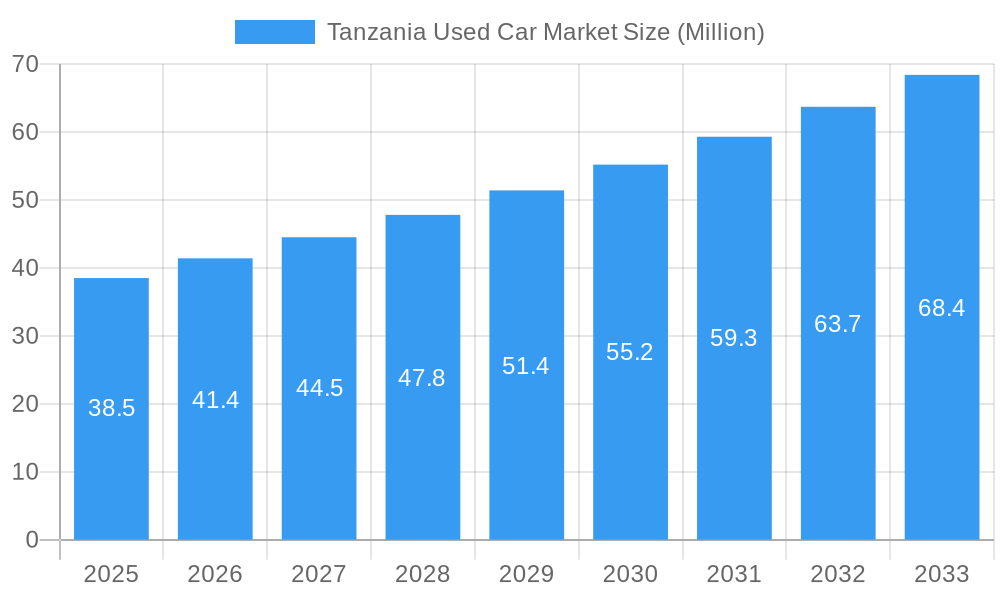
The Tanzania used car market, valued at $38.5 million in 2025, exhibits robust growth potential, projected to expand at a Compound Annual Growth Rate (CAGR) of 7.65% from 2025 to 2033. This growth is fueled by several key factors. Rising disposable incomes within Tanzania are driving increased demand for personal vehicles, particularly among the burgeoning middle class. The relatively lower cost of used cars compared to new vehicles makes them an attractive option for a wider segment of the population. Furthermore, the expanding online sales channels, exemplified by platforms like UsedCars.co.tz and Garipesa, are increasing market accessibility and transparency, boosting overall sales. The market is segmented by vehicle type (hatchbacks, sedans, SUVs/MPVs), vendor type (organized and unorganized), fuel type (petrol, diesel, electric, and others), and sales channel (online and offline). The presence of numerous players, including both international and local companies like Be Forward, Enhance Auto, and CarJunction Tanzania, contributes to the market’s competitive dynamism.
Tanzania Used Car Market Market Size (In Million)
However, challenges remain. Limited access to financing options for used car purchases may hinder growth for certain segments of the population. Furthermore, concerns regarding vehicle quality and maintenance costs, coupled with the evolving regulatory landscape governing used car imports, represent potential restraints. The increasing popularity of electric vehicles (EVs) presents both an opportunity and a challenge. While EVs offer environmental benefits, their higher initial cost and limited charging infrastructure currently act as barriers to wider adoption in Tanzania. Addressing these challenges through improved infrastructure, financial accessibility, and enhanced quality control measures will be crucial in unlocking the full potential of the Tanzanian used car market. The strategic expansion of online sales channels and the potential growth of the EV segment offer promising avenues for future growth.
Tanzania Used Car Market Company Market Share
Tanzania Used Car Market: A Comprehensive Market Report (2019-2033)
This in-depth report provides a comprehensive analysis of the Tanzania used car market, covering market dynamics, growth trends, key players, and future opportunities. The report utilizes data from the historical period (2019-2024), base year (2025), and forecast period (2025-2033), offering invaluable insights for industry professionals, investors, and businesses operating within this dynamic sector. The total market size is projected to reach xx Million units by 2033.
Keywords: Tanzania used car market, used car imports Tanzania, Tanzania automotive market, used car sales Tanzania, online used car market Tanzania, Dar es Salaam port, Be Forward, SBT Japan, Jiji, Hatchbacks, Sedans, SUVs, MPVs, Petrol, Diesel, Electric vehicles, B2C, B2B, C2C.
Tanzania Used Car Market Dynamics & Structure
The Tanzanian used car market is characterized by a mix of organized and unorganized players, with a growing online presence. Market concentration is moderate, with several key players vying for market share. Technological innovation, while present, faces barriers such as limited internet access and digital literacy in certain segments. The regulatory framework is evolving, impacting import procedures and vehicle standards. Substitute products, such as public transport, remain significant, especially in lower socioeconomic groups. The demographic shift towards a younger, more urban population fuels demand for personal vehicles. M&A activity is relatively low, with a few strategic acquisitions observed in recent years (estimated xx deals in the last 5 years).
- Market Concentration: Moderate, with no single dominant player.
- Technological Innovation: Growing influence of online platforms, but limited by infrastructure and digital literacy.
- Regulatory Framework: Evolving regulations impacting import procedures and vehicle standards.
- Competitive Product Substitutes: Public transportation remains a significant alternative.
- End-User Demographics: Shifting towards younger, urban populations driving increased demand.
- M&A Trends: Relatively low, with a few strategic acquisitions observed in the last 5 years.
Tanzania Used Car Market Growth Trends & Insights
The Tanzanian used car market experienced significant growth during the historical period (2019-2024), driven by increasing urbanization, rising disposable incomes, and improving infrastructure in some areas. The market size is estimated at xx Million units in 2025 and is projected to grow at a CAGR of xx% during the forecast period (2025-2033), reaching xx Million units by 2033. The adoption rate of online sales channels is increasing rapidly, reflecting the growing digital penetration. Technological disruptions, such as the introduction of electric vehicles and improved online platforms, are reshaping the market. Consumer behavior is shifting towards online purchases and a preference for newer, more fuel-efficient vehicles.
Dominant Regions, Countries, or Segments in Tanzania Used Car Market
Dar es Salaam and other major urban centers dominate the used car market due to higher population density and economic activity. The SUV/MPV segment exhibits the highest growth, reflecting the preference for larger vehicles accommodating families. The organized sector shows higher growth potential compared to the unorganized sector, which lacks transparency and regulation. Petrol vehicles remain the dominant fuel type; however, diesel and electric vehicle penetration is slowly increasing. Online sales channels are experiencing faster growth than offline channels due to convenience and wider reach.
- Leading Region: Dar es Salaam and other major urban areas.
- Dominant Vehicle Type: SUVs/MPVs, followed by Sedans and Hatchbacks.
- Fastest-Growing Vendor Type: Organized sector.
- Leading Fuel Type: Petrol.
- Fastest-Growing Sales Channel: Online.
Tanzania Used Car Market Product Landscape
The Tanzanian used car market offers a wide range of vehicles, from compact hatchbacks to large SUVs, catering to diverse consumer needs and budgets. Product innovation focuses on fuel efficiency, safety features, and technological integration. Key selling propositions include affordability, reliability, and availability of diverse models. Recent technological advancements involve the introduction of online platforms offering detailed vehicle information, virtual inspections, and financing options.
Key Drivers, Barriers & Challenges in Tanzania Used Car Market
Key Drivers: Rising disposable incomes, urbanization, and improved road infrastructure are primary drivers. Government initiatives promoting vehicle ownership and increased access to financing are also contributing factors.
Key Challenges: High import duties and taxes increase vehicle prices. Limited access to financing for some consumers remains a barrier. The lack of regulation in the unorganized sector poses challenges regarding vehicle quality and safety. Supply chain disruptions and port congestion can impact vehicle availability.
Emerging Opportunities in Tanzania Used Car Market
The growth of the electric vehicle segment presents a significant opportunity. Expansion into rural areas with increasing road networks provides potential for market penetration. Developing robust online platforms that incorporate consumer reviews and improved customer service can enhance market penetration.
Growth Accelerators in the Tanzania Used Car Market Industry
Strategic partnerships between online platforms and financing institutions could significantly boost sales. Investments in improving port efficiency and supply chain management will improve vehicle availability. Technological advancements, such as the adoption of telematics and AI-powered vehicle condition assessment, will improve market transparency and customer trust.
Key Players Shaping the Tanzania Used Car Market Market
- Be Forward
- Enhance Auto
- Jan Japan
- Bizupon
- SBT Japan
- Jiji
- CarTanzania
- SBI Motor Japan
- Car Junction Tanzania
- UsedCars co tz
- Garipesa
- Autorod
Notable Milestones in Tanzania Used Car Market Sector
- November 2022: A 316% annual increase in used vehicle imports from Zimbabwe via Dar es Salaam port compared to 2016. Approximately 15,000 vehicles were imported annually by Zimbabweans through this port compared to 3,600 vehicles in 2016.
- June 2021: SBT Japan announced plans to incorporate the C2C segment into its existing B2B and B2C market structure.
In-Depth Tanzania Used Car Market Market Outlook
The Tanzanian used car market exhibits strong long-term growth potential. The increasing affordability of vehicles, coupled with evolving consumer preferences and technological advancements, will drive market expansion. Strategic investments in infrastructure development, regulatory reforms, and technological innovations will shape the future of this dynamic sector. The market is poised for significant expansion, particularly in online sales and the adoption of newer vehicle technologies.
Tanzania Used Car Market Segmentation
-
1. Vehicle Type
- 1.1. Hatchbacks
- 1.2. Sedans
- 1.3. Sports U
-
2. Vendor Type
- 2.1. Organized
- 2.2. Unorganized
-
3. Fuel Type
- 3.1. Petrol
- 3.2. Diesel
- 3.3. Electric
- 3.4. Other Fuel Types (LPG, CNG, etc.)
-
4. Sales Channel
- 4.1. Online
- 4.2. Offline
Tanzania Used Car Market Segmentation By Geography
- 1. Tanzania
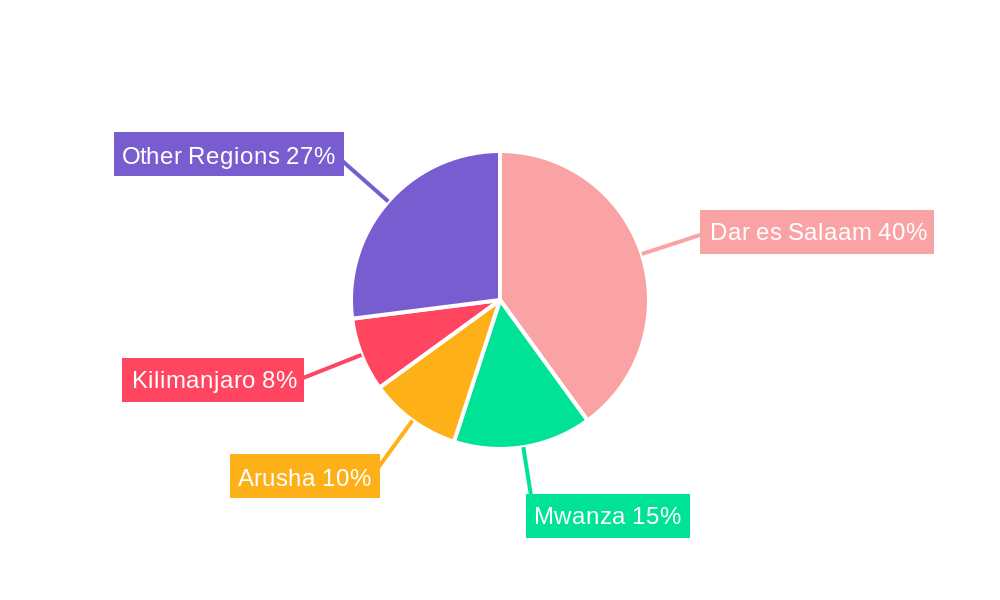
Tanzania Used Car Market Regional Market Share
Geographic Coverage of Tanzania Used Car Market
Tanzania Used Car Market REPORT HIGHLIGHTS
| Aspects | Details |
|---|---|
| Study Period | 2020-2034 |
| Base Year | 2025 |
| Estimated Year | 2026 |
| Forecast Period | 2026-2034 |
| Historical Period | 2020-2025 |
| Growth Rate | CAGR of 7.65% from 2020-2034 |
| Segmentation |
|
Table of Contents
- 1. Introduction
- 1.1. Research Scope
- 1.2. Market Segmentation
- 1.3. Research Objective
- 1.4. Definitions and Assumptions
- 2. Executive Summary
- 2.1. Market Snapshot
- 3. Market Dynamics
- 3.1. Market Drivers
- 3.2. Market Restrains
- 3.3. Market Trends
- 3.4. Market Opportunities
- 4. Market Factor Analysis
- 4.1. Porters Five Forces
- 4.1.1. Bargaining Power of Suppliers
- 4.1.2. Bargaining Power of Buyers
- 4.1.3. Threat of New Entrants
- 4.1.4. Threat of Substitutes
- 4.1.5. Competitive Rivalry
- 4.2. PESTEL analysis
- 4.3. BCG Analysis
- 4.3.1. Stars (High Growth, High Market Share)
- 4.3.2. Cash Cows (Low Growth, High Market Share)
- 4.3.3. Question Mark (High Growth, Low Market Share)
- 4.3.4. Dogs (Low Growth, Low Market Share)
- 4.4. Ansoff Matrix Analysis
- 4.5. Supply Chain Analysis
- 4.6. Regulatory Landscape
- 4.7. Current Market Potential and Opportunity Assessment (TAM–SAM–SOM Framework)
- 4.8. IMR Analyst Note
- 4.1. Porters Five Forces
- 5. Market Analysis, Insights and Forecast 2021-2033
- 5.1. Market Analysis, Insights and Forecast - by Vehicle Type
- 5.1.1. Hatchbacks
- 5.1.2. Sedans
- 5.1.3. Sports U
- 5.2. Market Analysis, Insights and Forecast - by Vendor Type
- 5.2.1. Organized
- 5.2.2. Unorganized
- 5.3. Market Analysis, Insights and Forecast - by Fuel Type
- 5.3.1. Petrol
- 5.3.2. Diesel
- 5.3.3. Electric
- 5.3.4. Other Fuel Types (LPG, CNG, etc.)
- 5.4. Market Analysis, Insights and Forecast - by Sales Channel
- 5.4.1. Online
- 5.4.2. Offline
- 5.5. Market Analysis, Insights and Forecast - by Region
- 5.5.1. Tanzania
- 5.1. Market Analysis, Insights and Forecast - by Vehicle Type
- 6. Tanzania Used Car Market Analysis, Insights and Forecast, 2021-2033
- 6.1. Market Analysis, Insights and Forecast - by Vehicle Type
- 6.1.1. Hatchbacks
- 6.1.2. Sedans
- 6.1.3. Sports U
- 6.2. Market Analysis, Insights and Forecast - by Vendor Type
- 6.2.1. Organized
- 6.2.2. Unorganized
- 6.3. Market Analysis, Insights and Forecast - by Fuel Type
- 6.3.1. Petrol
- 6.3.2. Diesel
- 6.3.3. Electric
- 6.3.4. Other Fuel Types (LPG, CNG, etc.)
- 6.4. Market Analysis, Insights and Forecast - by Sales Channel
- 6.4.1. Online
- 6.4.2. Offline
- 6.1. Market Analysis, Insights and Forecast - by Vehicle Type
- 7. Competitive Analysis
- 7.1. Company Profiles
- 7.1.1 Be Forward
- 7.1.1.1. Company Overview
- 7.1.1.2. Products
- 7.1.1.3. Company Financials
- 7.1.1.4. SWOT Analysis
- 7.1.2 Enhance Auto
- 7.1.2.1. Company Overview
- 7.1.2.2. Products
- 7.1.2.3. Company Financials
- 7.1.2.4. SWOT Analysis
- 7.1.3 Jan Japan
- 7.1.3.1. Company Overview
- 7.1.3.2. Products
- 7.1.3.3. Company Financials
- 7.1.3.4. SWOT Analysis
- 7.1.4 Bizupon
- 7.1.4.1. Company Overview
- 7.1.4.2. Products
- 7.1.4.3. Company Financials
- 7.1.4.4. SWOT Analysis
- 7.1.5 SBT Japan
- 7.1.5.1. Company Overview
- 7.1.5.2. Products
- 7.1.5.3. Company Financials
- 7.1.5.4. SWOT Analysis
- 7.1.6 Jiji
- 7.1.6.1. Company Overview
- 7.1.6.2. Products
- 7.1.6.3. Company Financials
- 7.1.6.4. SWOT Analysis
- 7.1.7 CarTanzania
- 7.1.7.1. Company Overview
- 7.1.7.2. Products
- 7.1.7.3. Company Financials
- 7.1.7.4. SWOT Analysis
- 7.1.8 SBI Motor Japa
- 7.1.8.1. Company Overview
- 7.1.8.2. Products
- 7.1.8.3. Company Financials
- 7.1.8.4. SWOT Analysis
- 7.1.9 Car Junction Tanzania
- 7.1.9.1. Company Overview
- 7.1.9.2. Products
- 7.1.9.3. Company Financials
- 7.1.9.4. SWOT Analysis
- 7.1.10 UsedCars co tz
- 7.1.10.1. Company Overview
- 7.1.10.2. Products
- 7.1.10.3. Company Financials
- 7.1.10.4. SWOT Analysis
- 7.1.11 Garipesa
- 7.1.11.1. Company Overview
- 7.1.11.2. Products
- 7.1.11.3. Company Financials
- 7.1.11.4. SWOT Analysis
- 7.1.12 Autorod
- 7.1.12.1. Company Overview
- 7.1.12.2. Products
- 7.1.12.3. Company Financials
- 7.1.12.4. SWOT Analysis
- 7.1.1 Be Forward
- 7.2. Market Entropy
- 7.2.1 Company's Key Areas Served
- 7.2.2 Recent Developments
- 7.3. Company Market Share Analysis 2025
- 7.3.1 Top 5 Companies Market Share Analysis
- 7.3.2 Top 3 Companies Market Share Analysis
- 7.4. List of Potential Customers
- 8. Research Methodology
List of Figures
- Figure 1: Tanzania Used Car Market Revenue Breakdown (Million, %) by Product 2025 & 2033
- Figure 2: Tanzania Used Car Market Share (%) by Company 2025
List of Tables
- Table 1: Tanzania Used Car Market Revenue Million Forecast, by Vehicle Type 2020 & 2033
- Table 2: Tanzania Used Car Market Revenue Million Forecast, by Vendor Type 2020 & 2033
- Table 3: Tanzania Used Car Market Revenue Million Forecast, by Fuel Type 2020 & 2033
- Table 4: Tanzania Used Car Market Revenue Million Forecast, by Sales Channel 2020 & 2033
- Table 5: Tanzania Used Car Market Revenue Million Forecast, by Region 2020 & 2033
- Table 6: Tanzania Used Car Market Revenue Million Forecast, by Vehicle Type 2020 & 2033
- Table 7: Tanzania Used Car Market Revenue Million Forecast, by Vendor Type 2020 & 2033
- Table 8: Tanzania Used Car Market Revenue Million Forecast, by Fuel Type 2020 & 2033
- Table 9: Tanzania Used Car Market Revenue Million Forecast, by Sales Channel 2020 & 2033
- Table 10: Tanzania Used Car Market Revenue Million Forecast, by Country 2020 & 2033
Frequently Asked Questions
1. What is the projected Compound Annual Growth Rate (CAGR) of the Tanzania Used Car Market?
The projected CAGR is approximately 7.65%.
2. Which companies are prominent players in the Tanzania Used Car Market?
Key companies in the market include Be Forward, Enhance Auto, Jan Japan, Bizupon, SBT Japan, Jiji, CarTanzania, SBI Motor Japa, Car Junction Tanzania, UsedCars co tz, Garipesa, Autorod.
3. What are the main segments of the Tanzania Used Car Market?
The market segments include Vehicle Type, Vendor Type, Fuel Type, Sales Channel.
4. Can you provide details about the market size?
The market size is estimated to be USD 38.5 Million as of 2022.
5. What are some drivers contributing to market growth?
Rising Adoption of Digital Technologies.
6. What are the notable trends driving market growth?
Rising Adoption of Digital Technologies Will Foster the Growth of the Target Market.
7. Are there any restraints impacting market growth?
Increasing Fuel Prices to Hinder the Demand for Used Cars.
8. Can you provide examples of recent developments in the market?
November 2022: The Dar Es Salaam port in Tanzania witnessed a remarkable annual increase of 316% in the importation of both new and used vehicles by Zimbabweans in 2022, compared to the figures recorded in 2016. As of November 2022, it was estimated that approximately 15,000 vehicles were being imported annually by Zimbabweans through this port, a significant surge from the mere 3,600 vehicles in 2016. This substantial shift in preference towards Dar Es Salaam port for shipments by Zimbabwe's used car dealers can be attributed to challenges in the South African ports' logistical operations.
9. What pricing options are available for accessing the report?
Pricing options include single-user, multi-user, and enterprise licenses priced at USD 3800, USD 4500, and USD 5800 respectively.
10. Is the market size provided in terms of value or volume?
The market size is provided in terms of value, measured in Million.
11. Are there any specific market keywords associated with the report?
Yes, the market keyword associated with the report is "Tanzania Used Car Market," which aids in identifying and referencing the specific market segment covered.
12. How do I determine which pricing option suits my needs best?
The pricing options vary based on user requirements and access needs. Individual users may opt for single-user licenses, while businesses requiring broader access may choose multi-user or enterprise licenses for cost-effective access to the report.
13. Are there any additional resources or data provided in the Tanzania Used Car Market report?
While the report offers comprehensive insights, it's advisable to review the specific contents or supplementary materials provided to ascertain if additional resources or data are available.
14. How can I stay updated on further developments or reports in the Tanzania Used Car Market?
To stay informed about further developments, trends, and reports in the Tanzania Used Car Market, consider subscribing to industry newsletters, following relevant companies and organizations, or regularly checking reputable industry news sources and publications.
Methodology
Step 1 - Identification of Relevant Samples Size from Population Database


Step 2 - Approaches for Defining Global Market Size (Value, Volume* & Price*)

Note*: In applicable scenarios
Step 3 - Data Sources
Primary Research
- Web Analytics
- Survey Reports
- Research Institute
- Latest Research Reports
- Opinion Leaders
Secondary Research
- Annual Reports
- White Paper
- Latest Press Release
- Industry Association
- Paid Database
- Investor Presentations

Step 4 - Data Triangulation
Involves using different sources of information in order to increase the validity of a study
These sources are likely to be stakeholders in a program - participants, other researchers, program staff, other community members, and so on.
Then we put all data in single framework & apply various statistical tools to find out the dynamic on the market.
During the analysis stage, feedback from the stakeholder groups would be compared to determine areas of agreement as well as areas of divergence