

Key Insights
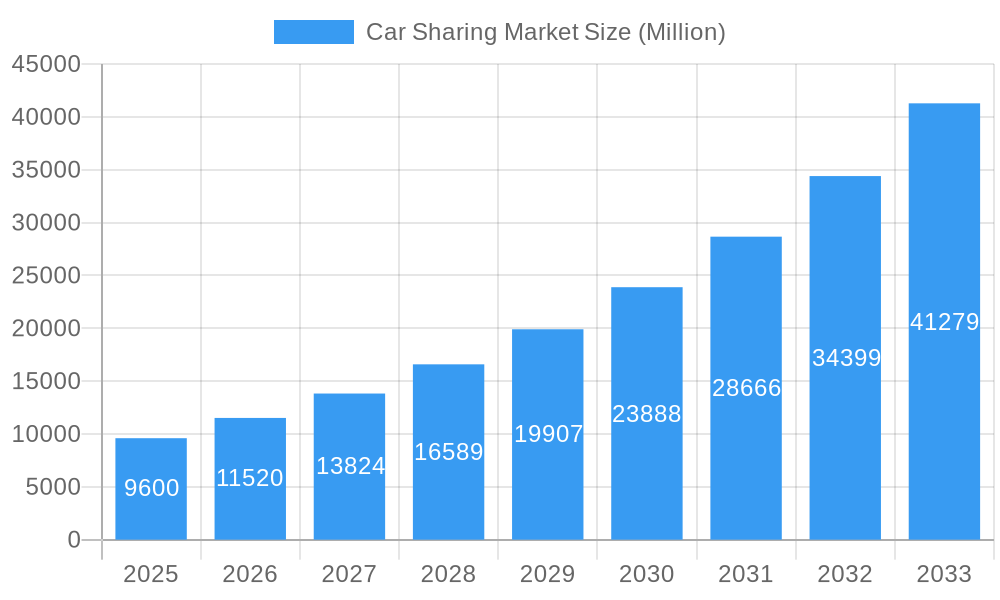
The car-sharing market is experiencing robust growth, projected to reach a market size of $9.6 billion in 2025 and exhibiting a Compound Annual Growth Rate (CAGR) of 20% from 2019 to 2033. This expansion is fueled by several key drivers. Increasing urbanization and traffic congestion in major cities are prompting individuals to seek alternative transportation solutions, reducing reliance on personal vehicle ownership. The rising cost of car ownership, including insurance, maintenance, and parking, further incentivizes the adoption of car-sharing services. Furthermore, the growing environmental awareness among consumers is driving demand for sustainable transportation options, with car-sharing contributing to reduced carbon emissions compared to individual car ownership. Technological advancements, such as improved mobile applications for booking and managing shared vehicles, and the integration of smart technologies within vehicles themselves, are also contributing to market growth. The rise of subscription-based models and flexible usage options further enhances the attractiveness of car-sharing for diverse consumer needs.
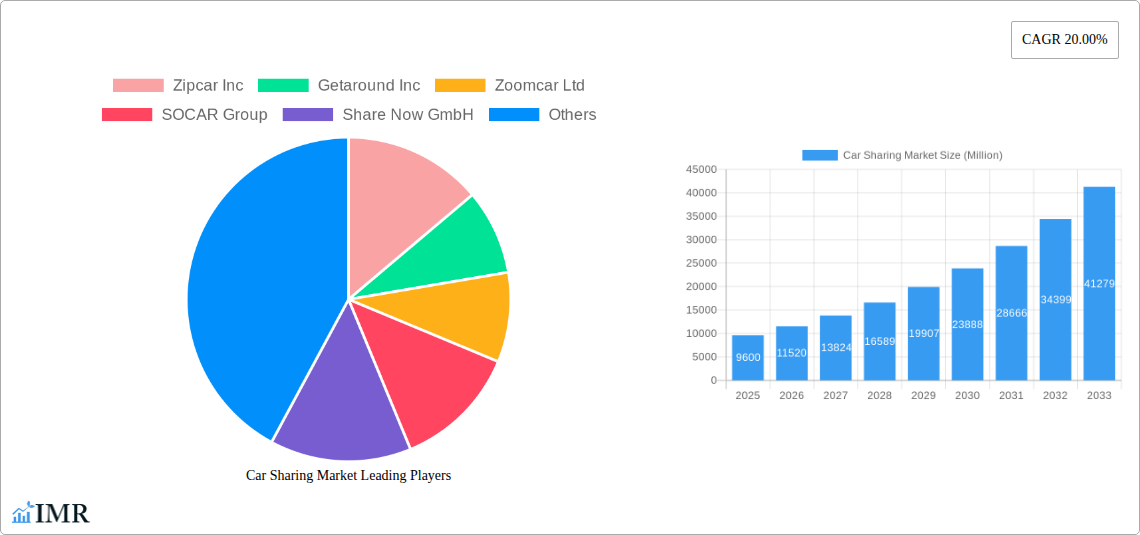
Car Sharing Market Market Size (In Billion)
However, the market faces certain challenges. Regulatory hurdles, varying across different regions, can pose obstacles to market expansion. Concerns regarding insurance liabilities and accident responsibilities need to be addressed effectively to ensure smooth operations and build consumer confidence. Competition among established players and new entrants is intensifying, requiring companies to innovate and differentiate their offerings to maintain a competitive edge. Furthermore, the dependence on reliable technology infrastructure and access to reliable charging infrastructure for electric car-sharing options can influence market penetration in certain regions. Despite these challenges, the long-term outlook for the car-sharing market remains positive, driven by evolving consumer preferences and supportive technological innovations. The market is expected to see significant growth in various regions globally, with the most significant growth anticipated in rapidly urbanizing areas with favorable regulatory environments.
Car Sharing Market Company Market Share
Car Sharing Market: A Comprehensive Report (2019-2033)
This comprehensive report offers an in-depth analysis of the global car sharing market, encompassing market dynamics, growth trends, regional landscapes, key players, and future outlook. The study period covers 2019-2033, with 2025 as the base year and a forecast period of 2025-2033. The report leverages extensive data analysis to provide valuable insights for industry professionals, investors, and strategic decision-makers. The market is segmented by various factors (details within), providing a granular understanding of the evolving landscape. The total market size is predicted to reach xx Million units by 2033.
Parent Market: Transportation Services Market Child Market: Peer-to-peer car sharing, Corporate car sharing, Short-term rental services
Car Sharing Market Dynamics & Structure
The car-sharing market is characterized by a dynamic interplay of factors influencing its structure and growth trajectory. Market concentration is relatively moderate, with several key players vying for market share. However, there's potential for consolidation through mergers and acquisitions (M&A). Technological innovation, particularly in areas like autonomous driving and connected car technology, is a significant driver. Regulatory frameworks, varying across regions, influence operational costs and market access. The rise of ride-hailing services presents a competitive substitute. End-user demographics are expanding beyond urban millennials, with broader adoption across age groups and income brackets.
- Market Concentration: Moderately fragmented, with top 5 players holding approximately xx% market share (2024).
- Technological Innovation: Autonomous vehicles, connected car technology, and improved mobile apps are key drivers.
- Regulatory Framework: Varying regulations across different countries impact operational costs and market entry.
- Competitive Substitutes: Ride-hailing services (e.g., Uber, Lyft) pose significant competition.
- End-User Demographics: Expanding beyond urban millennials, encompassing diverse age groups and income levels.
- M&A Trends: A moderate level of M&A activity observed in recent years, with xx major deals recorded in the historical period.
Car Sharing Market Growth Trends & Insights
The car-sharing market has witnessed substantial growth during the historical period (2019-2024), driven by increasing urbanization, rising fuel prices, and growing environmental concerns. Adoption rates are accelerating, particularly in urban centers with robust public transportation networks. Technological disruptions, such as the integration of autonomous driving capabilities, are poised to revolutionize the industry. Consumer behavior shifts reflect a preference for on-demand mobility solutions, emphasizing convenience and cost-effectiveness. The market is projected to experience a compound annual growth rate (CAGR) of xx% during the forecast period (2025-2033), reaching a market size of xx Million units by 2033. Market penetration is expected to increase from xx% in 2024 to xx% by 2033, particularly in developing economies.
Dominant Regions, Countries, or Segments in Car Sharing Market
North America and Europe currently lead the car-sharing market, driven by favorable regulatory environments, high vehicle ownership rates, and a strong technological infrastructure. However, Asia-Pacific is experiencing rapid growth, fueled by increasing urbanization and rising disposable incomes. Specific countries like the U.S., China, and Germany are major contributors to the overall market size.
- Key Drivers in North America: High vehicle ownership, established technological infrastructure, and favorable regulations.
- Key Drivers in Europe: Dense urban populations, supportive government policies, and strong public transportation systems.
- Key Drivers in Asia-Pacific: Rapid urbanization, growing middle class, and increasing smartphone penetration.
- Market Share: North America holds approximately xx% market share, followed by Europe with xx% and Asia-Pacific with xx% (2024).
- Growth Potential: Asia-Pacific is expected to exhibit the highest growth rate during the forecast period.
Car Sharing Market Product Landscape
The car-sharing market offers a variety of service models, including peer-to-peer (P2P) rentals, short-term rentals from established companies, and corporate car-sharing programs. Product innovations focus on enhanced user interfaces, improved vehicle tracking systems, and integration with other mobility services. Key features include flexible booking options, convenient pick-up and drop-off locations, and transparent pricing models. Technological advancements are streamlining the booking process, improving vehicle management, and enhancing the overall user experience.
Key Drivers, Barriers & Challenges in Car Sharing Market
Key Drivers:
- Increasing urbanization and traffic congestion.
- Rising fuel prices and environmental concerns.
- Growing preference for on-demand mobility solutions.
- Technological advancements in vehicle sharing platforms.
Key Challenges:
- Intense competition from established players and ride-hailing services.
- Regulatory hurdles and varying legal frameworks across different regions.
- Insurance and liability issues related to vehicle damage or accidents.
- Supply chain disruptions impacting vehicle availability and maintenance. These challenges impact profitability by an estimated xx% annually.
Emerging Opportunities in Car Sharing Market
- Expansion into untapped markets in developing countries.
- Integration of autonomous vehicles into car-sharing fleets.
- Development of specialized car-sharing services for specific demographics (e.g., elderly, students).
- Partnerships with businesses to offer employee car-sharing programs.
Growth Accelerators in the Car Sharing Market Industry
Technological breakthroughs such as the development of autonomous vehicles and the implementation of advanced reservation and management software are poised to significantly accelerate market growth. Strategic alliances between car-sharing companies and automobile manufacturers are facilitating fleet expansion and the provision of newer, more environmentally friendly vehicles. Moreover, aggressive market expansion strategies, focusing on penetrating new geographical areas and diversifying service offerings, will further propel the car-sharing market's trajectory.
Key Players Shaping the Car Sharing Market Market
- Zipcar Inc
- Getaround Inc
- Zoomcar Ltd
- SOCAR Group
- Share Now GmbH
- Grab Holdings Limited
- Turo Inc
- Scoop Technologies Inc
- BlaBlaCar (Comuto SA)
- Enterprise Holdings Inc
- Enilive S p A (Enjoy Car Sharing)
Notable Milestones in Car Sharing Market Sector
- March 2024: Waymo launches its free Waymo One ride-hailing service in Los Angeles. This signifies a significant step towards the integration of autonomous vehicles into the car-sharing market.
- February 2024: Zoomcar partners with CARS24 to support local car-sharing hosts with vehicle financing and fleet expansion. This enhances the supply of vehicles within the P2P car-sharing sector.
In-Depth Car Sharing Market Market Outlook
The future of the car-sharing market is exceptionally promising, driven by continuous technological advancements, favorable regulatory landscapes in many regions, and increasing consumer preference for flexible mobility options. Strategic partnerships, expansions into emerging markets, and the integration of sustainable transportation solutions will create significant growth opportunities for industry players. The market's future trajectory promises substantial expansion, with predictions pointing towards a market size exceeding xx Million units by 2033.
Car Sharing Market Segmentation
-
1. Booking Type
- 1.1. Online Booking
- 1.2. Offline Booking
-
2. Application Type
- 2.1. Business/Corporate
- 2.2. Leisure
-
3. Vehicle Type
- 3.1. Hatchback
- 3.2. Sedan
- 3.3. Sports Utility Vehicles
- 3.4. Multi-Purpose Vehicles
-
4. Type
- 4.1. Peer-To-Peer
- 4.2. Free Floating
-
5. Trip Type
- 5.1. One-Way
- 5.2. Round Trip
Car Sharing Market Segmentation By Geography
-
1. North America
- 1.1. United States
- 1.2. Canada
- 1.3. Rest of North America
-
2. Europe
- 2.1. Germany
- 2.2. United Kingdom
- 2.3. France
- 2.4. Italy
- 2.5. Spain
- 2.6. Rest of Europe
-
3. Asia Pacific
- 3.1. China
- 3.2. India
- 3.3. Japan
- 3.4. South Korea
- 3.5. Rest of Asia Pacific
-
4. Rest of the World
- 4.1. South America
- 4.2. Middle East and Africa
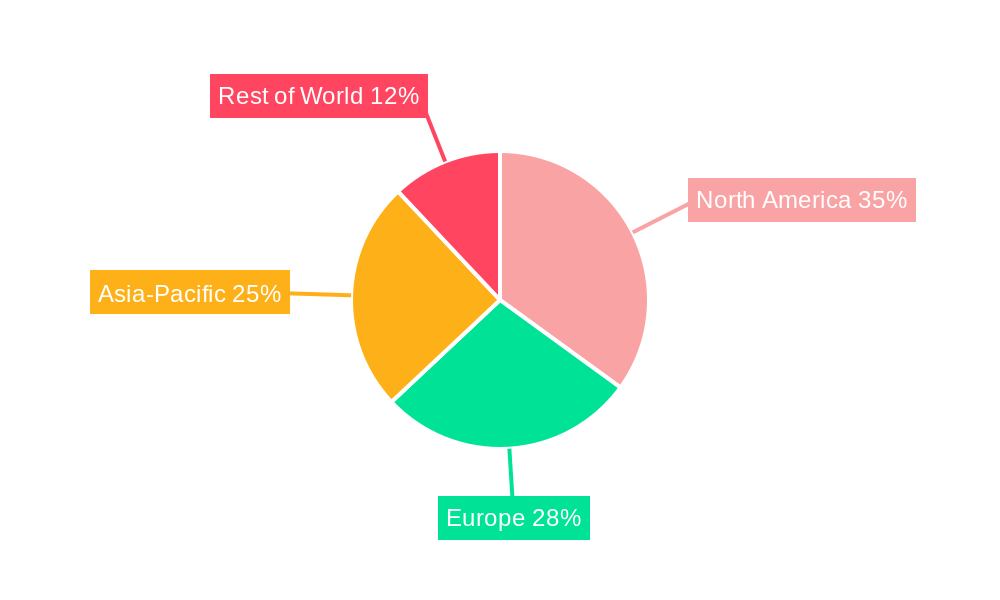
Car Sharing Market Regional Market Share
Geographic Coverage of Car Sharing Market
Car Sharing Market REPORT HIGHLIGHTS
| Aspects | Details |
|---|---|
| Study Period | 2020-2034 |
| Base Year | 2025 |
| Estimated Year | 2026 |
| Forecast Period | 2026-2034 |
| Historical Period | 2020-2025 |
| Growth Rate | CAGR of 20.00% from 2020-2034 |
| Segmentation |
|
Table of Contents
- 1. Introduction
- 1.1. Research Scope
- 1.2. Market Segmentation
- 1.3. Research Objective
- 1.4. Definitions and Assumptions
- 2. Executive Summary
- 2.1. Market Snapshot
- 3. Market Dynamics
- 3.1. Market Drivers
- 3.2. Market Restrains
- 3.3. Market Trends
- 3.4. Market Opportunities
- 4. Market Factor Analysis
- 4.1. Porters Five Forces
- 4.1.1. Bargaining Power of Suppliers
- 4.1.2. Bargaining Power of Buyers
- 4.1.3. Threat of New Entrants
- 4.1.4. Threat of Substitutes
- 4.1.5. Competitive Rivalry
- 4.2. PESTEL analysis
- 4.3. BCG Analysis
- 4.3.1. Stars (High Growth, High Market Share)
- 4.3.2. Cash Cows (Low Growth, High Market Share)
- 4.3.3. Question Mark (High Growth, Low Market Share)
- 4.3.4. Dogs (Low Growth, Low Market Share)
- 4.4. Ansoff Matrix Analysis
- 4.5. Supply Chain Analysis
- 4.6. Regulatory Landscape
- 4.7. Current Market Potential and Opportunity Assessment (TAM–SAM–SOM Framework)
- 4.8. IMR Analyst Note
- 4.1. Porters Five Forces
- 5. Market Analysis, Insights and Forecast 2021-2033
- 5.1. Market Analysis, Insights and Forecast - by Booking Type
- 5.1.1. Online Booking
- 5.1.2. Offline Booking
- 5.2. Market Analysis, Insights and Forecast - by Application Type
- 5.2.1. Business/Corporate
- 5.2.2. Leisure
- 5.3. Market Analysis, Insights and Forecast - by Vehicle Type
- 5.3.1. Hatchback
- 5.3.2. Sedan
- 5.3.3. Sports Utility Vehicles
- 5.3.4. Multi-Purpose Vehicles
- 5.4. Market Analysis, Insights and Forecast - by Type
- 5.4.1. Peer-To-Peer
- 5.4.2. Free Floating
- 5.5. Market Analysis, Insights and Forecast - by Trip Type
- 5.5.1. One-Way
- 5.5.2. Round Trip
- 5.6. Market Analysis, Insights and Forecast - by Region
- 5.6.1. North America
- 5.6.2. Europe
- 5.6.3. Asia Pacific
- 5.6.4. Rest of the World
- 5.1. Market Analysis, Insights and Forecast - by Booking Type
- 6. Global Car Sharing Market Analysis, Insights and Forecast, 2021-2033
- 6.1. Market Analysis, Insights and Forecast - by Booking Type
- 6.1.1. Online Booking
- 6.1.2. Offline Booking
- 6.2. Market Analysis, Insights and Forecast - by Application Type
- 6.2.1. Business/Corporate
- 6.2.2. Leisure
- 6.3. Market Analysis, Insights and Forecast - by Vehicle Type
- 6.3.1. Hatchback
- 6.3.2. Sedan
- 6.3.3. Sports Utility Vehicles
- 6.3.4. Multi-Purpose Vehicles
- 6.4. Market Analysis, Insights and Forecast - by Type
- 6.4.1. Peer-To-Peer
- 6.4.2. Free Floating
- 6.5. Market Analysis, Insights and Forecast - by Trip Type
- 6.5.1. One-Way
- 6.5.2. Round Trip
- 6.1. Market Analysis, Insights and Forecast - by Booking Type
- 7. North America Car Sharing Market Analysis, Insights and Forecast, 2020-2032
- 7.1. Market Analysis, Insights and Forecast - by Booking Type
- 7.1.1. Online Booking
- 7.1.2. Offline Booking
- 7.2. Market Analysis, Insights and Forecast - by Application Type
- 7.2.1. Business/Corporate
- 7.2.2. Leisure
- 7.3. Market Analysis, Insights and Forecast - by Vehicle Type
- 7.3.1. Hatchback
- 7.3.2. Sedan
- 7.3.3. Sports Utility Vehicles
- 7.3.4. Multi-Purpose Vehicles
- 7.4. Market Analysis, Insights and Forecast - by Type
- 7.4.1. Peer-To-Peer
- 7.4.2. Free Floating
- 7.5. Market Analysis, Insights and Forecast - by Trip Type
- 7.5.1. One-Way
- 7.5.2. Round Trip
- 7.1. Market Analysis, Insights and Forecast - by Booking Type
- 8. Europe Car Sharing Market Analysis, Insights and Forecast, 2020-2032
- 8.1. Market Analysis, Insights and Forecast - by Booking Type
- 8.1.1. Online Booking
- 8.1.2. Offline Booking
- 8.2. Market Analysis, Insights and Forecast - by Application Type
- 8.2.1. Business/Corporate
- 8.2.2. Leisure
- 8.3. Market Analysis, Insights and Forecast - by Vehicle Type
- 8.3.1. Hatchback
- 8.3.2. Sedan
- 8.3.3. Sports Utility Vehicles
- 8.3.4. Multi-Purpose Vehicles
- 8.4. Market Analysis, Insights and Forecast - by Type
- 8.4.1. Peer-To-Peer
- 8.4.2. Free Floating
- 8.5. Market Analysis, Insights and Forecast - by Trip Type
- 8.5.1. One-Way
- 8.5.2. Round Trip
- 8.1. Market Analysis, Insights and Forecast - by Booking Type
- 9. Asia Pacific Car Sharing Market Analysis, Insights and Forecast, 2020-2032
- 9.1. Market Analysis, Insights and Forecast - by Booking Type
- 9.1.1. Online Booking
- 9.1.2. Offline Booking
- 9.2. Market Analysis, Insights and Forecast - by Application Type
- 9.2.1. Business/Corporate
- 9.2.2. Leisure
- 9.3. Market Analysis, Insights and Forecast - by Vehicle Type
- 9.3.1. Hatchback
- 9.3.2. Sedan
- 9.3.3. Sports Utility Vehicles
- 9.3.4. Multi-Purpose Vehicles
- 9.4. Market Analysis, Insights and Forecast - by Type
- 9.4.1. Peer-To-Peer
- 9.4.2. Free Floating
- 9.5. Market Analysis, Insights and Forecast - by Trip Type
- 9.5.1. One-Way
- 9.5.2. Round Trip
- 9.1. Market Analysis, Insights and Forecast - by Booking Type
- 10. Rest of the World Car Sharing Market Analysis, Insights and Forecast, 2020-2032
- 10.1. Market Analysis, Insights and Forecast - by Booking Type
- 10.1.1. Online Booking
- 10.1.2. Offline Booking
- 10.2. Market Analysis, Insights and Forecast - by Application Type
- 10.2.1. Business/Corporate
- 10.2.2. Leisure
- 10.3. Market Analysis, Insights and Forecast - by Vehicle Type
- 10.3.1. Hatchback
- 10.3.2. Sedan
- 10.3.3. Sports Utility Vehicles
- 10.3.4. Multi-Purpose Vehicles
- 10.4. Market Analysis, Insights and Forecast - by Type
- 10.4.1. Peer-To-Peer
- 10.4.2. Free Floating
- 10.5. Market Analysis, Insights and Forecast - by Trip Type
- 10.5.1. One-Way
- 10.5.2. Round Trip
- 10.1. Market Analysis, Insights and Forecast - by Booking Type
- 11. Competitive Analysis
- 11.1. Company Profiles
- 11.1.1 Zipcar Inc
- 11.1.1.1. Company Overview
- 11.1.1.2. Products
- 11.1.1.3. Company Financials
- 11.1.1.4. SWOT Analysis
- 11.1.2 Getaround Inc
- 11.1.2.1. Company Overview
- 11.1.2.2. Products
- 11.1.2.3. Company Financials
- 11.1.2.4. SWOT Analysis
- 11.1.3 Zoomcar Ltd
- 11.1.3.1. Company Overview
- 11.1.3.2. Products
- 11.1.3.3. Company Financials
- 11.1.3.4. SWOT Analysis
- 11.1.4 SOCAR Group
- 11.1.4.1. Company Overview
- 11.1.4.2. Products
- 11.1.4.3. Company Financials
- 11.1.4.4. SWOT Analysis
- 11.1.5 Share Now GmbH
- 11.1.5.1. Company Overview
- 11.1.5.2. Products
- 11.1.5.3. Company Financials
- 11.1.5.4. SWOT Analysis
- 11.1.6 Grab Holdings Limited
- 11.1.6.1. Company Overview
- 11.1.6.2. Products
- 11.1.6.3. Company Financials
- 11.1.6.4. SWOT Analysis
- 11.1.7 Turo Inc
- 11.1.7.1. Company Overview
- 11.1.7.2. Products
- 11.1.7.3. Company Financials
- 11.1.7.4. SWOT Analysis
- 11.1.8 Scoop Technologies Inc
- 11.1.8.1. Company Overview
- 11.1.8.2. Products
- 11.1.8.3. Company Financials
- 11.1.8.4. SWOT Analysis
- 11.1.9 BlaBlaCar (Comuto SA)
- 11.1.9.1. Company Overview
- 11.1.9.2. Products
- 11.1.9.3. Company Financials
- 11.1.9.4. SWOT Analysis
- 11.1.10 Enterprise Holdings Inc
- 11.1.10.1. Company Overview
- 11.1.10.2. Products
- 11.1.10.3. Company Financials
- 11.1.10.4. SWOT Analysis
- 11.1.11 Enilive S p A (Enjoy Car Sharing
- 11.1.11.1. Company Overview
- 11.1.11.2. Products
- 11.1.11.3. Company Financials
- 11.1.11.4. SWOT Analysis
- 11.1.1 Zipcar Inc
- 11.2. Market Entropy
- 11.2.1 Company's Key Areas Served
- 11.2.2 Recent Developments
- 11.3. Company Market Share Analysis 2025
- 11.3.1 Top 5 Companies Market Share Analysis
- 11.3.2 Top 3 Companies Market Share Analysis
- 11.4. List of Potential Customers
- 12. Research Methodology
List of Figures
- Figure 1: Global Car Sharing Market Revenue Breakdown (Million, %) by Region 2025 & 2033
- Figure 2: Global Car Sharing Market Volume Breakdown (Billion, %) by Region 2025 & 2033
- Figure 3: North America Car Sharing Market Revenue (Million), by Booking Type 2025 & 2033
- Figure 4: North America Car Sharing Market Volume (Billion), by Booking Type 2025 & 2033
- Figure 5: North America Car Sharing Market Revenue Share (%), by Booking Type 2025 & 2033
- Figure 6: North America Car Sharing Market Volume Share (%), by Booking Type 2025 & 2033
- Figure 7: North America Car Sharing Market Revenue (Million), by Application Type 2025 & 2033
- Figure 8: North America Car Sharing Market Volume (Billion), by Application Type 2025 & 2033
- Figure 9: North America Car Sharing Market Revenue Share (%), by Application Type 2025 & 2033
- Figure 10: North America Car Sharing Market Volume Share (%), by Application Type 2025 & 2033
- Figure 11: North America Car Sharing Market Revenue (Million), by Vehicle Type 2025 & 2033
- Figure 12: North America Car Sharing Market Volume (Billion), by Vehicle Type 2025 & 2033
- Figure 13: North America Car Sharing Market Revenue Share (%), by Vehicle Type 2025 & 2033
- Figure 14: North America Car Sharing Market Volume Share (%), by Vehicle Type 2025 & 2033
- Figure 15: North America Car Sharing Market Revenue (Million), by Type 2025 & 2033
- Figure 16: North America Car Sharing Market Volume (Billion), by Type 2025 & 2033
- Figure 17: North America Car Sharing Market Revenue Share (%), by Type 2025 & 2033
- Figure 18: North America Car Sharing Market Volume Share (%), by Type 2025 & 2033
- Figure 19: North America Car Sharing Market Revenue (Million), by Trip Type 2025 & 2033
- Figure 20: North America Car Sharing Market Volume (Billion), by Trip Type 2025 & 2033
- Figure 21: North America Car Sharing Market Revenue Share (%), by Trip Type 2025 & 2033
- Figure 22: North America Car Sharing Market Volume Share (%), by Trip Type 2025 & 2033
- Figure 23: North America Car Sharing Market Revenue (Million), by Country 2025 & 2033
- Figure 24: North America Car Sharing Market Volume (Billion), by Country 2025 & 2033
- Figure 25: North America Car Sharing Market Revenue Share (%), by Country 2025 & 2033
- Figure 26: North America Car Sharing Market Volume Share (%), by Country 2025 & 2033
- Figure 27: Europe Car Sharing Market Revenue (Million), by Booking Type 2025 & 2033
- Figure 28: Europe Car Sharing Market Volume (Billion), by Booking Type 2025 & 2033
- Figure 29: Europe Car Sharing Market Revenue Share (%), by Booking Type 2025 & 2033
- Figure 30: Europe Car Sharing Market Volume Share (%), by Booking Type 2025 & 2033
- Figure 31: Europe Car Sharing Market Revenue (Million), by Application Type 2025 & 2033
- Figure 32: Europe Car Sharing Market Volume (Billion), by Application Type 2025 & 2033
- Figure 33: Europe Car Sharing Market Revenue Share (%), by Application Type 2025 & 2033
- Figure 34: Europe Car Sharing Market Volume Share (%), by Application Type 2025 & 2033
- Figure 35: Europe Car Sharing Market Revenue (Million), by Vehicle Type 2025 & 2033
- Figure 36: Europe Car Sharing Market Volume (Billion), by Vehicle Type 2025 & 2033
- Figure 37: Europe Car Sharing Market Revenue Share (%), by Vehicle Type 2025 & 2033
- Figure 38: Europe Car Sharing Market Volume Share (%), by Vehicle Type 2025 & 2033
- Figure 39: Europe Car Sharing Market Revenue (Million), by Type 2025 & 2033
- Figure 40: Europe Car Sharing Market Volume (Billion), by Type 2025 & 2033
- Figure 41: Europe Car Sharing Market Revenue Share (%), by Type 2025 & 2033
- Figure 42: Europe Car Sharing Market Volume Share (%), by Type 2025 & 2033
- Figure 43: Europe Car Sharing Market Revenue (Million), by Trip Type 2025 & 2033
- Figure 44: Europe Car Sharing Market Volume (Billion), by Trip Type 2025 & 2033
- Figure 45: Europe Car Sharing Market Revenue Share (%), by Trip Type 2025 & 2033
- Figure 46: Europe Car Sharing Market Volume Share (%), by Trip Type 2025 & 2033
- Figure 47: Europe Car Sharing Market Revenue (Million), by Country 2025 & 2033
- Figure 48: Europe Car Sharing Market Volume (Billion), by Country 2025 & 2033
- Figure 49: Europe Car Sharing Market Revenue Share (%), by Country 2025 & 2033
- Figure 50: Europe Car Sharing Market Volume Share (%), by Country 2025 & 2033
- Figure 51: Asia Pacific Car Sharing Market Revenue (Million), by Booking Type 2025 & 2033
- Figure 52: Asia Pacific Car Sharing Market Volume (Billion), by Booking Type 2025 & 2033
- Figure 53: Asia Pacific Car Sharing Market Revenue Share (%), by Booking Type 2025 & 2033
- Figure 54: Asia Pacific Car Sharing Market Volume Share (%), by Booking Type 2025 & 2033
- Figure 55: Asia Pacific Car Sharing Market Revenue (Million), by Application Type 2025 & 2033
- Figure 56: Asia Pacific Car Sharing Market Volume (Billion), by Application Type 2025 & 2033
- Figure 57: Asia Pacific Car Sharing Market Revenue Share (%), by Application Type 2025 & 2033
- Figure 58: Asia Pacific Car Sharing Market Volume Share (%), by Application Type 2025 & 2033
- Figure 59: Asia Pacific Car Sharing Market Revenue (Million), by Vehicle Type 2025 & 2033
- Figure 60: Asia Pacific Car Sharing Market Volume (Billion), by Vehicle Type 2025 & 2033
- Figure 61: Asia Pacific Car Sharing Market Revenue Share (%), by Vehicle Type 2025 & 2033
- Figure 62: Asia Pacific Car Sharing Market Volume Share (%), by Vehicle Type 2025 & 2033
- Figure 63: Asia Pacific Car Sharing Market Revenue (Million), by Type 2025 & 2033
- Figure 64: Asia Pacific Car Sharing Market Volume (Billion), by Type 2025 & 2033
- Figure 65: Asia Pacific Car Sharing Market Revenue Share (%), by Type 2025 & 2033
- Figure 66: Asia Pacific Car Sharing Market Volume Share (%), by Type 2025 & 2033
- Figure 67: Asia Pacific Car Sharing Market Revenue (Million), by Trip Type 2025 & 2033
- Figure 68: Asia Pacific Car Sharing Market Volume (Billion), by Trip Type 2025 & 2033
- Figure 69: Asia Pacific Car Sharing Market Revenue Share (%), by Trip Type 2025 & 2033
- Figure 70: Asia Pacific Car Sharing Market Volume Share (%), by Trip Type 2025 & 2033
- Figure 71: Asia Pacific Car Sharing Market Revenue (Million), by Country 2025 & 2033
- Figure 72: Asia Pacific Car Sharing Market Volume (Billion), by Country 2025 & 2033
- Figure 73: Asia Pacific Car Sharing Market Revenue Share (%), by Country 2025 & 2033
- Figure 74: Asia Pacific Car Sharing Market Volume Share (%), by Country 2025 & 2033
- Figure 75: Rest of the World Car Sharing Market Revenue (Million), by Booking Type 2025 & 2033
- Figure 76: Rest of the World Car Sharing Market Volume (Billion), by Booking Type 2025 & 2033
- Figure 77: Rest of the World Car Sharing Market Revenue Share (%), by Booking Type 2025 & 2033
- Figure 78: Rest of the World Car Sharing Market Volume Share (%), by Booking Type 2025 & 2033
- Figure 79: Rest of the World Car Sharing Market Revenue (Million), by Application Type 2025 & 2033
- Figure 80: Rest of the World Car Sharing Market Volume (Billion), by Application Type 2025 & 2033
- Figure 81: Rest of the World Car Sharing Market Revenue Share (%), by Application Type 2025 & 2033
- Figure 82: Rest of the World Car Sharing Market Volume Share (%), by Application Type 2025 & 2033
- Figure 83: Rest of the World Car Sharing Market Revenue (Million), by Vehicle Type 2025 & 2033
- Figure 84: Rest of the World Car Sharing Market Volume (Billion), by Vehicle Type 2025 & 2033
- Figure 85: Rest of the World Car Sharing Market Revenue Share (%), by Vehicle Type 2025 & 2033
- Figure 86: Rest of the World Car Sharing Market Volume Share (%), by Vehicle Type 2025 & 2033
- Figure 87: Rest of the World Car Sharing Market Revenue (Million), by Type 2025 & 2033
- Figure 88: Rest of the World Car Sharing Market Volume (Billion), by Type 2025 & 2033
- Figure 89: Rest of the World Car Sharing Market Revenue Share (%), by Type 2025 & 2033
- Figure 90: Rest of the World Car Sharing Market Volume Share (%), by Type 2025 & 2033
- Figure 91: Rest of the World Car Sharing Market Revenue (Million), by Trip Type 2025 & 2033
- Figure 92: Rest of the World Car Sharing Market Volume (Billion), by Trip Type 2025 & 2033
- Figure 93: Rest of the World Car Sharing Market Revenue Share (%), by Trip Type 2025 & 2033
- Figure 94: Rest of the World Car Sharing Market Volume Share (%), by Trip Type 2025 & 2033
- Figure 95: Rest of the World Car Sharing Market Revenue (Million), by Country 2025 & 2033
- Figure 96: Rest of the World Car Sharing Market Volume (Billion), by Country 2025 & 2033
- Figure 97: Rest of the World Car Sharing Market Revenue Share (%), by Country 2025 & 2033
- Figure 98: Rest of the World Car Sharing Market Volume Share (%), by Country 2025 & 2033
List of Tables
- Table 1: Global Car Sharing Market Revenue Million Forecast, by Booking Type 2020 & 2033
- Table 2: Global Car Sharing Market Volume Billion Forecast, by Booking Type 2020 & 2033
- Table 3: Global Car Sharing Market Revenue Million Forecast, by Application Type 2020 & 2033
- Table 4: Global Car Sharing Market Volume Billion Forecast, by Application Type 2020 & 2033
- Table 5: Global Car Sharing Market Revenue Million Forecast, by Vehicle Type 2020 & 2033
- Table 6: Global Car Sharing Market Volume Billion Forecast, by Vehicle Type 2020 & 2033
- Table 7: Global Car Sharing Market Revenue Million Forecast, by Type 2020 & 2033
- Table 8: Global Car Sharing Market Volume Billion Forecast, by Type 2020 & 2033
- Table 9: Global Car Sharing Market Revenue Million Forecast, by Trip Type 2020 & 2033
- Table 10: Global Car Sharing Market Volume Billion Forecast, by Trip Type 2020 & 2033
- Table 11: Global Car Sharing Market Revenue Million Forecast, by Region 2020 & 2033
- Table 12: Global Car Sharing Market Volume Billion Forecast, by Region 2020 & 2033
- Table 13: Global Car Sharing Market Revenue Million Forecast, by Booking Type 2020 & 2033
- Table 14: Global Car Sharing Market Volume Billion Forecast, by Booking Type 2020 & 2033
- Table 15: Global Car Sharing Market Revenue Million Forecast, by Application Type 2020 & 2033
- Table 16: Global Car Sharing Market Volume Billion Forecast, by Application Type 2020 & 2033
- Table 17: Global Car Sharing Market Revenue Million Forecast, by Vehicle Type 2020 & 2033
- Table 18: Global Car Sharing Market Volume Billion Forecast, by Vehicle Type 2020 & 2033
- Table 19: Global Car Sharing Market Revenue Million Forecast, by Type 2020 & 2033
- Table 20: Global Car Sharing Market Volume Billion Forecast, by Type 2020 & 2033
- Table 21: Global Car Sharing Market Revenue Million Forecast, by Trip Type 2020 & 2033
- Table 22: Global Car Sharing Market Volume Billion Forecast, by Trip Type 2020 & 2033
- Table 23: Global Car Sharing Market Revenue Million Forecast, by Country 2020 & 2033
- Table 24: Global Car Sharing Market Volume Billion Forecast, by Country 2020 & 2033
- Table 25: United States Car Sharing Market Revenue (Million) Forecast, by Application 2020 & 2033
- Table 26: United States Car Sharing Market Volume (Billion) Forecast, by Application 2020 & 2033
- Table 27: Canada Car Sharing Market Revenue (Million) Forecast, by Application 2020 & 2033
- Table 28: Canada Car Sharing Market Volume (Billion) Forecast, by Application 2020 & 2033
- Table 29: Rest of North America Car Sharing Market Revenue (Million) Forecast, by Application 2020 & 2033
- Table 30: Rest of North America Car Sharing Market Volume (Billion) Forecast, by Application 2020 & 2033
- Table 31: Global Car Sharing Market Revenue Million Forecast, by Booking Type 2020 & 2033
- Table 32: Global Car Sharing Market Volume Billion Forecast, by Booking Type 2020 & 2033
- Table 33: Global Car Sharing Market Revenue Million Forecast, by Application Type 2020 & 2033
- Table 34: Global Car Sharing Market Volume Billion Forecast, by Application Type 2020 & 2033
- Table 35: Global Car Sharing Market Revenue Million Forecast, by Vehicle Type 2020 & 2033
- Table 36: Global Car Sharing Market Volume Billion Forecast, by Vehicle Type 2020 & 2033
- Table 37: Global Car Sharing Market Revenue Million Forecast, by Type 2020 & 2033
- Table 38: Global Car Sharing Market Volume Billion Forecast, by Type 2020 & 2033
- Table 39: Global Car Sharing Market Revenue Million Forecast, by Trip Type 2020 & 2033
- Table 40: Global Car Sharing Market Volume Billion Forecast, by Trip Type 2020 & 2033
- Table 41: Global Car Sharing Market Revenue Million Forecast, by Country 2020 & 2033
- Table 42: Global Car Sharing Market Volume Billion Forecast, by Country 2020 & 2033
- Table 43: Germany Car Sharing Market Revenue (Million) Forecast, by Application 2020 & 2033
- Table 44: Germany Car Sharing Market Volume (Billion) Forecast, by Application 2020 & 2033
- Table 45: United Kingdom Car Sharing Market Revenue (Million) Forecast, by Application 2020 & 2033
- Table 46: United Kingdom Car Sharing Market Volume (Billion) Forecast, by Application 2020 & 2033
- Table 47: France Car Sharing Market Revenue (Million) Forecast, by Application 2020 & 2033
- Table 48: France Car Sharing Market Volume (Billion) Forecast, by Application 2020 & 2033
- Table 49: Italy Car Sharing Market Revenue (Million) Forecast, by Application 2020 & 2033
- Table 50: Italy Car Sharing Market Volume (Billion) Forecast, by Application 2020 & 2033
- Table 51: Spain Car Sharing Market Revenue (Million) Forecast, by Application 2020 & 2033
- Table 52: Spain Car Sharing Market Volume (Billion) Forecast, by Application 2020 & 2033
- Table 53: Rest of Europe Car Sharing Market Revenue (Million) Forecast, by Application 2020 & 2033
- Table 54: Rest of Europe Car Sharing Market Volume (Billion) Forecast, by Application 2020 & 2033
- Table 55: Global Car Sharing Market Revenue Million Forecast, by Booking Type 2020 & 2033
- Table 56: Global Car Sharing Market Volume Billion Forecast, by Booking Type 2020 & 2033
- Table 57: Global Car Sharing Market Revenue Million Forecast, by Application Type 2020 & 2033
- Table 58: Global Car Sharing Market Volume Billion Forecast, by Application Type 2020 & 2033
- Table 59: Global Car Sharing Market Revenue Million Forecast, by Vehicle Type 2020 & 2033
- Table 60: Global Car Sharing Market Volume Billion Forecast, by Vehicle Type 2020 & 2033
- Table 61: Global Car Sharing Market Revenue Million Forecast, by Type 2020 & 2033
- Table 62: Global Car Sharing Market Volume Billion Forecast, by Type 2020 & 2033
- Table 63: Global Car Sharing Market Revenue Million Forecast, by Trip Type 2020 & 2033
- Table 64: Global Car Sharing Market Volume Billion Forecast, by Trip Type 2020 & 2033
- Table 65: Global Car Sharing Market Revenue Million Forecast, by Country 2020 & 2033
- Table 66: Global Car Sharing Market Volume Billion Forecast, by Country 2020 & 2033
- Table 67: China Car Sharing Market Revenue (Million) Forecast, by Application 2020 & 2033
- Table 68: China Car Sharing Market Volume (Billion) Forecast, by Application 2020 & 2033
- Table 69: India Car Sharing Market Revenue (Million) Forecast, by Application 2020 & 2033
- Table 70: India Car Sharing Market Volume (Billion) Forecast, by Application 2020 & 2033
- Table 71: Japan Car Sharing Market Revenue (Million) Forecast, by Application 2020 & 2033
- Table 72: Japan Car Sharing Market Volume (Billion) Forecast, by Application 2020 & 2033
- Table 73: South Korea Car Sharing Market Revenue (Million) Forecast, by Application 2020 & 2033
- Table 74: South Korea Car Sharing Market Volume (Billion) Forecast, by Application 2020 & 2033
- Table 75: Rest of Asia Pacific Car Sharing Market Revenue (Million) Forecast, by Application 2020 & 2033
- Table 76: Rest of Asia Pacific Car Sharing Market Volume (Billion) Forecast, by Application 2020 & 2033
- Table 77: Global Car Sharing Market Revenue Million Forecast, by Booking Type 2020 & 2033
- Table 78: Global Car Sharing Market Volume Billion Forecast, by Booking Type 2020 & 2033
- Table 79: Global Car Sharing Market Revenue Million Forecast, by Application Type 2020 & 2033
- Table 80: Global Car Sharing Market Volume Billion Forecast, by Application Type 2020 & 2033
- Table 81: Global Car Sharing Market Revenue Million Forecast, by Vehicle Type 2020 & 2033
- Table 82: Global Car Sharing Market Volume Billion Forecast, by Vehicle Type 2020 & 2033
- Table 83: Global Car Sharing Market Revenue Million Forecast, by Type 2020 & 2033
- Table 84: Global Car Sharing Market Volume Billion Forecast, by Type 2020 & 2033
- Table 85: Global Car Sharing Market Revenue Million Forecast, by Trip Type 2020 & 2033
- Table 86: Global Car Sharing Market Volume Billion Forecast, by Trip Type 2020 & 2033
- Table 87: Global Car Sharing Market Revenue Million Forecast, by Country 2020 & 2033
- Table 88: Global Car Sharing Market Volume Billion Forecast, by Country 2020 & 2033
- Table 89: South America Car Sharing Market Revenue (Million) Forecast, by Application 2020 & 2033
- Table 90: South America Car Sharing Market Volume (Billion) Forecast, by Application 2020 & 2033
- Table 91: Middle East and Africa Car Sharing Market Revenue (Million) Forecast, by Application 2020 & 2033
- Table 92: Middle East and Africa Car Sharing Market Volume (Billion) Forecast, by Application 2020 & 2033
Frequently Asked Questions
1. What is the projected Compound Annual Growth Rate (CAGR) of the Car Sharing Market?
The projected CAGR is approximately 20.00%.
2. Which companies are prominent players in the Car Sharing Market?
Key companies in the market include Zipcar Inc, Getaround Inc, Zoomcar Ltd, SOCAR Group, Share Now GmbH, Grab Holdings Limited, Turo Inc, Scoop Technologies Inc, BlaBlaCar (Comuto SA), Enterprise Holdings Inc, Enilive S p A (Enjoy Car Sharing.
3. What are the main segments of the Car Sharing Market?
The market segments include Booking Type, Application Type, Vehicle Type, Type, Trip Type.
4. Can you provide details about the market size?
The market size is estimated to be USD 9.60 Million as of 2022.
5. What are some drivers contributing to market growth?
The Rise in Consumer Trend Toward Shared Mobility.
6. What are the notable trends driving market growth?
Online Booking Hold Major Market Share.
7. Are there any restraints impacting market growth?
The Rise in Consumer Trend Toward Shared Mobility.
8. Can you provide examples of recent developments in the market?
In March 2024, Alphabet's autonomous driving division, Waymo, introduced its ride-hailing service, Waymo One, in Los Angeles, California. The service is being offered to the public for free, and this decision was made after the successful completion of the Waymo One Tour program that the company initiated in the city.
9. What pricing options are available for accessing the report?
Pricing options include single-user, multi-user, and enterprise licenses priced at USD 4750, USD 5250, and USD 8750 respectively.
10. Is the market size provided in terms of value or volume?
The market size is provided in terms of value, measured in Million and volume, measured in Billion.
11. Are there any specific market keywords associated with the report?
Yes, the market keyword associated with the report is "Car Sharing Market," which aids in identifying and referencing the specific market segment covered.
12. How do I determine which pricing option suits my needs best?
The pricing options vary based on user requirements and access needs. Individual users may opt for single-user licenses, while businesses requiring broader access may choose multi-user or enterprise licenses for cost-effective access to the report.
13. Are there any additional resources or data provided in the Car Sharing Market report?
While the report offers comprehensive insights, it's advisable to review the specific contents or supplementary materials provided to ascertain if additional resources or data are available.
14. How can I stay updated on further developments or reports in the Car Sharing Market?
To stay informed about further developments, trends, and reports in the Car Sharing Market, consider subscribing to industry newsletters, following relevant companies and organizations, or regularly checking reputable industry news sources and publications.
Methodology
Step 1 - Identification of Relevant Samples Size from Population Database


Step 2 - Approaches for Defining Global Market Size (Value, Volume* & Price*)

Note*: In applicable scenarios
Step 3 - Data Sources
Primary Research
- Web Analytics
- Survey Reports
- Research Institute
- Latest Research Reports
- Opinion Leaders
Secondary Research
- Annual Reports
- White Paper
- Latest Press Release
- Industry Association
- Paid Database
- Investor Presentations

Step 4 - Data Triangulation
Involves using different sources of information in order to increase the validity of a study
These sources are likely to be stakeholders in a program - participants, other researchers, program staff, other community members, and so on.
Then we put all data in single framework & apply various statistical tools to find out the dynamic on the market.
During the analysis stage, feedback from the stakeholder groups would be compared to determine areas of agreement as well as areas of divergence