

Key Insights
The Nordic bike-sharing market, encompassing Sweden, Norway, Finland, and Denmark, is experiencing robust expansion driven by heightened environmental consciousness, urban congestion, and governmental support for sustainable transport solutions. The market is projected to reach $280 million by 2024, with a Compound Annual Growth Rate (CAGR) of 7.8% through 2033. Key growth drivers include the increasing adoption of e-bikes, enhancing user accessibility and convenience, and the proliferation of dockless systems, offering superior flexibility over traditional docked stations. Supportive government subsidies and urban planning investments in cycling infrastructure further bolster market growth. However, challenges such as seasonal usage fluctuations due to Nordic weather conditions necessitate adaptive operational strategies. Intense competition among operators and the imperative for continuous technological advancement to optimize user experience and operational efficiency are ongoing market dynamics. The market is segmented by bike type, with both traditional and e-bikes holding significant shares, and dockless systems steadily gaining prominence. Sweden and Norway currently lead market penetration, owing to their well-established cycling cultures and infrastructure, with Finland and Denmark demonstrating rapid growth.
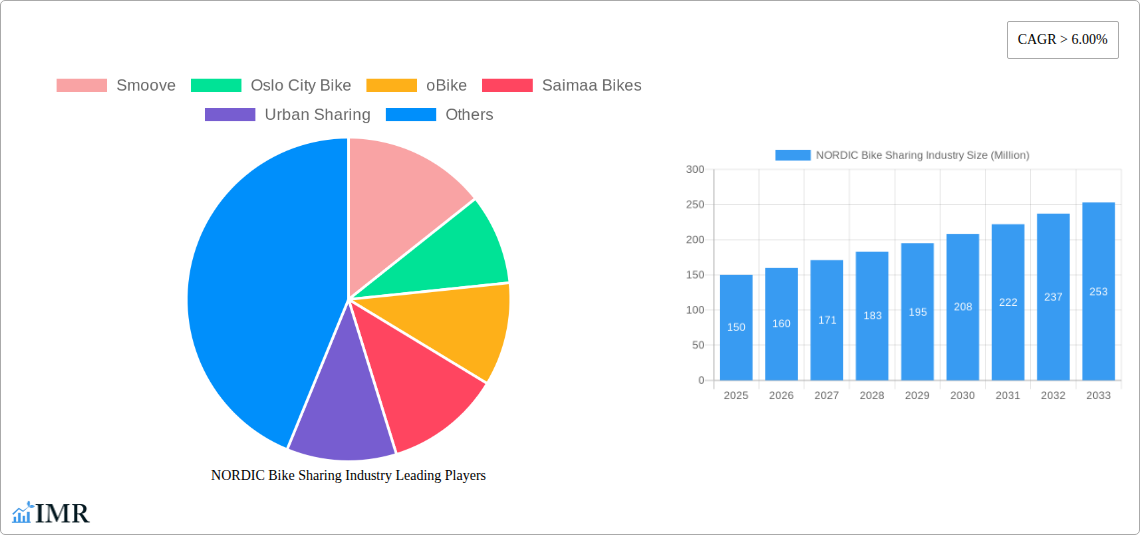
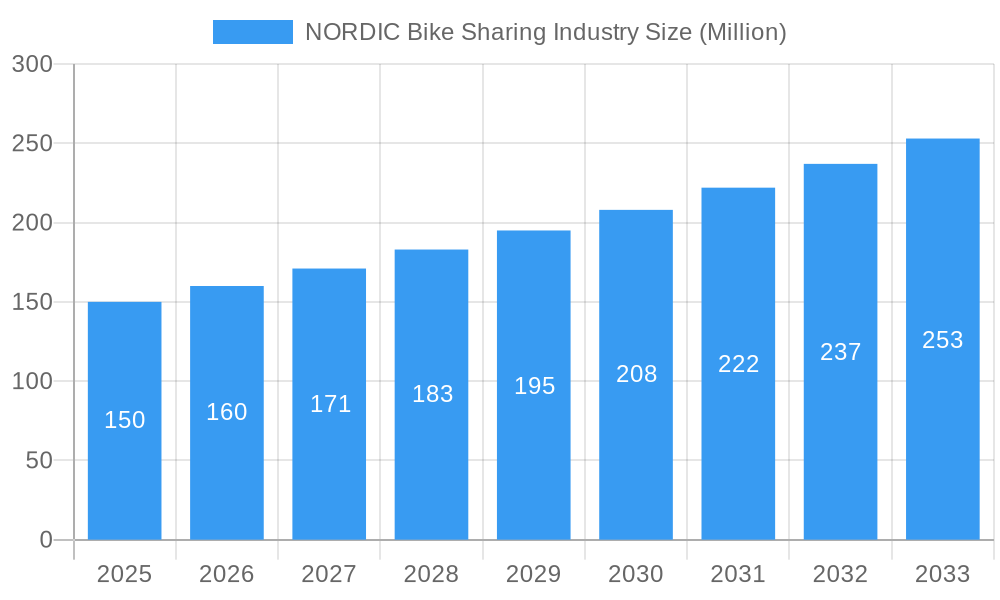
NORDIC Bike Sharing Industry Market Size (In Million)
The competitive arena features a mix of established regional operators and new international entrants. Key players are actively pursuing market share through advanced marketing strategies, innovative technology integration, such as intuitive booking systems and user-friendly applications, and strategic alliances. Future market expansion will depend on addressing sustainability imperatives, including enhanced e-bike battery recycling programs and efficient fleet management for reduced environmental impact. Opportunities for growth also exist in expanding services to smaller Nordic towns and cities, contingent on developing appropriate infrastructure. Consequently, sustained focus on technological innovation, eco-friendly practices, and strategic collaborations will be paramount for the enduring success of the Nordic bike-sharing sector.
NORDIC Bike Sharing Industry Company Market Share
NORDIC Bike Sharing Industry: A Comprehensive Market Report (2019-2033)
This in-depth report provides a comprehensive analysis of the Nordic bike-sharing industry, encompassing market dynamics, growth trends, key players, and future outlook. The study period covers 2019-2033, with a base year of 2025 and a forecast period of 2025-2033. This report is essential for industry professionals, investors, and strategic decision-makers seeking to understand and capitalize on opportunities within this rapidly evolving market. The report segments the market by bike type (traditional/regular bikes, e-bikes), sharing system type (docked, dockless), and country (Sweden, Norway, Finland, Denmark, Rest of Nordic Region).
NORDIC Bike Sharing Industry Market Dynamics & Structure
The Nordic bike-sharing market is characterized by a moderately fragmented landscape, with a mix of established players and emerging startups. Market concentration is relatively low, although some companies, such as Smoove and Oslo City Bike, hold significant regional market share. Technological innovation, particularly in e-bike technology and smart-locking systems, is a key driver of growth. Regulatory frameworks vary across Nordic countries, impacting market entry and operational costs. Competitive substitutes include public transportation and private vehicle ownership. End-user demographics are shifting towards younger, urban populations increasingly conscious of environmental sustainability. The past five years have witnessed a moderate level of M&A activity, primarily focused on consolidation within specific regions.
- Market Concentration: Low to moderate (xx% held by top 3 players in 2025)
- Technological Innovation: Significant advancements in e-bike technology and smart-locking systems.
- Regulatory Frameworks: Vary across countries; impact operational costs and market entry.
- Competitive Substitutes: Public transport, private vehicles.
- End-User Demographics: Younger, urban, environmentally conscious.
- M&A Activity: Moderate; xx deals completed between 2019-2024.
NORDIC Bike Sharing Industry Growth Trends & Insights
The Nordic bike-sharing market has experienced significant growth from 2019 to 2024, driven by increasing urbanization, environmental concerns, and government initiatives promoting sustainable transportation. The market size, measured by revenue, was estimated at xx million units in 2025, demonstrating a strong Compound Annual Growth Rate (CAGR) of xx% during the historical period. E-bike adoption has accelerated, contributing significantly to this growth. Technological disruptions, such as the introduction of dockless systems and improved mobile app integration, have enhanced user experience and convenience. Consumer behavior is shifting towards on-demand mobility solutions, further fueling market expansion. Market penetration is expected to reach xx% by 2033 in major urban centers, with continued growth anticipated in smaller cities and towns. This expansion is influenced by a growing acceptance of micro-mobility services and the integration of bike-sharing with other forms of sustainable transportation.
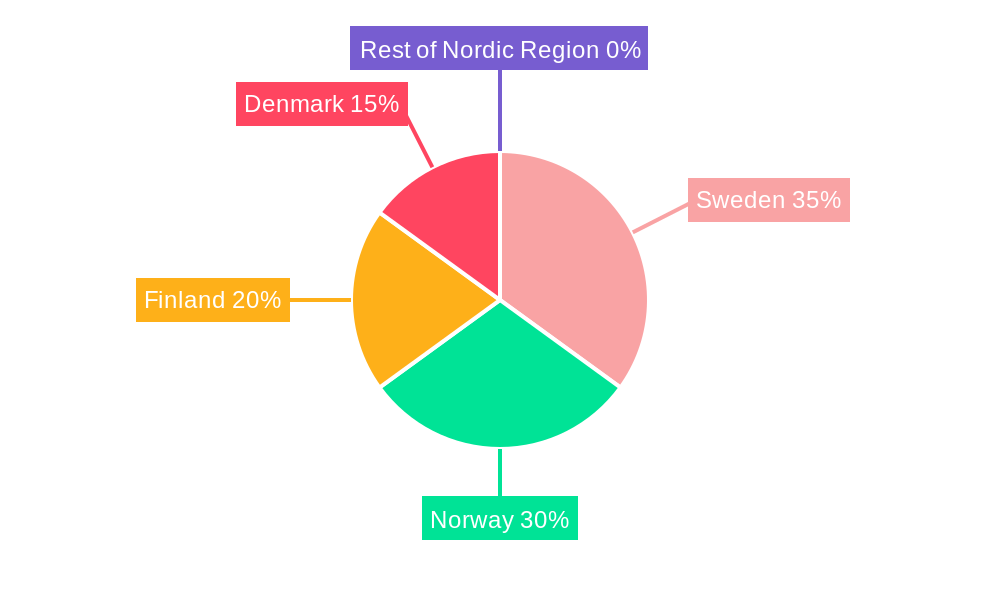
Dominant Regions, Countries, or Segments in NORDIC Bike Sharing Industry
Within the Nordic region, urban centers in Sweden and Denmark have consistently shown the highest adoption rates for bike-sharing services. This dominance is attributed to supportive government policies, well-developed cycling infrastructure, and favorable weather conditions. The e-bike segment is experiencing the most rapid growth, driven by consumer preference for longer distances and assistance with hills. Dockless systems have gained traction, particularly in densely populated areas, offering increased convenience and accessibility.
- Leading Region: Urban areas of Sweden and Denmark
- Leading Country: Sweden (Market Share: xx% in 2025)
- Leading Segment (Bike Type): E-bikes (Market Share: xx% in 2025)
- Leading Segment (Sharing System Type): Dockless (Market Share: xx% in 2025)
- Key Drivers: Government incentives, cycling infrastructure, favorable climate (in certain regions).
NORDIC Bike Sharing Industry Product Landscape
The Nordic bike-sharing market features a diverse range of products, including traditional bikes, e-bikes with varying levels of assistance, and cargo bikes. Innovations are focused on improved durability, integrated security features, and user-friendly mobile app interfaces. Key performance indicators include user satisfaction, ride duration, and operational efficiency. Unique selling propositions often center on integration with other mobility services, subscription models, and environmentally friendly manufacturing practices. Technological advancements are characterized by enhanced battery life, improved GPS tracking, and theft prevention mechanisms.
Key Drivers, Barriers & Challenges in NORDIC Bike Sharing Industry
Key Drivers:
- Growing environmental awareness.
- Government support for sustainable transportation.
- Increased urbanization and traffic congestion.
- Technological advancements (e.g., e-bikes, smart locking).
Challenges & Restraints:
- Vandalism and theft (estimated xx million units lost annually due to theft in 2025).
- Weather dependency (especially in Nordic climates).
- High initial investment costs for infrastructure and technology.
- Competition from other forms of transportation.
Emerging Opportunities in NORDIC Bike Sharing Industry
Emerging opportunities include expansion into smaller towns and rural areas, integrating bike-sharing with public transport systems, developing specialized bike-sharing programs for tourists, and offering subscription-based services tailored to individual needs. The development of cargo bikes for last-mile delivery also presents significant growth potential. Increased focus on data analytics to improve operational efficiency and enhance the user experience is another key area.
Growth Accelerators in the NORDIC Bike Sharing Industry Industry
Long-term growth will be fueled by continued technological advancements, strategic partnerships between bike-sharing operators and other mobility providers, and expansion into new markets beyond major cities. Government policies promoting cycling infrastructure and sustainable transportation will also play a critical role in driving market expansion.
Key Players Shaping the NORDIC Bike Sharing Industry Market
- Smoove
- Oslo City Bike
- oBike
- Saimaa Bikes
- Urban Sharing
- Rekola
- Malmo By Bike
- Helsinki City bikes
- Bycyklen
Notable Milestones in NORDIC Bike Sharing Industry Sector
- 2020: Introduction of government subsidies for e-bike purchases in Denmark.
- 2021: Launch of a nationwide bike-sharing program in Sweden.
- 2022: Acquisition of a smaller bike-sharing company by a larger operator in Finland.
- 2023: Implementation of new regulations on bike-sharing operations in Norway.
- 2024: Significant increase in e-bike adoption across the Nordic region.
In-Depth NORDIC Bike Sharing Industry Market Outlook
The Nordic bike-sharing market is poised for continued growth over the forecast period, driven by a confluence of factors including technological innovation, supportive government policies, and evolving consumer preferences. Strategic opportunities exist for companies focusing on e-bike adoption, expanding into underserved markets, and developing integrated mobility solutions. The market is expected to witness further consolidation, with larger players acquiring smaller operators to gain market share and expand their geographical footprint. The long-term outlook remains positive, suggesting substantial growth potential for innovative and adaptable companies within this dynamic sector.
NORDIC Bike Sharing Industry Segmentation
-
1. Bike Type
- 1.1. Traditional/Regular Bike
- 1.2. E-bike
-
2. Sharing System Type
- 2.1. Docked
- 2.2. Dockless
NORDIC Bike Sharing Industry Segmentation By Geography
-
1. North America
- 1.1. United States
- 1.2. Canada
- 1.3. Mexico
-
2. South America
- 2.1. Brazil
- 2.2. Argentina
- 2.3. Rest of South America
-
3. Europe
- 3.1. United Kingdom
- 3.2. Germany
- 3.3. France
- 3.4. Italy
- 3.5. Spain
- 3.6. Russia
- 3.7. Benelux
- 3.8. Nordics
- 3.9. Rest of Europe
-
4. Middle East & Africa
- 4.1. Turkey
- 4.2. Israel
- 4.3. GCC
- 4.4. North Africa
- 4.5. South Africa
- 4.6. Rest of Middle East & Africa
-
5. Asia Pacific
- 5.1. China
- 5.2. India
- 5.3. Japan
- 5.4. South Korea
- 5.5. ASEAN
- 5.6. Oceania
- 5.7. Rest of Asia Pacific
NORDIC Bike Sharing Industry Regional Market Share
Geographic Coverage of NORDIC Bike Sharing Industry
NORDIC Bike Sharing Industry REPORT HIGHLIGHTS
| Aspects | Details |
|---|---|
| Study Period | 2020-2034 |
| Base Year | 2025 |
| Estimated Year | 2026 |
| Forecast Period | 2026-2034 |
| Historical Period | 2020-2025 |
| Growth Rate | CAGR of 7.8% from 2020-2034 |
| Segmentation |
|
Table of Contents
- 1. Introduction
- 1.1. Research Scope
- 1.2. Market Segmentation
- 1.3. Research Objective
- 1.4. Definitions and Assumptions
- 2. Executive Summary
- 2.1. Market Snapshot
- 3. Market Dynamics
- 3.1. Market Drivers
- 3.2. Market Restrains
- 3.3. Market Trends
- 3.4. Market Opportunities
- 4. Market Factor Analysis
- 4.1. Porters Five Forces
- 4.1.1. Bargaining Power of Suppliers
- 4.1.2. Bargaining Power of Buyers
- 4.1.3. Threat of New Entrants
- 4.1.4. Threat of Substitutes
- 4.1.5. Competitive Rivalry
- 4.2. PESTEL analysis
- 4.3. BCG Analysis
- 4.3.1. Stars (High Growth, High Market Share)
- 4.3.2. Cash Cows (Low Growth, High Market Share)
- 4.3.3. Question Mark (High Growth, Low Market Share)
- 4.3.4. Dogs (Low Growth, Low Market Share)
- 4.4. Ansoff Matrix Analysis
- 4.5. Supply Chain Analysis
- 4.6. Regulatory Landscape
- 4.7. Current Market Potential and Opportunity Assessment (TAM–SAM–SOM Framework)
- 4.8. IMR Analyst Note
- 4.1. Porters Five Forces
- 5. Market Analysis, Insights and Forecast 2021-2033
- 5.1. Market Analysis, Insights and Forecast - by Bike Type
- 5.1.1. Traditional/Regular Bike
- 5.1.2. E-bike
- 5.2. Market Analysis, Insights and Forecast - by Sharing System Type
- 5.2.1. Docked
- 5.2.2. Dockless
- 5.3. Market Analysis, Insights and Forecast - by Region
- 5.3.1. North America
- 5.3.2. South America
- 5.3.3. Europe
- 5.3.4. Middle East & Africa
- 5.3.5. Asia Pacific
- 5.1. Market Analysis, Insights and Forecast - by Bike Type
- 6. Global NORDIC Bike Sharing Industry Analysis, Insights and Forecast, 2021-2033
- 6.1. Market Analysis, Insights and Forecast - by Bike Type
- 6.1.1. Traditional/Regular Bike
- 6.1.2. E-bike
- 6.2. Market Analysis, Insights and Forecast - by Sharing System Type
- 6.2.1. Docked
- 6.2.2. Dockless
- 6.1. Market Analysis, Insights and Forecast - by Bike Type
- 7. North America NORDIC Bike Sharing Industry Analysis, Insights and Forecast, 2020-2032
- 7.1. Market Analysis, Insights and Forecast - by Bike Type
- 7.1.1. Traditional/Regular Bike
- 7.1.2. E-bike
- 7.2. Market Analysis, Insights and Forecast - by Sharing System Type
- 7.2.1. Docked
- 7.2.2. Dockless
- 7.1. Market Analysis, Insights and Forecast - by Bike Type
- 8. South America NORDIC Bike Sharing Industry Analysis, Insights and Forecast, 2020-2032
- 8.1. Market Analysis, Insights and Forecast - by Bike Type
- 8.1.1. Traditional/Regular Bike
- 8.1.2. E-bike
- 8.2. Market Analysis, Insights and Forecast - by Sharing System Type
- 8.2.1. Docked
- 8.2.2. Dockless
- 8.1. Market Analysis, Insights and Forecast - by Bike Type
- 9. Europe NORDIC Bike Sharing Industry Analysis, Insights and Forecast, 2020-2032
- 9.1. Market Analysis, Insights and Forecast - by Bike Type
- 9.1.1. Traditional/Regular Bike
- 9.1.2. E-bike
- 9.2. Market Analysis, Insights and Forecast - by Sharing System Type
- 9.2.1. Docked
- 9.2.2. Dockless
- 9.1. Market Analysis, Insights and Forecast - by Bike Type
- 10. Middle East & Africa NORDIC Bike Sharing Industry Analysis, Insights and Forecast, 2020-2032
- 10.1. Market Analysis, Insights and Forecast - by Bike Type
- 10.1.1. Traditional/Regular Bike
- 10.1.2. E-bike
- 10.2. Market Analysis, Insights and Forecast - by Sharing System Type
- 10.2.1. Docked
- 10.2.2. Dockless
- 10.1. Market Analysis, Insights and Forecast - by Bike Type
- 11. Asia Pacific NORDIC Bike Sharing Industry Analysis, Insights and Forecast, 2020-2032
- 11.1. Market Analysis, Insights and Forecast - by Bike Type
- 11.1.1. Traditional/Regular Bike
- 11.1.2. E-bike
- 11.2. Market Analysis, Insights and Forecast - by Sharing System Type
- 11.2.1. Docked
- 11.2.2. Dockless
- 11.1. Market Analysis, Insights and Forecast - by Bike Type
- 12. Competitive Analysis
- 12.1. Company Profiles
- 12.1.1 Smoove
- 12.1.1.1. Company Overview
- 12.1.1.2. Products
- 12.1.1.3. Company Financials
- 12.1.1.4. SWOT Analysis
- 12.1.2 Oslo City Bike
- 12.1.2.1. Company Overview
- 12.1.2.2. Products
- 12.1.2.3. Company Financials
- 12.1.2.4. SWOT Analysis
- 12.1.3 oBike
- 12.1.3.1. Company Overview
- 12.1.3.2. Products
- 12.1.3.3. Company Financials
- 12.1.3.4. SWOT Analysis
- 12.1.4 Saimaa Bikes
- 12.1.4.1. Company Overview
- 12.1.4.2. Products
- 12.1.4.3. Company Financials
- 12.1.4.4. SWOT Analysis
- 12.1.5 Urban Sharing
- 12.1.5.1. Company Overview
- 12.1.5.2. Products
- 12.1.5.3. Company Financials
- 12.1.5.4. SWOT Analysis
- 12.1.6 Rekola
- 12.1.6.1. Company Overview
- 12.1.6.2. Products
- 12.1.6.3. Company Financials
- 12.1.6.4. SWOT Analysis
- 12.1.7 Malmo By Bike
- 12.1.7.1. Company Overview
- 12.1.7.2. Products
- 12.1.7.3. Company Financials
- 12.1.7.4. SWOT Analysis
- 12.1.8 Helsinki City bikes
- 12.1.8.1. Company Overview
- 12.1.8.2. Products
- 12.1.8.3. Company Financials
- 12.1.8.4. SWOT Analysis
- 12.1.9 Bycyklen*List Not Exhaustive
- 12.1.9.1. Company Overview
- 12.1.9.2. Products
- 12.1.9.3. Company Financials
- 12.1.9.4. SWOT Analysis
- 12.1.1 Smoove
- 12.2. Market Entropy
- 12.2.1 Company's Key Areas Served
- 12.2.2 Recent Developments
- 12.3. Company Market Share Analysis 2025
- 12.3.1 Top 5 Companies Market Share Analysis
- 12.3.2 Top 3 Companies Market Share Analysis
- 12.4. List of Potential Customers
- 13. Research Methodology
List of Figures
- Figure 1: Global NORDIC Bike Sharing Industry Revenue Breakdown (million, %) by Region 2025 & 2033
- Figure 2: North America NORDIC Bike Sharing Industry Revenue (million), by Bike Type 2025 & 2033
- Figure 3: North America NORDIC Bike Sharing Industry Revenue Share (%), by Bike Type 2025 & 2033
- Figure 4: North America NORDIC Bike Sharing Industry Revenue (million), by Sharing System Type 2025 & 2033
- Figure 5: North America NORDIC Bike Sharing Industry Revenue Share (%), by Sharing System Type 2025 & 2033
- Figure 6: North America NORDIC Bike Sharing Industry Revenue (million), by Country 2025 & 2033
- Figure 7: North America NORDIC Bike Sharing Industry Revenue Share (%), by Country 2025 & 2033
- Figure 8: South America NORDIC Bike Sharing Industry Revenue (million), by Bike Type 2025 & 2033
- Figure 9: South America NORDIC Bike Sharing Industry Revenue Share (%), by Bike Type 2025 & 2033
- Figure 10: South America NORDIC Bike Sharing Industry Revenue (million), by Sharing System Type 2025 & 2033
- Figure 11: South America NORDIC Bike Sharing Industry Revenue Share (%), by Sharing System Type 2025 & 2033
- Figure 12: South America NORDIC Bike Sharing Industry Revenue (million), by Country 2025 & 2033
- Figure 13: South America NORDIC Bike Sharing Industry Revenue Share (%), by Country 2025 & 2033
- Figure 14: Europe NORDIC Bike Sharing Industry Revenue (million), by Bike Type 2025 & 2033
- Figure 15: Europe NORDIC Bike Sharing Industry Revenue Share (%), by Bike Type 2025 & 2033
- Figure 16: Europe NORDIC Bike Sharing Industry Revenue (million), by Sharing System Type 2025 & 2033
- Figure 17: Europe NORDIC Bike Sharing Industry Revenue Share (%), by Sharing System Type 2025 & 2033
- Figure 18: Europe NORDIC Bike Sharing Industry Revenue (million), by Country 2025 & 2033
- Figure 19: Europe NORDIC Bike Sharing Industry Revenue Share (%), by Country 2025 & 2033
- Figure 20: Middle East & Africa NORDIC Bike Sharing Industry Revenue (million), by Bike Type 2025 & 2033
- Figure 21: Middle East & Africa NORDIC Bike Sharing Industry Revenue Share (%), by Bike Type 2025 & 2033
- Figure 22: Middle East & Africa NORDIC Bike Sharing Industry Revenue (million), by Sharing System Type 2025 & 2033
- Figure 23: Middle East & Africa NORDIC Bike Sharing Industry Revenue Share (%), by Sharing System Type 2025 & 2033
- Figure 24: Middle East & Africa NORDIC Bike Sharing Industry Revenue (million), by Country 2025 & 2033
- Figure 25: Middle East & Africa NORDIC Bike Sharing Industry Revenue Share (%), by Country 2025 & 2033
- Figure 26: Asia Pacific NORDIC Bike Sharing Industry Revenue (million), by Bike Type 2025 & 2033
- Figure 27: Asia Pacific NORDIC Bike Sharing Industry Revenue Share (%), by Bike Type 2025 & 2033
- Figure 28: Asia Pacific NORDIC Bike Sharing Industry Revenue (million), by Sharing System Type 2025 & 2033
- Figure 29: Asia Pacific NORDIC Bike Sharing Industry Revenue Share (%), by Sharing System Type 2025 & 2033
- Figure 30: Asia Pacific NORDIC Bike Sharing Industry Revenue (million), by Country 2025 & 2033
- Figure 31: Asia Pacific NORDIC Bike Sharing Industry Revenue Share (%), by Country 2025 & 2033
List of Tables
- Table 1: Global NORDIC Bike Sharing Industry Revenue million Forecast, by Bike Type 2020 & 2033
- Table 2: Global NORDIC Bike Sharing Industry Revenue million Forecast, by Sharing System Type 2020 & 2033
- Table 3: Global NORDIC Bike Sharing Industry Revenue million Forecast, by Region 2020 & 2033
- Table 4: Global NORDIC Bike Sharing Industry Revenue million Forecast, by Bike Type 2020 & 2033
- Table 5: Global NORDIC Bike Sharing Industry Revenue million Forecast, by Sharing System Type 2020 & 2033
- Table 6: Global NORDIC Bike Sharing Industry Revenue million Forecast, by Country 2020 & 2033
- Table 7: United States NORDIC Bike Sharing Industry Revenue (million) Forecast, by Application 2020 & 2033
- Table 8: Canada NORDIC Bike Sharing Industry Revenue (million) Forecast, by Application 2020 & 2033
- Table 9: Mexico NORDIC Bike Sharing Industry Revenue (million) Forecast, by Application 2020 & 2033
- Table 10: Global NORDIC Bike Sharing Industry Revenue million Forecast, by Bike Type 2020 & 2033
- Table 11: Global NORDIC Bike Sharing Industry Revenue million Forecast, by Sharing System Type 2020 & 2033
- Table 12: Global NORDIC Bike Sharing Industry Revenue million Forecast, by Country 2020 & 2033
- Table 13: Brazil NORDIC Bike Sharing Industry Revenue (million) Forecast, by Application 2020 & 2033
- Table 14: Argentina NORDIC Bike Sharing Industry Revenue (million) Forecast, by Application 2020 & 2033
- Table 15: Rest of South America NORDIC Bike Sharing Industry Revenue (million) Forecast, by Application 2020 & 2033
- Table 16: Global NORDIC Bike Sharing Industry Revenue million Forecast, by Bike Type 2020 & 2033
- Table 17: Global NORDIC Bike Sharing Industry Revenue million Forecast, by Sharing System Type 2020 & 2033
- Table 18: Global NORDIC Bike Sharing Industry Revenue million Forecast, by Country 2020 & 2033
- Table 19: United Kingdom NORDIC Bike Sharing Industry Revenue (million) Forecast, by Application 2020 & 2033
- Table 20: Germany NORDIC Bike Sharing Industry Revenue (million) Forecast, by Application 2020 & 2033
- Table 21: France NORDIC Bike Sharing Industry Revenue (million) Forecast, by Application 2020 & 2033
- Table 22: Italy NORDIC Bike Sharing Industry Revenue (million) Forecast, by Application 2020 & 2033
- Table 23: Spain NORDIC Bike Sharing Industry Revenue (million) Forecast, by Application 2020 & 2033
- Table 24: Russia NORDIC Bike Sharing Industry Revenue (million) Forecast, by Application 2020 & 2033
- Table 25: Benelux NORDIC Bike Sharing Industry Revenue (million) Forecast, by Application 2020 & 2033
- Table 26: Nordics NORDIC Bike Sharing Industry Revenue (million) Forecast, by Application 2020 & 2033
- Table 27: Rest of Europe NORDIC Bike Sharing Industry Revenue (million) Forecast, by Application 2020 & 2033
- Table 28: Global NORDIC Bike Sharing Industry Revenue million Forecast, by Bike Type 2020 & 2033
- Table 29: Global NORDIC Bike Sharing Industry Revenue million Forecast, by Sharing System Type 2020 & 2033
- Table 30: Global NORDIC Bike Sharing Industry Revenue million Forecast, by Country 2020 & 2033
- Table 31: Turkey NORDIC Bike Sharing Industry Revenue (million) Forecast, by Application 2020 & 2033
- Table 32: Israel NORDIC Bike Sharing Industry Revenue (million) Forecast, by Application 2020 & 2033
- Table 33: GCC NORDIC Bike Sharing Industry Revenue (million) Forecast, by Application 2020 & 2033
- Table 34: North Africa NORDIC Bike Sharing Industry Revenue (million) Forecast, by Application 2020 & 2033
- Table 35: South Africa NORDIC Bike Sharing Industry Revenue (million) Forecast, by Application 2020 & 2033
- Table 36: Rest of Middle East & Africa NORDIC Bike Sharing Industry Revenue (million) Forecast, by Application 2020 & 2033
- Table 37: Global NORDIC Bike Sharing Industry Revenue million Forecast, by Bike Type 2020 & 2033
- Table 38: Global NORDIC Bike Sharing Industry Revenue million Forecast, by Sharing System Type 2020 & 2033
- Table 39: Global NORDIC Bike Sharing Industry Revenue million Forecast, by Country 2020 & 2033
- Table 40: China NORDIC Bike Sharing Industry Revenue (million) Forecast, by Application 2020 & 2033
- Table 41: India NORDIC Bike Sharing Industry Revenue (million) Forecast, by Application 2020 & 2033
- Table 42: Japan NORDIC Bike Sharing Industry Revenue (million) Forecast, by Application 2020 & 2033
- Table 43: South Korea NORDIC Bike Sharing Industry Revenue (million) Forecast, by Application 2020 & 2033
- Table 44: ASEAN NORDIC Bike Sharing Industry Revenue (million) Forecast, by Application 2020 & 2033
- Table 45: Oceania NORDIC Bike Sharing Industry Revenue (million) Forecast, by Application 2020 & 2033
- Table 46: Rest of Asia Pacific NORDIC Bike Sharing Industry Revenue (million) Forecast, by Application 2020 & 2033
Frequently Asked Questions
1. What is the projected Compound Annual Growth Rate (CAGR) of the NORDIC Bike Sharing Industry?
The projected CAGR is approximately 7.8%.
2. Which companies are prominent players in the NORDIC Bike Sharing Industry?
Key companies in the market include Smoove, Oslo City Bike, oBike, Saimaa Bikes, Urban Sharing, Rekola, Malmo By Bike, Helsinki City bikes, Bycyklen*List Not Exhaustive.
3. What are the main segments of the NORDIC Bike Sharing Industry?
The market segments include Bike Type, Sharing System Type.
4. Can you provide details about the market size?
The market size is estimated to be USD 280 million as of 2022.
5. What are some drivers contributing to market growth?
Government Policies to promote electric Vehicles Sales.
6. What are the notable trends driving market growth?
E-Bike Rentalis Providing the Growth in Market.
7. Are there any restraints impacting market growth?
High Cost of Capital Expenditure for Electric Vehicle Infrastructure.
8. Can you provide examples of recent developments in the market?
N/A
9. What pricing options are available for accessing the report?
Pricing options include single-user, multi-user, and enterprise licenses priced at USD 3800, USD 4500, and USD 5800 respectively.
10. Is the market size provided in terms of value or volume?
The market size is provided in terms of value, measured in million.
11. Are there any specific market keywords associated with the report?
Yes, the market keyword associated with the report is "NORDIC Bike Sharing Industry," which aids in identifying and referencing the specific market segment covered.
12. How do I determine which pricing option suits my needs best?
The pricing options vary based on user requirements and access needs. Individual users may opt for single-user licenses, while businesses requiring broader access may choose multi-user or enterprise licenses for cost-effective access to the report.
13. Are there any additional resources or data provided in the NORDIC Bike Sharing Industry report?
While the report offers comprehensive insights, it's advisable to review the specific contents or supplementary materials provided to ascertain if additional resources or data are available.
14. How can I stay updated on further developments or reports in the NORDIC Bike Sharing Industry?
To stay informed about further developments, trends, and reports in the NORDIC Bike Sharing Industry, consider subscribing to industry newsletters, following relevant companies and organizations, or regularly checking reputable industry news sources and publications.
Methodology
Step 1 - Identification of Relevant Samples Size from Population Database


Step 2 - Approaches for Defining Global Market Size (Value, Volume* & Price*)

Note*: In applicable scenarios
Step 3 - Data Sources
Primary Research
- Web Analytics
- Survey Reports
- Research Institute
- Latest Research Reports
- Opinion Leaders
Secondary Research
- Annual Reports
- White Paper
- Latest Press Release
- Industry Association
- Paid Database
- Investor Presentations

Step 4 - Data Triangulation
Involves using different sources of information in order to increase the validity of a study
These sources are likely to be stakeholders in a program - participants, other researchers, program staff, other community members, and so on.
Then we put all data in single framework & apply various statistical tools to find out the dynamic on the market.
During the analysis stage, feedback from the stakeholder groups would be compared to determine areas of agreement as well as areas of divergence