

Key Insights
The Clinical Trial Imaging Services market, valued at $1.25 billion in 2025, is poised for robust growth, exhibiting a Compound Annual Growth Rate (CAGR) of 5.38% from 2025 to 2033. This expansion is driven by several key factors. The increasing prevalence of chronic diseases necessitates more sophisticated clinical trials, heavily reliant on advanced imaging techniques to assess treatment efficacy and safety. Technological advancements in imaging modalities, such as higher-resolution MRI and improved PET scans, are enhancing diagnostic capabilities and driving market demand. Furthermore, the rising adoption of decentralized clinical trials (DCTs) is creating opportunities for remote imaging services, improving accessibility and patient convenience. Growth is further fueled by the expanding pharmaceutical and biotechnology industries, continuously investing in research and development to bring novel therapies to market. While data privacy and regulatory compliance remain challenges, the overall market outlook remains positive.
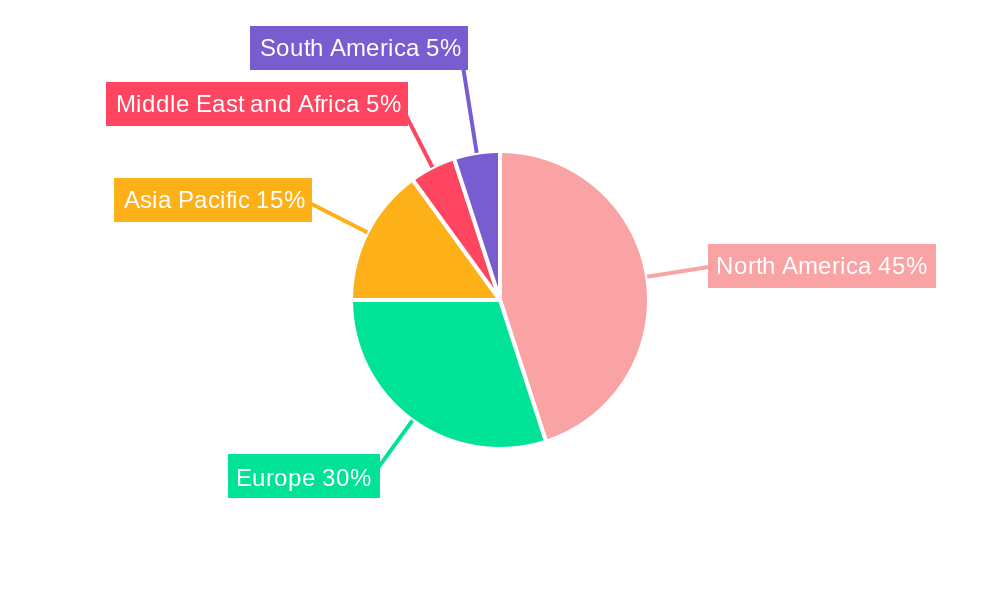
Segmentation analysis reveals a diverse market landscape. Magnetic Resonance Imaging (MRI) and Computed Tomography (CT) currently dominate the modality segment, reflecting their established role in various therapeutic areas. However, the adoption of other advanced imaging techniques, like Positron Emission Tomography (PET) and Ultrasound, is expected to witness significant growth due to their specialized applications and improved diagnostic accuracy. The End-User segment is largely driven by Pharmaceutical & Biotechnology Companies and Medical Device Manufacturers, actively utilizing imaging services to support their drug development and device testing programs. Geographically, North America currently holds the largest market share due to its well-established healthcare infrastructure and high clinical trial activity. However, Asia Pacific is projected to experience rapid growth, fueled by increasing healthcare spending and rising research and development investments. The market’s continued expansion will be shaped by the ongoing development of innovative imaging technologies, expanding regulatory frameworks, and the evolving needs of the clinical research industry.

Clinical Trial Imaging Services Market: A Comprehensive Report (2019-2033)
This comprehensive report provides an in-depth analysis of the Clinical Trial Imaging Services market, encompassing market dynamics, growth trends, regional analysis, product landscape, key players, and future outlook. The study period covers 2019-2033, with 2025 as the base year and forecast period from 2025-2033. The market is segmented by product and service (Trial Design Consulting Services, Read Analysis Services, Operational Imaging Services, Imaging Software), modality (Magnetic Resonance Imaging (MRI), Computed Tomography (CT), Ultrasound, Positron Emission Tomography (PET), X-Ray, Echocardiography, Other Modalities), and end-user (Pharmaceutical & Biotechnology Companies, Medical Device Manufacturers, Academic and Government Research Institutes). The report projects a market size of xx Million by 2033.
Clinical Trial Imaging Services Market Dynamics & Structure
The Clinical Trial Imaging Services market is characterized by moderate concentration, with key players holding significant market share. Technological advancements, particularly in AI-driven image analysis and advanced imaging modalities, are major drivers. Stringent regulatory frameworks impact market entry and operations, while competitive pressures from substitute technologies and pricing strategies influence market dynamics. The pharmaceutical and biotechnology sector dominates the end-user segment, fueling market growth. M&A activity remains relatively active, with xx deals recorded in the historical period (2019-2024), primarily focused on expanding service offerings and geographical reach.
- Market Concentration: Moderately concentrated, with top 5 players holding approximately xx% market share (2024).
- Technological Innovation: AI-driven image analysis, improved resolution in MRI and CT, development of novel contrast agents are key innovation drivers.
- Regulatory Landscape: Stringent regulatory approvals for new imaging technologies and clinical trial protocols influence market growth.
- Competitive Landscape: Intense competition among established players and emerging companies, with pricing strategies a key factor.
- M&A Activity: xx deals recorded (2019-2024), indicating consolidation and expansion within the market.
- Innovation Barriers: High regulatory hurdles, substantial investment requirements for R&D, and skilled workforce shortages pose challenges.
Clinical Trial Imaging Services Market Growth Trends & Insights
The Clinical Trial Imaging Services market experienced significant growth during the historical period (2019-2024), with a CAGR of xx%. This growth is attributed to the rising prevalence of chronic diseases, increasing demand for faster and more efficient clinical trials, and advancements in imaging technologies. The adoption rate of advanced imaging modalities, such as PET and MRI, has increased steadily, particularly in developed economies. The market is witnessing increasing adoption of AI-powered image analysis, enhancing diagnostic accuracy and reducing processing time. Consumer behavior is shifting towards personalized medicine and targeted therapies, leading to a higher demand for precise imaging data in clinical trials. The market is anticipated to maintain a robust CAGR of xx% during the forecast period (2025-2033), driven by factors mentioned above and the continued investment in the pharmaceutical and biotechnology sector.

Dominant Regions, Countries, or Segments in Clinical Trial Imaging Services Market
North America holds the largest market share, driven by high healthcare expenditure, advanced infrastructure, and a large number of pharmaceutical and biotechnology companies. Within North America, the United States accounts for the majority of market revenue. Europe follows as the second-largest market, driven by strong regulatory frameworks and increasing research activities. Within modalities, MRI holds a significant market share due to its high resolution and versatility. The pharmaceutical & biotechnology companies segment represents the largest end-user sector, reflecting the increasing demand for imaging services during clinical drug development. The Asia Pacific region is expected to exhibit high growth potential during the forecast period, driven by expanding healthcare infrastructure and increasing investments in clinical research.
- Key Drivers: High healthcare spending (North America), robust regulatory frameworks (Europe), and increasing investments in clinical research (Asia Pacific).
- Dominance Factors: Strong presence of pharmaceutical companies (North America), advanced healthcare infrastructure (North America & Europe), and high adoption rate of advanced imaging technologies.
- Growth Potential: Significant growth in emerging markets, particularly in Asia Pacific due to increasing clinical trial activity and rising healthcare expenditure.
Clinical Trial Imaging Services Market Product Landscape
The market offers a range of products and services, including trial design consulting, image read analysis, operational imaging services, and imaging software. Recent innovations focus on AI-powered image analysis, improving diagnostic accuracy and efficiency. Companies are developing user-friendly software for faster image processing and interpretation. New applications are emerging in areas like personalized medicine and theranostics, further pushing market growth. The key performance indicators include diagnostic accuracy, processing speed, and ease of use of software.
Key Drivers, Barriers & Challenges in Clinical Trial Imaging Services Market
Key Drivers:
- Rising prevalence of chronic diseases, increasing demand for clinical trials, technological advancements in imaging modalities, and growing adoption of AI in image analysis. The increasing focus on personalized medicine is also driving market growth.
Challenges & Restraints:
- High cost of advanced imaging technologies and services, stringent regulatory requirements, and shortage of skilled professionals can hinder market expansion. Potential supply chain disruptions can impact availability and cost of imaging equipment.
Emerging Opportunities in Clinical Trial Imaging Services Market
Untapped markets in developing economies, particularly in Asia and Africa, represent significant growth opportunities. The increasing adoption of telehealth and remote monitoring presents opportunities for remote image analysis and consultation services. Furthermore, development of novel imaging techniques and application of AI in image processing will present further opportunities in this sector.
Growth Accelerators in the Clinical Trial Imaging Services Market Industry
Strategic partnerships between imaging providers and pharmaceutical companies can accelerate market growth. Technological breakthroughs in AI and advanced imaging modalities will further stimulate demand. Expansion into new geographical markets and provision of cost-effective solutions will also contribute to market expansion.
Key Players Shaping the Clinical Trial Imaging Services Market Market
- Navitas Clinical Research Inc
- Koninklijke Philips N V
- Worldcare Clinical LLC
- ProScan Imaging
- Parexel International Corporation
- Radiant Sage LLC
- WIRB-Copernicus Group
- Ixico PLC
- Clario
- Resonance Health
- Medpace
- Icon PLC
Notable Milestones in Clinical Trial Imaging Services Market Sector
- May 2022: Bruker launched innovative 7 Tesla and 9.4 Tesla conduction-cooled Maxwell magnets for preclinical MRI systems, enhancing research capabilities.
- March 2022: Fujifilm India unveiled a new range of CT, MRI, and ultrasound machines, expanding its product portfolio and market reach.
In-Depth Clinical Trial Imaging Services Market Market Outlook
The Clinical Trial Imaging Services market is poised for continued growth, driven by technological advancements, increasing clinical trial activity, and expansion into new markets. Strategic partnerships, adoption of AI, and the development of new imaging modalities will significantly enhance market potential. Opportunities exist in providing cost-effective solutions to expand reach and accessibility in underserved regions. The market is projected to reach xx Million by 2033, presenting lucrative opportunities for market players.
Clinical Trial Imaging Services Market Segmentation
-
1. Product and Service
- 1.1. Trial Design Consulting Services
- 1.2. Read Analysis Services
- 1.3. Operational Imaging Services
- 1.4. Imaging Software
-
2. Modality
- 2.1. Magnetic Resonance Imaging
- 2.2. Computed Tomography
- 2.3. Ultrasound
- 2.4. Positron Emission Tomography
- 2.5. X-Ray
- 2.6. Echocardiography
- 2.7. Other Modalities
-
3. End-User
- 3.1. Pharmaceutical & Biotechnology Companies
- 3.2. Medical Device Manufacturers
- 3.3. Academic and Government Research Institutes
Clinical Trial Imaging Services Market Segmentation By Geography
-
1. North America
- 1.1. United States
- 1.2. Canada
- 1.3. Mexico
-
2. Europe
- 2.1. Germany
- 2.2. United Kingdom
- 2.3. France
- 2.4. Italy
- 2.5. Spain
- 2.6. Rest of Europe
-
3. Asia Pacific
- 3.1. China
- 3.2. Japan
- 3.3. India
- 3.4. Australia
- 3.5. South Korea
- 3.6. Rest of Asia Pacific
-
4. Middle East and Africa
- 4.1. GCC
- 4.2. South Africa
- 4.3. Rest of Middle East and Africa
-
5. South America
- 5.1. Brazil
- 5.2. Argentina
- 5.3. Rest of South America
Clinical Trial Imaging Services Market REPORT HIGHLIGHTS
| Aspects | Details |
|---|---|
| Study Period | 2019-2033 |
| Base Year | 2024 |
| Estimated Year | 2025 |
| Forecast Period | 2025-2033 |
| Historical Period | 2019-2024 |
| Growth Rate | CAGR of 5.38% from 2019-2033 |
| Segmentation |
|
Table of Contents
- 1. Introduction
- 1.1. Research Scope
- 1.2. Market Segmentation
- 1.3. Research Methodology
- 1.4. Definitions and Assumptions
- 2. Executive Summary
- 2.1. Introduction
- 3. Market Dynamics
- 3.1. Introduction
- 3.2. Market Drivers
- 3.2.1. Increase in R&D Spending by the Pharmaceutical and Biotechnological Companies; Increasing Number of Contract Research Organization & Investment by Them
- 3.3. Market Restrains
- 3.3.1. High Implementation Barriers and Costs of Imaging Systems
- 3.4. Market Trends
- 3.4.1. Computed Tomography is Expected to Witness Rapid Growth Over the Forecast Period
- 4. Market Factor Analysis
- 4.1. Porters Five Forces
- 4.2. Supply/Value Chain
- 4.3. PESTEL analysis
- 4.4. Market Entropy
- 4.5. Patent/Trademark Analysis
- 5. Global Clinical Trial Imaging Services Market Analysis, Insights and Forecast, 2019-2031
- 5.1. Market Analysis, Insights and Forecast - by Product and Service
- 5.1.1. Trial Design Consulting Services
- 5.1.2. Read Analysis Services
- 5.1.3. Operational Imaging Services
- 5.1.4. Imaging Software
- 5.2. Market Analysis, Insights and Forecast - by Modality
- 5.2.1. Magnetic Resonance Imaging
- 5.2.2. Computed Tomography
- 5.2.3. Ultrasound
- 5.2.4. Positron Emission Tomography
- 5.2.5. X-Ray
- 5.2.6. Echocardiography
- 5.2.7. Other Modalities
- 5.3. Market Analysis, Insights and Forecast - by End-User
- 5.3.1. Pharmaceutical & Biotechnology Companies
- 5.3.2. Medical Device Manufacturers
- 5.3.3. Academic and Government Research Institutes
- 5.4. Market Analysis, Insights and Forecast - by Region
- 5.4.1. North America
- 5.4.2. Europe
- 5.4.3. Asia Pacific
- 5.4.4. Middle East and Africa
- 5.4.5. South America
- 5.1. Market Analysis, Insights and Forecast - by Product and Service
- 6. North America Clinical Trial Imaging Services Market Analysis, Insights and Forecast, 2019-2031
- 6.1. Market Analysis, Insights and Forecast - by Product and Service
- 6.1.1. Trial Design Consulting Services
- 6.1.2. Read Analysis Services
- 6.1.3. Operational Imaging Services
- 6.1.4. Imaging Software
- 6.2. Market Analysis, Insights and Forecast - by Modality
- 6.2.1. Magnetic Resonance Imaging
- 6.2.2. Computed Tomography
- 6.2.3. Ultrasound
- 6.2.4. Positron Emission Tomography
- 6.2.5. X-Ray
- 6.2.6. Echocardiography
- 6.2.7. Other Modalities
- 6.3. Market Analysis, Insights and Forecast - by End-User
- 6.3.1. Pharmaceutical & Biotechnology Companies
- 6.3.2. Medical Device Manufacturers
- 6.3.3. Academic and Government Research Institutes
- 6.1. Market Analysis, Insights and Forecast - by Product and Service
- 7. Europe Clinical Trial Imaging Services Market Analysis, Insights and Forecast, 2019-2031
- 7.1. Market Analysis, Insights and Forecast - by Product and Service
- 7.1.1. Trial Design Consulting Services
- 7.1.2. Read Analysis Services
- 7.1.3. Operational Imaging Services
- 7.1.4. Imaging Software
- 7.2. Market Analysis, Insights and Forecast - by Modality
- 7.2.1. Magnetic Resonance Imaging
- 7.2.2. Computed Tomography
- 7.2.3. Ultrasound
- 7.2.4. Positron Emission Tomography
- 7.2.5. X-Ray
- 7.2.6. Echocardiography
- 7.2.7. Other Modalities
- 7.3. Market Analysis, Insights and Forecast - by End-User
- 7.3.1. Pharmaceutical & Biotechnology Companies
- 7.3.2. Medical Device Manufacturers
- 7.3.3. Academic and Government Research Institutes
- 7.1. Market Analysis, Insights and Forecast - by Product and Service
- 8. Asia Pacific Clinical Trial Imaging Services Market Analysis, Insights and Forecast, 2019-2031
- 8.1. Market Analysis, Insights and Forecast - by Product and Service
- 8.1.1. Trial Design Consulting Services
- 8.1.2. Read Analysis Services
- 8.1.3. Operational Imaging Services
- 8.1.4. Imaging Software
- 8.2. Market Analysis, Insights and Forecast - by Modality
- 8.2.1. Magnetic Resonance Imaging
- 8.2.2. Computed Tomography
- 8.2.3. Ultrasound
- 8.2.4. Positron Emission Tomography
- 8.2.5. X-Ray
- 8.2.6. Echocardiography
- 8.2.7. Other Modalities
- 8.3. Market Analysis, Insights and Forecast - by End-User
- 8.3.1. Pharmaceutical & Biotechnology Companies
- 8.3.2. Medical Device Manufacturers
- 8.3.3. Academic and Government Research Institutes
- 8.1. Market Analysis, Insights and Forecast - by Product and Service
- 9. Middle East and Africa Clinical Trial Imaging Services Market Analysis, Insights and Forecast, 2019-2031
- 9.1. Market Analysis, Insights and Forecast - by Product and Service
- 9.1.1. Trial Design Consulting Services
- 9.1.2. Read Analysis Services
- 9.1.3. Operational Imaging Services
- 9.1.4. Imaging Software
- 9.2. Market Analysis, Insights and Forecast - by Modality
- 9.2.1. Magnetic Resonance Imaging
- 9.2.2. Computed Tomography
- 9.2.3. Ultrasound
- 9.2.4. Positron Emission Tomography
- 9.2.5. X-Ray
- 9.2.6. Echocardiography
- 9.2.7. Other Modalities
- 9.3. Market Analysis, Insights and Forecast - by End-User
- 9.3.1. Pharmaceutical & Biotechnology Companies
- 9.3.2. Medical Device Manufacturers
- 9.3.3. Academic and Government Research Institutes
- 9.1. Market Analysis, Insights and Forecast - by Product and Service
- 10. South America Clinical Trial Imaging Services Market Analysis, Insights and Forecast, 2019-2031
- 10.1. Market Analysis, Insights and Forecast - by Product and Service
- 10.1.1. Trial Design Consulting Services
- 10.1.2. Read Analysis Services
- 10.1.3. Operational Imaging Services
- 10.1.4. Imaging Software
- 10.2. Market Analysis, Insights and Forecast - by Modality
- 10.2.1. Magnetic Resonance Imaging
- 10.2.2. Computed Tomography
- 10.2.3. Ultrasound
- 10.2.4. Positron Emission Tomography
- 10.2.5. X-Ray
- 10.2.6. Echocardiography
- 10.2.7. Other Modalities
- 10.3. Market Analysis, Insights and Forecast - by End-User
- 10.3.1. Pharmaceutical & Biotechnology Companies
- 10.3.2. Medical Device Manufacturers
- 10.3.3. Academic and Government Research Institutes
- 10.1. Market Analysis, Insights and Forecast - by Product and Service
- 11. North America Clinical Trial Imaging Services Market Analysis, Insights and Forecast, 2019-2031
- 11.1. Market Analysis, Insights and Forecast - By Country/Sub-region
- 11.1.1 United States
- 11.1.2 Canada
- 11.1.3 Mexico
- 12. Europe Clinical Trial Imaging Services Market Analysis, Insights and Forecast, 2019-2031
- 12.1. Market Analysis, Insights and Forecast - By Country/Sub-region
- 12.1.1 Germany
- 12.1.2 United Kingdom
- 12.1.3 France
- 12.1.4 Italy
- 12.1.5 Spain
- 12.1.6 Rest of Europe
- 13. Asia Pacific Clinical Trial Imaging Services Market Analysis, Insights and Forecast, 2019-2031
- 13.1. Market Analysis, Insights and Forecast - By Country/Sub-region
- 13.1.1 China
- 13.1.2 Japan
- 13.1.3 India
- 13.1.4 Australia
- 13.1.5 South Korea
- 13.1.6 Rest of Asia Pacific
- 14. Middle East and Africa Clinical Trial Imaging Services Market Analysis, Insights and Forecast, 2019-2031
- 14.1. Market Analysis, Insights and Forecast - By Country/Sub-region
- 14.1.1 GCC
- 14.1.2 South Africa
- 14.1.3 Rest of Middle East and Africa
- 15. South America Clinical Trial Imaging Services Market Analysis, Insights and Forecast, 2019-2031
- 15.1. Market Analysis, Insights and Forecast - By Country/Sub-region
- 15.1.1 Brazil
- 15.1.2 Argentina
- 15.1.3 Rest of South America
- 16. Competitive Analysis
- 16.1. Global Market Share Analysis 2024
- 16.2. Company Profiles
- 16.2.1 Navitas Clinical Research Inc
- 16.2.1.1. Overview
- 16.2.1.2. Products
- 16.2.1.3. SWOT Analysis
- 16.2.1.4. Recent Developments
- 16.2.1.5. Financials (Based on Availability)
- 16.2.2 Koninklijke Philips N V
- 16.2.2.1. Overview
- 16.2.2.2. Products
- 16.2.2.3. SWOT Analysis
- 16.2.2.4. Recent Developments
- 16.2.2.5. Financials (Based on Availability)
- 16.2.3 Worldcare Clinical LLC
- 16.2.3.1. Overview
- 16.2.3.2. Products
- 16.2.3.3. SWOT Analysis
- 16.2.3.4. Recent Developments
- 16.2.3.5. Financials (Based on Availability)
- 16.2.4 ProScan Imaging
- 16.2.4.1. Overview
- 16.2.4.2. Products
- 16.2.4.3. SWOT Analysis
- 16.2.4.4. Recent Developments
- 16.2.4.5. Financials (Based on Availability)
- 16.2.5 Parexel International Corporation
- 16.2.5.1. Overview
- 16.2.5.2. Products
- 16.2.5.3. SWOT Analysis
- 16.2.5.4. Recent Developments
- 16.2.5.5. Financials (Based on Availability)
- 16.2.6 Radiant Sage LLC
- 16.2.6.1. Overview
- 16.2.6.2. Products
- 16.2.6.3. SWOT Analysis
- 16.2.6.4. Recent Developments
- 16.2.6.5. Financials (Based on Availability)
- 16.2.7 WIRB-Copernicus Group
- 16.2.7.1. Overview
- 16.2.7.2. Products
- 16.2.7.3. SWOT Analysis
- 16.2.7.4. Recent Developments
- 16.2.7.5. Financials (Based on Availability)
- 16.2.8 Ixico PLC
- 16.2.8.1. Overview
- 16.2.8.2. Products
- 16.2.8.3. SWOT Analysis
- 16.2.8.4. Recent Developments
- 16.2.8.5. Financials (Based on Availability)
- 16.2.9 Clario
- 16.2.9.1. Overview
- 16.2.9.2. Products
- 16.2.9.3. SWOT Analysis
- 16.2.9.4. Recent Developments
- 16.2.9.5. Financials (Based on Availability)
- 16.2.10 Resonance Health
- 16.2.10.1. Overview
- 16.2.10.2. Products
- 16.2.10.3. SWOT Analysis
- 16.2.10.4. Recent Developments
- 16.2.10.5. Financials (Based on Availability)
- 16.2.11 Medpace
- 16.2.11.1. Overview
- 16.2.11.2. Products
- 16.2.11.3. SWOT Analysis
- 16.2.11.4. Recent Developments
- 16.2.11.5. Financials (Based on Availability)
- 16.2.12 Icon PLC
- 16.2.12.1. Overview
- 16.2.12.2. Products
- 16.2.12.3. SWOT Analysis
- 16.2.12.4. Recent Developments
- 16.2.12.5. Financials (Based on Availability)
- 16.2.1 Navitas Clinical Research Inc
List of Figures
- Figure 1: Global Clinical Trial Imaging Services Market Revenue Breakdown (Million, %) by Region 2024 & 2032
- Figure 2: North America Clinical Trial Imaging Services Market Revenue (Million), by Country 2024 & 2032
- Figure 3: North America Clinical Trial Imaging Services Market Revenue Share (%), by Country 2024 & 2032
- Figure 4: Europe Clinical Trial Imaging Services Market Revenue (Million), by Country 2024 & 2032
- Figure 5: Europe Clinical Trial Imaging Services Market Revenue Share (%), by Country 2024 & 2032
- Figure 6: Asia Pacific Clinical Trial Imaging Services Market Revenue (Million), by Country 2024 & 2032
- Figure 7: Asia Pacific Clinical Trial Imaging Services Market Revenue Share (%), by Country 2024 & 2032
- Figure 8: Middle East and Africa Clinical Trial Imaging Services Market Revenue (Million), by Country 2024 & 2032
- Figure 9: Middle East and Africa Clinical Trial Imaging Services Market Revenue Share (%), by Country 2024 & 2032
- Figure 10: South America Clinical Trial Imaging Services Market Revenue (Million), by Country 2024 & 2032
- Figure 11: South America Clinical Trial Imaging Services Market Revenue Share (%), by Country 2024 & 2032
- Figure 12: North America Clinical Trial Imaging Services Market Revenue (Million), by Product and Service 2024 & 2032
- Figure 13: North America Clinical Trial Imaging Services Market Revenue Share (%), by Product and Service 2024 & 2032
- Figure 14: North America Clinical Trial Imaging Services Market Revenue (Million), by Modality 2024 & 2032
- Figure 15: North America Clinical Trial Imaging Services Market Revenue Share (%), by Modality 2024 & 2032
- Figure 16: North America Clinical Trial Imaging Services Market Revenue (Million), by End-User 2024 & 2032
- Figure 17: North America Clinical Trial Imaging Services Market Revenue Share (%), by End-User 2024 & 2032
- Figure 18: North America Clinical Trial Imaging Services Market Revenue (Million), by Country 2024 & 2032
- Figure 19: North America Clinical Trial Imaging Services Market Revenue Share (%), by Country 2024 & 2032
- Figure 20: Europe Clinical Trial Imaging Services Market Revenue (Million), by Product and Service 2024 & 2032
- Figure 21: Europe Clinical Trial Imaging Services Market Revenue Share (%), by Product and Service 2024 & 2032
- Figure 22: Europe Clinical Trial Imaging Services Market Revenue (Million), by Modality 2024 & 2032
- Figure 23: Europe Clinical Trial Imaging Services Market Revenue Share (%), by Modality 2024 & 2032
- Figure 24: Europe Clinical Trial Imaging Services Market Revenue (Million), by End-User 2024 & 2032
- Figure 25: Europe Clinical Trial Imaging Services Market Revenue Share (%), by End-User 2024 & 2032
- Figure 26: Europe Clinical Trial Imaging Services Market Revenue (Million), by Country 2024 & 2032
- Figure 27: Europe Clinical Trial Imaging Services Market Revenue Share (%), by Country 2024 & 2032
- Figure 28: Asia Pacific Clinical Trial Imaging Services Market Revenue (Million), by Product and Service 2024 & 2032
- Figure 29: Asia Pacific Clinical Trial Imaging Services Market Revenue Share (%), by Product and Service 2024 & 2032
- Figure 30: Asia Pacific Clinical Trial Imaging Services Market Revenue (Million), by Modality 2024 & 2032
- Figure 31: Asia Pacific Clinical Trial Imaging Services Market Revenue Share (%), by Modality 2024 & 2032
- Figure 32: Asia Pacific Clinical Trial Imaging Services Market Revenue (Million), by End-User 2024 & 2032
- Figure 33: Asia Pacific Clinical Trial Imaging Services Market Revenue Share (%), by End-User 2024 & 2032
- Figure 34: Asia Pacific Clinical Trial Imaging Services Market Revenue (Million), by Country 2024 & 2032
- Figure 35: Asia Pacific Clinical Trial Imaging Services Market Revenue Share (%), by Country 2024 & 2032
- Figure 36: Middle East and Africa Clinical Trial Imaging Services Market Revenue (Million), by Product and Service 2024 & 2032
- Figure 37: Middle East and Africa Clinical Trial Imaging Services Market Revenue Share (%), by Product and Service 2024 & 2032
- Figure 38: Middle East and Africa Clinical Trial Imaging Services Market Revenue (Million), by Modality 2024 & 2032
- Figure 39: Middle East and Africa Clinical Trial Imaging Services Market Revenue Share (%), by Modality 2024 & 2032
- Figure 40: Middle East and Africa Clinical Trial Imaging Services Market Revenue (Million), by End-User 2024 & 2032
- Figure 41: Middle East and Africa Clinical Trial Imaging Services Market Revenue Share (%), by End-User 2024 & 2032
- Figure 42: Middle East and Africa Clinical Trial Imaging Services Market Revenue (Million), by Country 2024 & 2032
- Figure 43: Middle East and Africa Clinical Trial Imaging Services Market Revenue Share (%), by Country 2024 & 2032
- Figure 44: South America Clinical Trial Imaging Services Market Revenue (Million), by Product and Service 2024 & 2032
- Figure 45: South America Clinical Trial Imaging Services Market Revenue Share (%), by Product and Service 2024 & 2032
- Figure 46: South America Clinical Trial Imaging Services Market Revenue (Million), by Modality 2024 & 2032
- Figure 47: South America Clinical Trial Imaging Services Market Revenue Share (%), by Modality 2024 & 2032
- Figure 48: South America Clinical Trial Imaging Services Market Revenue (Million), by End-User 2024 & 2032
- Figure 49: South America Clinical Trial Imaging Services Market Revenue Share (%), by End-User 2024 & 2032
- Figure 50: South America Clinical Trial Imaging Services Market Revenue (Million), by Country 2024 & 2032
- Figure 51: South America Clinical Trial Imaging Services Market Revenue Share (%), by Country 2024 & 2032
List of Tables
- Table 1: Global Clinical Trial Imaging Services Market Revenue Million Forecast, by Region 2019 & 2032
- Table 2: Global Clinical Trial Imaging Services Market Revenue Million Forecast, by Product and Service 2019 & 2032
- Table 3: Global Clinical Trial Imaging Services Market Revenue Million Forecast, by Modality 2019 & 2032
- Table 4: Global Clinical Trial Imaging Services Market Revenue Million Forecast, by End-User 2019 & 2032
- Table 5: Global Clinical Trial Imaging Services Market Revenue Million Forecast, by Region 2019 & 2032
- Table 6: Global Clinical Trial Imaging Services Market Revenue Million Forecast, by Country 2019 & 2032
- Table 7: United States Clinical Trial Imaging Services Market Revenue (Million) Forecast, by Application 2019 & 2032
- Table 8: Canada Clinical Trial Imaging Services Market Revenue (Million) Forecast, by Application 2019 & 2032
- Table 9: Mexico Clinical Trial Imaging Services Market Revenue (Million) Forecast, by Application 2019 & 2032
- Table 10: Global Clinical Trial Imaging Services Market Revenue Million Forecast, by Country 2019 & 2032
- Table 11: Germany Clinical Trial Imaging Services Market Revenue (Million) Forecast, by Application 2019 & 2032
- Table 12: United Kingdom Clinical Trial Imaging Services Market Revenue (Million) Forecast, by Application 2019 & 2032
- Table 13: France Clinical Trial Imaging Services Market Revenue (Million) Forecast, by Application 2019 & 2032
- Table 14: Italy Clinical Trial Imaging Services Market Revenue (Million) Forecast, by Application 2019 & 2032
- Table 15: Spain Clinical Trial Imaging Services Market Revenue (Million) Forecast, by Application 2019 & 2032
- Table 16: Rest of Europe Clinical Trial Imaging Services Market Revenue (Million) Forecast, by Application 2019 & 2032
- Table 17: Global Clinical Trial Imaging Services Market Revenue Million Forecast, by Country 2019 & 2032
- Table 18: China Clinical Trial Imaging Services Market Revenue (Million) Forecast, by Application 2019 & 2032
- Table 19: Japan Clinical Trial Imaging Services Market Revenue (Million) Forecast, by Application 2019 & 2032
- Table 20: India Clinical Trial Imaging Services Market Revenue (Million) Forecast, by Application 2019 & 2032
- Table 21: Australia Clinical Trial Imaging Services Market Revenue (Million) Forecast, by Application 2019 & 2032
- Table 22: South Korea Clinical Trial Imaging Services Market Revenue (Million) Forecast, by Application 2019 & 2032
- Table 23: Rest of Asia Pacific Clinical Trial Imaging Services Market Revenue (Million) Forecast, by Application 2019 & 2032
- Table 24: Global Clinical Trial Imaging Services Market Revenue Million Forecast, by Country 2019 & 2032
- Table 25: GCC Clinical Trial Imaging Services Market Revenue (Million) Forecast, by Application 2019 & 2032
- Table 26: South Africa Clinical Trial Imaging Services Market Revenue (Million) Forecast, by Application 2019 & 2032
- Table 27: Rest of Middle East and Africa Clinical Trial Imaging Services Market Revenue (Million) Forecast, by Application 2019 & 2032
- Table 28: Global Clinical Trial Imaging Services Market Revenue Million Forecast, by Country 2019 & 2032
- Table 29: Brazil Clinical Trial Imaging Services Market Revenue (Million) Forecast, by Application 2019 & 2032
- Table 30: Argentina Clinical Trial Imaging Services Market Revenue (Million) Forecast, by Application 2019 & 2032
- Table 31: Rest of South America Clinical Trial Imaging Services Market Revenue (Million) Forecast, by Application 2019 & 2032
- Table 32: Global Clinical Trial Imaging Services Market Revenue Million Forecast, by Product and Service 2019 & 2032
- Table 33: Global Clinical Trial Imaging Services Market Revenue Million Forecast, by Modality 2019 & 2032
- Table 34: Global Clinical Trial Imaging Services Market Revenue Million Forecast, by End-User 2019 & 2032
- Table 35: Global Clinical Trial Imaging Services Market Revenue Million Forecast, by Country 2019 & 2032
- Table 36: United States Clinical Trial Imaging Services Market Revenue (Million) Forecast, by Application 2019 & 2032
- Table 37: Canada Clinical Trial Imaging Services Market Revenue (Million) Forecast, by Application 2019 & 2032
- Table 38: Mexico Clinical Trial Imaging Services Market Revenue (Million) Forecast, by Application 2019 & 2032
- Table 39: Global Clinical Trial Imaging Services Market Revenue Million Forecast, by Product and Service 2019 & 2032
- Table 40: Global Clinical Trial Imaging Services Market Revenue Million Forecast, by Modality 2019 & 2032
- Table 41: Global Clinical Trial Imaging Services Market Revenue Million Forecast, by End-User 2019 & 2032
- Table 42: Global Clinical Trial Imaging Services Market Revenue Million Forecast, by Country 2019 & 2032
- Table 43: Germany Clinical Trial Imaging Services Market Revenue (Million) Forecast, by Application 2019 & 2032
- Table 44: United Kingdom Clinical Trial Imaging Services Market Revenue (Million) Forecast, by Application 2019 & 2032
- Table 45: France Clinical Trial Imaging Services Market Revenue (Million) Forecast, by Application 2019 & 2032
- Table 46: Italy Clinical Trial Imaging Services Market Revenue (Million) Forecast, by Application 2019 & 2032
- Table 47: Spain Clinical Trial Imaging Services Market Revenue (Million) Forecast, by Application 2019 & 2032
- Table 48: Rest of Europe Clinical Trial Imaging Services Market Revenue (Million) Forecast, by Application 2019 & 2032
- Table 49: Global Clinical Trial Imaging Services Market Revenue Million Forecast, by Product and Service 2019 & 2032
- Table 50: Global Clinical Trial Imaging Services Market Revenue Million Forecast, by Modality 2019 & 2032
- Table 51: Global Clinical Trial Imaging Services Market Revenue Million Forecast, by End-User 2019 & 2032
- Table 52: Global Clinical Trial Imaging Services Market Revenue Million Forecast, by Country 2019 & 2032
- Table 53: China Clinical Trial Imaging Services Market Revenue (Million) Forecast, by Application 2019 & 2032
- Table 54: Japan Clinical Trial Imaging Services Market Revenue (Million) Forecast, by Application 2019 & 2032
- Table 55: India Clinical Trial Imaging Services Market Revenue (Million) Forecast, by Application 2019 & 2032
- Table 56: Australia Clinical Trial Imaging Services Market Revenue (Million) Forecast, by Application 2019 & 2032
- Table 57: South Korea Clinical Trial Imaging Services Market Revenue (Million) Forecast, by Application 2019 & 2032
- Table 58: Rest of Asia Pacific Clinical Trial Imaging Services Market Revenue (Million) Forecast, by Application 2019 & 2032
- Table 59: Global Clinical Trial Imaging Services Market Revenue Million Forecast, by Product and Service 2019 & 2032
- Table 60: Global Clinical Trial Imaging Services Market Revenue Million Forecast, by Modality 2019 & 2032
- Table 61: Global Clinical Trial Imaging Services Market Revenue Million Forecast, by End-User 2019 & 2032
- Table 62: Global Clinical Trial Imaging Services Market Revenue Million Forecast, by Country 2019 & 2032
- Table 63: GCC Clinical Trial Imaging Services Market Revenue (Million) Forecast, by Application 2019 & 2032
- Table 64: South Africa Clinical Trial Imaging Services Market Revenue (Million) Forecast, by Application 2019 & 2032
- Table 65: Rest of Middle East and Africa Clinical Trial Imaging Services Market Revenue (Million) Forecast, by Application 2019 & 2032
- Table 66: Global Clinical Trial Imaging Services Market Revenue Million Forecast, by Product and Service 2019 & 2032
- Table 67: Global Clinical Trial Imaging Services Market Revenue Million Forecast, by Modality 2019 & 2032
- Table 68: Global Clinical Trial Imaging Services Market Revenue Million Forecast, by End-User 2019 & 2032
- Table 69: Global Clinical Trial Imaging Services Market Revenue Million Forecast, by Country 2019 & 2032
- Table 70: Brazil Clinical Trial Imaging Services Market Revenue (Million) Forecast, by Application 2019 & 2032
- Table 71: Argentina Clinical Trial Imaging Services Market Revenue (Million) Forecast, by Application 2019 & 2032
- Table 72: Rest of South America Clinical Trial Imaging Services Market Revenue (Million) Forecast, by Application 2019 & 2032
Frequently Asked Questions
1. What is the projected Compound Annual Growth Rate (CAGR) of the Clinical Trial Imaging Services Market?
The projected CAGR is approximately 5.38%.
2. Which companies are prominent players in the Clinical Trial Imaging Services Market?
Key companies in the market include Navitas Clinical Research Inc, Koninklijke Philips N V, Worldcare Clinical LLC, ProScan Imaging, Parexel International Corporation, Radiant Sage LLC, WIRB-Copernicus Group, Ixico PLC, Clario, Resonance Health, Medpace, Icon PLC.
3. What are the main segments of the Clinical Trial Imaging Services Market?
The market segments include Product and Service, Modality, End-User.
4. Can you provide details about the market size?
The market size is estimated to be USD 1.25 Million as of 2022.
5. What are some drivers contributing to market growth?
Increase in R&D Spending by the Pharmaceutical and Biotechnological Companies; Increasing Number of Contract Research Organization & Investment by Them.
6. What are the notable trends driving market growth?
Computed Tomography is Expected to Witness Rapid Growth Over the Forecast Period.
7. Are there any restraints impacting market growth?
High Implementation Barriers and Costs of Imaging Systems.
8. Can you provide examples of recent developments in the market?
In May 2022, at the International Society for Magnetic Resonance in Medicine (ISMRM) 2022 conference, Bruker launched innovative 7 Tesla and 9.4 Tesla conduction-cooled Maxwell magnets for its market-leading preclinical magnetic resonance imaging (MRI) systems portfolio.
9. What pricing options are available for accessing the report?
Pricing options include single-user, multi-user, and enterprise licenses priced at USD 4750, USD 5250, and USD 8750 respectively.
10. Is the market size provided in terms of value or volume?
The market size is provided in terms of value, measured in Million.
11. Are there any specific market keywords associated with the report?
Yes, the market keyword associated with the report is "Clinical Trial Imaging Services Market," which aids in identifying and referencing the specific market segment covered.
12. How do I determine which pricing option suits my needs best?
The pricing options vary based on user requirements and access needs. Individual users may opt for single-user licenses, while businesses requiring broader access may choose multi-user or enterprise licenses for cost-effective access to the report.
13. Are there any additional resources or data provided in the Clinical Trial Imaging Services Market report?
While the report offers comprehensive insights, it's advisable to review the specific contents or supplementary materials provided to ascertain if additional resources or data are available.
14. How can I stay updated on further developments or reports in the Clinical Trial Imaging Services Market?
To stay informed about further developments, trends, and reports in the Clinical Trial Imaging Services Market, consider subscribing to industry newsletters, following relevant companies and organizations, or regularly checking reputable industry news sources and publications.
Methodology
Step 1 - Identification of Relevant Samples Size from Population Database


Step 2 - Approaches for Defining Global Market Size (Value, Volume* & Price*)

Note*: In applicable scenarios
Step 3 - Data Sources
Primary Research
- Web Analytics
- Survey Reports
- Research Institute
- Latest Research Reports
- Opinion Leaders
Secondary Research
- Annual Reports
- White Paper
- Latest Press Release
- Industry Association
- Paid Database
- Investor Presentations

Step 4 - Data Triangulation
Involves using different sources of information in order to increase the validity of a study
These sources are likely to be stakeholders in a program - participants, other researchers, program staff, other community members, and so on.
Then we put all data in single framework & apply various statistical tools to find out the dynamic on the market.
During the analysis stage, feedback from the stakeholder groups would be compared to determine areas of agreement as well as areas of divergence
