

Key Insights
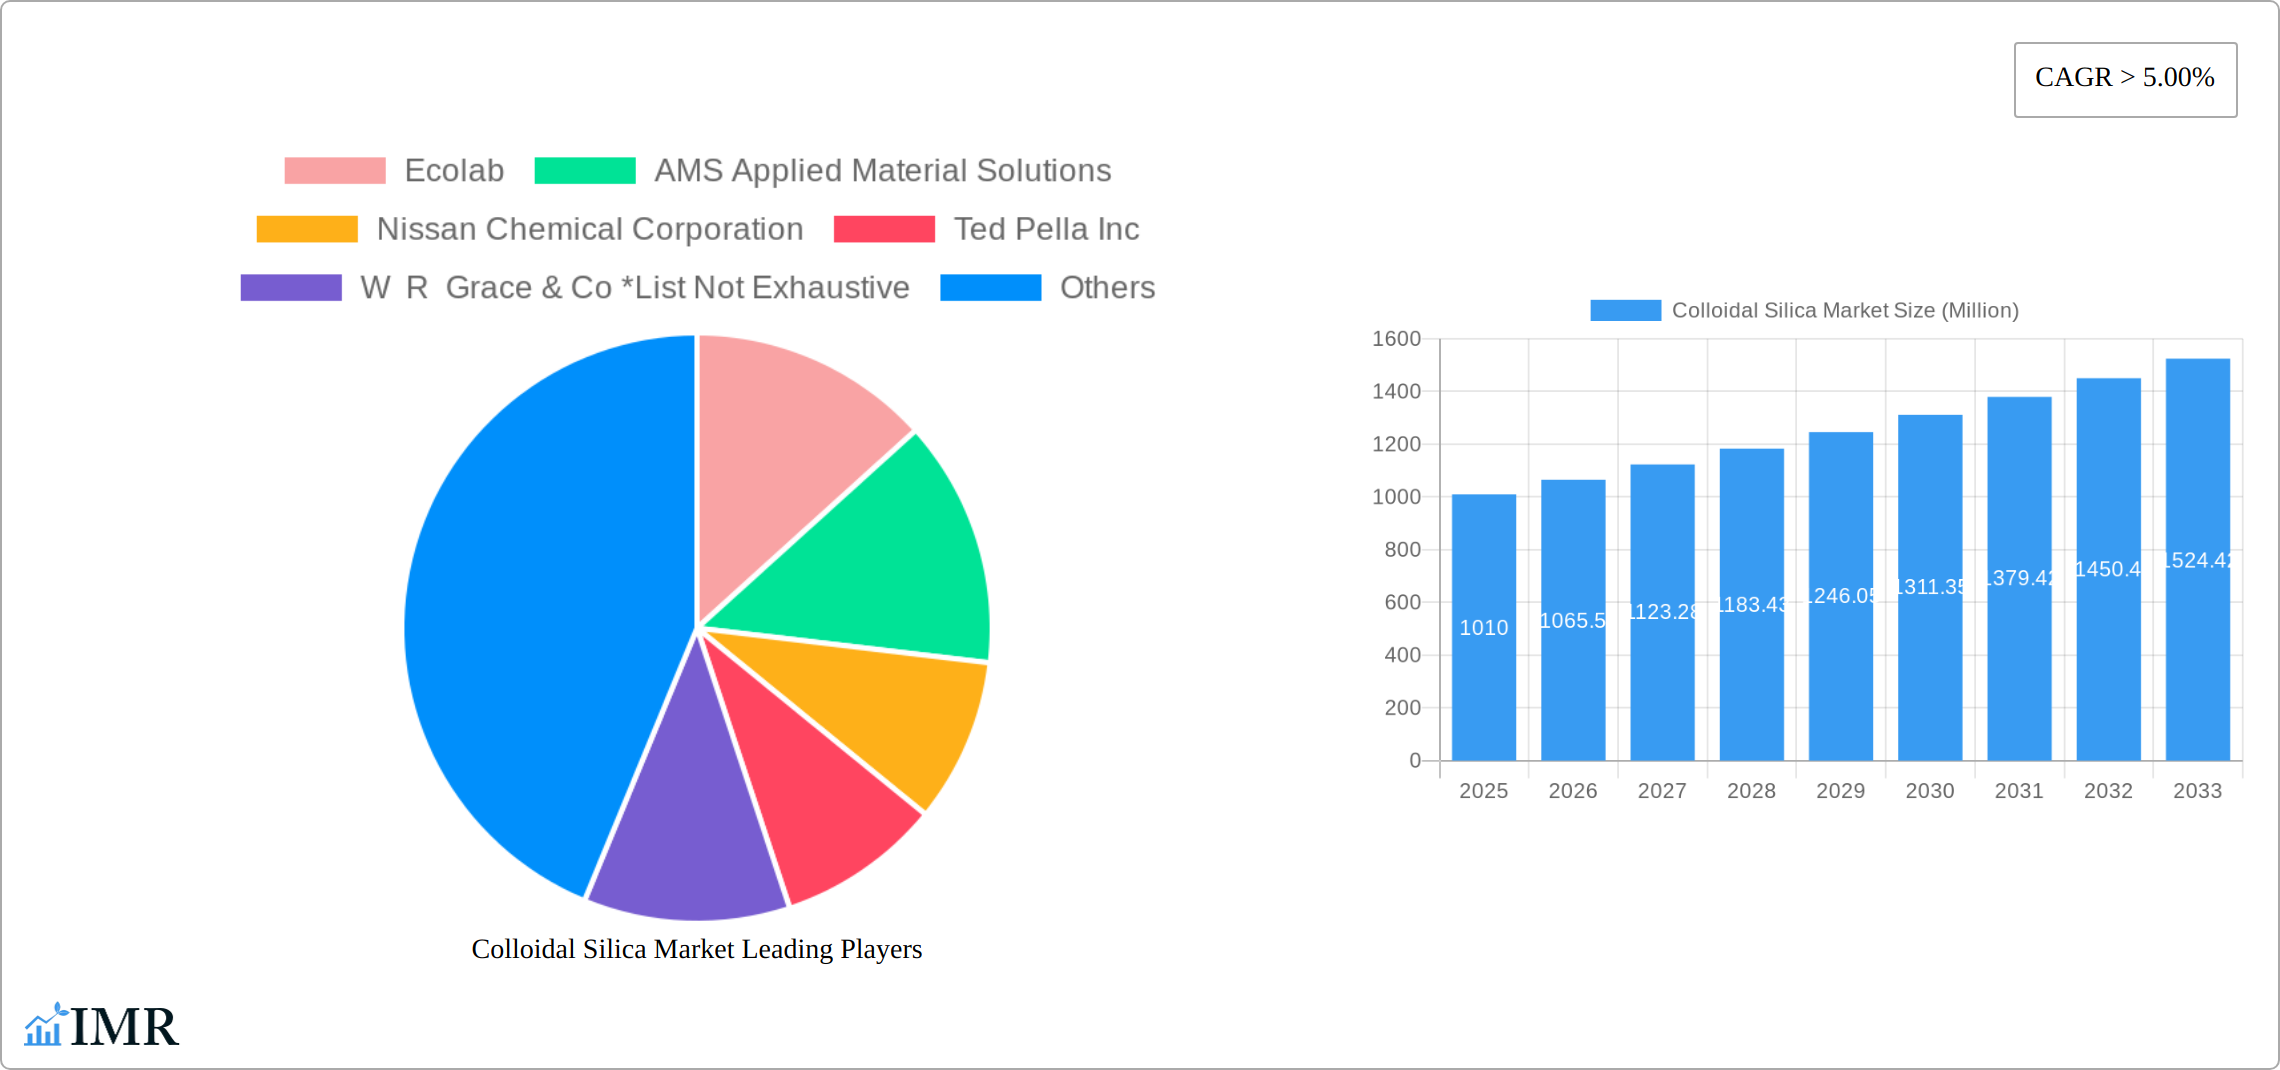
The global colloidal silica market, valued at approximately $1.01 billion in 2025, is projected to experience robust growth, exceeding a 5% CAGR from 2025 to 2033. This expansion is fueled by increasing demand across diverse end-use industries. The pulp and paper sector leverages colloidal silica for its reinforcing and binding properties in paper manufacturing, while the paints and coatings industry utilizes it to enhance rheology and improve the durability and gloss of coatings. The chemicals sector uses colloidal silica as a crucial component in various formulations, including catalysts and adsorbents. Furthermore, significant growth drivers include the construction industry’s adoption of colloidal silica in concrete admixtures for improved strength and workability, and its use in the electronics and semiconductor industries for polishing and cleaning applications. The expanding global infrastructure projects and technological advancements are key contributors to the market’s upward trajectory. However, challenges such as fluctuating raw material prices and environmental concerns related to silica production could act as potential restraints. Regional analysis reveals a strong presence in the Asia Pacific region, primarily driven by China and India's burgeoning industrial sectors, while North America and Europe are also significant markets.
The market segmentation reveals notable opportunities within specific end-use sectors. The pulp and paper industry remains a major consumer, continuously seeking efficient and high-performance materials. The paints and coatings sector's innovation and focus on sustainable products also present a significant growth avenue for colloidal silica manufacturers. Companies like Ecolab, Cabot Corporation, and Evonik are key players, driving innovation and expansion through technological advancements and strategic partnerships. The projected growth reflects a positive outlook driven by the expanding application scope of colloidal silica across various industrial segments and geographic regions. The ongoing investments in research and development, focused on producing more environmentally friendly colloidal silica solutions, will further contribute to the market's sustained growth. Competitive dynamics will continue to evolve, with a focus on product differentiation and cost optimization playing pivotal roles in shaping the market landscape.
Colloidal Silica Market: A Comprehensive Report (2019-2033)
This comprehensive report provides a detailed analysis of the Colloidal Silica Market, encompassing market dynamics, growth trends, regional segmentation, product landscape, key players, and future outlook. The study period covers 2019-2033, with 2025 as the base and estimated year. The report is invaluable for industry professionals, investors, and researchers seeking a thorough understanding of this dynamic market. The parent market is the specialty chemicals market, and the child market is the silica-based material segment.
Colloidal Silica Market Market Dynamics & Structure
The colloidal silica market is characterized by moderate concentration, with key players like Ecolab, AMS Applied Material Solutions, Nissan Chemical Corporation, and W R Grace & Co. holding significant market share, though the market remains fragmented with numerous regional players. Technological innovation, particularly in synthesizing higher-purity silica with tailored properties, is a significant growth driver. Stringent environmental regulations regarding silica dust and disposal are shaping manufacturing practices and product formulations. Competitive substitutes, such as other binders and thickening agents, exert pressure, but colloidal silica's unique properties often maintain its competitive advantage. The market is experiencing a wave of M&A activity, driven by the desire to expand product portfolios and geographical reach. Approximately xx M&A deals were recorded between 2019 and 2024, contributing to a xx% increase in market consolidation.
- Market Concentration: Moderately fragmented, with top 5 players holding approximately xx% market share in 2024.
- Technological Innovation: Focus on developing high-purity, customized silica for enhanced performance in diverse applications.
- Regulatory Landscape: Stringent environmental regulations impacting production and waste management.
- Competitive Substitutes: Alternative binders and thickeners present competitive pressure.
- M&A Activity: xx deals between 2019-2024, driving consolidation and expansion.
- Innovation Barriers: High R&D investment required for specialized silica formulations and scaling up production.
Colloidal Silica Market Growth Trends & Insights
The colloidal silica market demonstrated robust growth, exhibiting a strong CAGR during the period 2019-2024, reaching a substantial market size in 2024. This growth is primarily attributed to the rising demand from key end-use industries, particularly the construction and paints & coatings sectors, driven by the increasing use of colloidal silica as a binder, rheology modifier, and performance enhancer. Technological advancements leading to novel colloidal silica products with enhanced properties, such as improved rheology, dispersion, and stability, further fuel market expansion. The shift towards sustainable and high-performance materials is also positively impacting adoption rates. Future projections indicate a continued strong CAGR from 2025-2033, with a projected market valuation significantly exceeding that of 2024. Market penetration is anticipated to increase considerably in developing economies due to factors such as infrastructure development projects and rising disposable incomes. However, economic fluctuations and raw material price volatility could pose challenges to this growth trajectory.
Dominant Regions, Countries, or Segments in Colloidal Silica Market
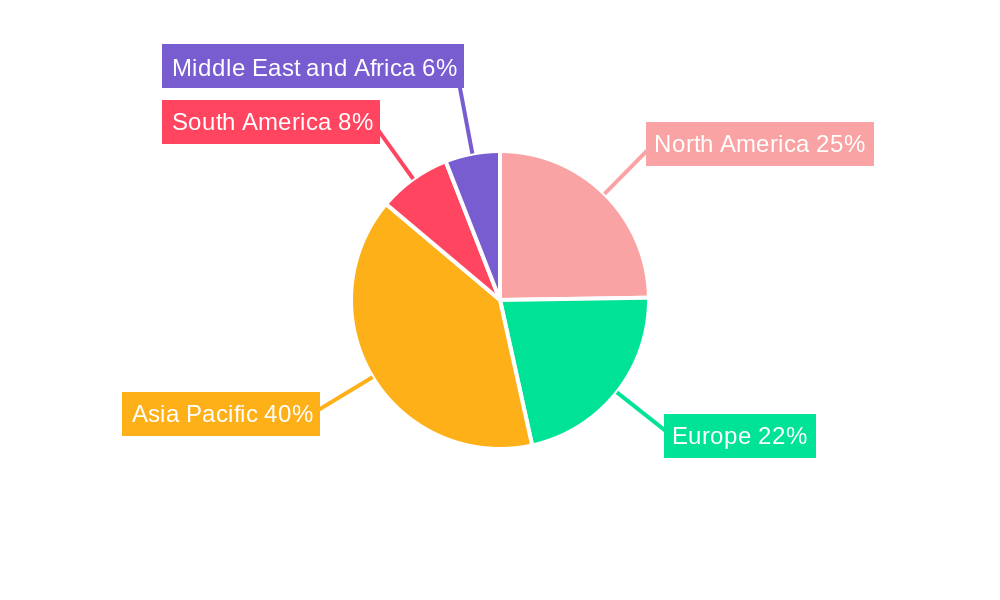
The Asia-Pacific region is currently the dominant market for colloidal silica, driven by rapid industrialization and robust growth in the construction, paints and coatings, and electronics sectors. China and India are key contributors to this regional dominance. North America and Europe hold significant market shares as well, characterized by mature markets and a focus on high-value applications.
Asia-Pacific: Dominant region, driven by construction and industrial growth in China and India.
North America: Significant market share, focused on high-value applications in electronics and specialty chemicals.
Europe: Mature market with focus on sustainability and stringent regulations.
End-user Industry Dominance: Paints and Coatings segment projected to maintain its leading position due to its versatile applications and high demand.
Key Drivers: Rapid urbanization, infrastructure development, increasing demand for high-performance materials, and technological advancements.
Colloidal Silica Market Product Landscape
Colloidal silica products are available in various forms, including aqueous sols, dry powders, and organically modified silicas. These products cater to diverse applications by offering tailored properties such as high surface area, excellent rheological control, and superior binding characteristics. Ongoing innovations focus on creating silica with improved dispersibility, enhanced stability, and customized particle size distributions to further optimize performance across different sectors. Unique selling propositions revolve around tailored properties for specific applications, and advancements include incorporating nanoparticles for improved performance.
Key Drivers, Barriers & Challenges in Colloidal Silica Market
Key Drivers:
- Rising demand from construction and coatings industries.
- Technological advancements leading to improved product properties.
- Increasing use in electronics and semiconductor applications.
Challenges & Restraints:
- Fluctuations in raw material prices (e.g., silica sand).
- Stringent environmental regulations and disposal costs.
- Intense competition from alternative materials.
- Supply chain disruptions impacting availability and pricing.
Emerging Opportunities in Colloidal Silica Market
Significant emerging opportunities exist in exploring applications within novel sectors. These include the burgeoning fields of biomedicine (e.g., drug delivery systems and targeted therapies), 3D printing (as binders and functional additives), and advanced manufacturing (in high-performance coatings and specialized materials). Untapped markets in rapidly developing economies present substantial growth potential, driven by infrastructure development and industrialization. The increasing global focus on sustainability is a significant driver, promoting the development of eco-friendly colloidal silica production methods, biodegradable formulations, and applications minimizing environmental impact. This includes research into alternative precursors and solvents, as well as efficient waste management strategies.
Growth Accelerators in the Colloidal Silica Market Industry
Technological breakthroughs in synthesis methods enabling precise control over particle size and surface properties are major growth catalysts. Strategic partnerships between colloidal silica manufacturers and end-users are fostering the development of customized solutions. Market expansion strategies, including geographic diversification and targeting niche applications, are further accelerating growth.
Key Players Shaping the Colloidal Silica Market Market
- Ecolab
- AMS Applied Material Solutions
- Nissan Chemical Corporation
- Ted Pella Inc
- W R Grace & Co
- Cabot Corporation
- Nyacol
- FUSO CHEMICAL CO LTD
- Nouryon
- CWK Chemiewerk Bad Kstritz GmbH
- Linyi Kehan Silicon Products Co LTD
- Sterling Chemicals
- Jinan Yinfeng Silicon Products Co Ltd
- Akasel
- Evonik
Notable Milestones in Colloidal Silica Market Sector
- June 2020: W. R. Grace & Co. opened a new colloidal silica plant in Germany, expanding its EMEA reach.
- November 2021: Nouryon announced increased production capacity at its Green Bay facility to meet growing packaging and construction market demands.
In-Depth Colloidal Silica Market Market Outlook
The colloidal silica market is poised for robust growth, driven by ongoing technological advancements, expanding applications, and increasing demand from diverse industries. Strategic partnerships, focusing on customized solutions and sustainability, will further propel market expansion. The market presents significant opportunities for both established players and new entrants seeking to capitalize on its growth trajectory.
Colloidal Silica Market Segmentation
-
1. End-user Industry
- 1.1. Pulp and Paper
- 1.2. Paints and Coatings
- 1.3. Chemicals
- 1.4. Construction
- 1.5. Metals and Metallurgy
- 1.6. Electronics and Semiconductors
- 1.7. Other End-user Industries
Colloidal Silica Market Segmentation By Geography
-
1. Asia Pacific
- 1.1. China
- 1.2. India
- 1.3. Japan
- 1.4. South Korea
- 1.5. Rest of Asia Pacific
-
2. North America
- 2.1. United States
- 2.2. Canada
- 2.3. Mexico
-
3. Europe
- 3.1. Germany
- 3.2. United Kingdom
- 3.3. Italy
- 3.4. France
- 3.5. Rest of Europe
-
4. South America
- 4.1. Brazil
- 4.2. Argentina
- 4.3. Rest of South America
-
5. Middle East and Africa
- 5.1. Saudi Arabia
- 5.2. South Africa
- 5.3. Rest of Middle East and Africa
Colloidal Silica Market REPORT HIGHLIGHTS
| Aspects | Details |
|---|---|
| Study Period | 2019-2033 |
| Base Year | 2024 |
| Estimated Year | 2025 |
| Forecast Period | 2025-2033 |
| Historical Period | 2019-2024 |
| Growth Rate | CAGR of > 5.00% from 2019-2033 |
| Segmentation |
|
Table of Contents
- 1. Introduction
- 1.1. Research Scope
- 1.2. Market Segmentation
- 1.3. Research Methodology
- 1.4. Definitions and Assumptions
- 2. Executive Summary
- 2.1. Introduction
- 3. Market Dynamics
- 3.1. Introduction
- 3.2. Market Drivers
- 3.2.1. Rising Demand for Concrete and Cements in the Construction Industry Globally; Increasing Demand for Silicon wafers for Production of Integrated Circuits in Electronic Devices
- 3.3. Market Restrains
- 3.3.1. Slow Drying Properties of Colloidal Silica; Other Restraints
- 3.4. Market Trends
- 3.4.1. Increasing Usage in the Construction Industry
- 4. Market Factor Analysis
- 4.1. Porters Five Forces
- 4.2. Supply/Value Chain
- 4.3. PESTEL analysis
- 4.4. Market Entropy
- 4.5. Patent/Trademark Analysis
- 5. Global Colloidal Silica Market Analysis, Insights and Forecast, 2019-2031
- 5.1. Market Analysis, Insights and Forecast - by End-user Industry
- 5.1.1. Pulp and Paper
- 5.1.2. Paints and Coatings
- 5.1.3. Chemicals
- 5.1.4. Construction
- 5.1.5. Metals and Metallurgy
- 5.1.6. Electronics and Semiconductors
- 5.1.7. Other End-user Industries
- 5.2. Market Analysis, Insights and Forecast - by Region
- 5.2.1. Asia Pacific
- 5.2.2. North America
- 5.2.3. Europe
- 5.2.4. South America
- 5.2.5. Middle East and Africa
- 5.1. Market Analysis, Insights and Forecast - by End-user Industry
- 6. Asia Pacific Colloidal Silica Market Analysis, Insights and Forecast, 2019-2031
- 6.1. Market Analysis, Insights and Forecast - by End-user Industry
- 6.1.1. Pulp and Paper
- 6.1.2. Paints and Coatings
- 6.1.3. Chemicals
- 6.1.4. Construction
- 6.1.5. Metals and Metallurgy
- 6.1.6. Electronics and Semiconductors
- 6.1.7. Other End-user Industries
- 6.1. Market Analysis, Insights and Forecast - by End-user Industry
- 7. North America Colloidal Silica Market Analysis, Insights and Forecast, 2019-2031
- 7.1. Market Analysis, Insights and Forecast - by End-user Industry
- 7.1.1. Pulp and Paper
- 7.1.2. Paints and Coatings
- 7.1.3. Chemicals
- 7.1.4. Construction
- 7.1.5. Metals and Metallurgy
- 7.1.6. Electronics and Semiconductors
- 7.1.7. Other End-user Industries
- 7.1. Market Analysis, Insights and Forecast - by End-user Industry
- 8. Europe Colloidal Silica Market Analysis, Insights and Forecast, 2019-2031
- 8.1. Market Analysis, Insights and Forecast - by End-user Industry
- 8.1.1. Pulp and Paper
- 8.1.2. Paints and Coatings
- 8.1.3. Chemicals
- 8.1.4. Construction
- 8.1.5. Metals and Metallurgy
- 8.1.6. Electronics and Semiconductors
- 8.1.7. Other End-user Industries
- 8.1. Market Analysis, Insights and Forecast - by End-user Industry
- 9. South America Colloidal Silica Market Analysis, Insights and Forecast, 2019-2031
- 9.1. Market Analysis, Insights and Forecast - by End-user Industry
- 9.1.1. Pulp and Paper
- 9.1.2. Paints and Coatings
- 9.1.3. Chemicals
- 9.1.4. Construction
- 9.1.5. Metals and Metallurgy
- 9.1.6. Electronics and Semiconductors
- 9.1.7. Other End-user Industries
- 9.1. Market Analysis, Insights and Forecast - by End-user Industry
- 10. Middle East and Africa Colloidal Silica Market Analysis, Insights and Forecast, 2019-2031
- 10.1. Market Analysis, Insights and Forecast - by End-user Industry
- 10.1.1. Pulp and Paper
- 10.1.2. Paints and Coatings
- 10.1.3. Chemicals
- 10.1.4. Construction
- 10.1.5. Metals and Metallurgy
- 10.1.6. Electronics and Semiconductors
- 10.1.7. Other End-user Industries
- 10.1. Market Analysis, Insights and Forecast - by End-user Industry
- 11. Asia Pacific Colloidal Silica Market Analysis, Insights and Forecast, 2019-2031
- 11.1. Market Analysis, Insights and Forecast - By Country/Sub-region
- 11.1.1 China
- 11.1.2 India
- 11.1.3 Japan
- 11.1.4 South Korea
- 11.1.5 Rest of Asia Pacific
- 12. North America Colloidal Silica Market Analysis, Insights and Forecast, 2019-2031
- 12.1. Market Analysis, Insights and Forecast - By Country/Sub-region
- 12.1.1 United States
- 12.1.2 Canada
- 12.1.3 Mexico
- 13. Europe Colloidal Silica Market Analysis, Insights and Forecast, 2019-2031
- 13.1. Market Analysis, Insights and Forecast - By Country/Sub-region
- 13.1.1 Germany
- 13.1.2 United Kingdom
- 13.1.3 Italy
- 13.1.4 France
- 13.1.5 Rest of Europe
- 14. South America Colloidal Silica Market Analysis, Insights and Forecast, 2019-2031
- 14.1. Market Analysis, Insights and Forecast - By Country/Sub-region
- 14.1.1 Brazil
- 14.1.2 Argentina
- 14.1.3 Rest of South America
- 15. Middle East and Africa Colloidal Silica Market Analysis, Insights and Forecast, 2019-2031
- 15.1. Market Analysis, Insights and Forecast - By Country/Sub-region
- 15.1.1 Saudi Arabia
- 15.1.2 South Africa
- 15.1.3 Rest of Middle East and Africa
- 16. Competitive Analysis
- 16.1. Global Market Share Analysis 2024
- 16.2. Company Profiles
- 16.2.1 Ecolab
- 16.2.1.1. Overview
- 16.2.1.2. Products
- 16.2.1.3. SWOT Analysis
- 16.2.1.4. Recent Developments
- 16.2.1.5. Financials (Based on Availability)
- 16.2.2 AMS Applied Material Solutions
- 16.2.2.1. Overview
- 16.2.2.2. Products
- 16.2.2.3. SWOT Analysis
- 16.2.2.4. Recent Developments
- 16.2.2.5. Financials (Based on Availability)
- 16.2.3 Nissan Chemical Corporation
- 16.2.3.1. Overview
- 16.2.3.2. Products
- 16.2.3.3. SWOT Analysis
- 16.2.3.4. Recent Developments
- 16.2.3.5. Financials (Based on Availability)
- 16.2.4 Ted Pella Inc
- 16.2.4.1. Overview
- 16.2.4.2. Products
- 16.2.4.3. SWOT Analysis
- 16.2.4.4. Recent Developments
- 16.2.4.5. Financials (Based on Availability)
- 16.2.5 W R Grace & Co *List Not Exhaustive
- 16.2.5.1. Overview
- 16.2.5.2. Products
- 16.2.5.3. SWOT Analysis
- 16.2.5.4. Recent Developments
- 16.2.5.5. Financials (Based on Availability)
- 16.2.6 Cabot Corporation
- 16.2.6.1. Overview
- 16.2.6.2. Products
- 16.2.6.3. SWOT Analysis
- 16.2.6.4. Recent Developments
- 16.2.6.5. Financials (Based on Availability)
- 16.2.7 Nyacol
- 16.2.7.1. Overview
- 16.2.7.2. Products
- 16.2.7.3. SWOT Analysis
- 16.2.7.4. Recent Developments
- 16.2.7.5. Financials (Based on Availability)
- 16.2.8 FUSO CHEMICAL CO LTD
- 16.2.8.1. Overview
- 16.2.8.2. Products
- 16.2.8.3. SWOT Analysis
- 16.2.8.4. Recent Developments
- 16.2.8.5. Financials (Based on Availability)
- 16.2.9 Nouryan
- 16.2.9.1. Overview
- 16.2.9.2. Products
- 16.2.9.3. SWOT Analysis
- 16.2.9.4. Recent Developments
- 16.2.9.5. Financials (Based on Availability)
- 16.2.10 CWK Chemiewerk Bad Kstritz GmbH
- 16.2.10.1. Overview
- 16.2.10.2. Products
- 16.2.10.3. SWOT Analysis
- 16.2.10.4. Recent Developments
- 16.2.10.5. Financials (Based on Availability)
- 16.2.11 Linyi Kehan Silicon Products Co LTD
- 16.2.11.1. Overview
- 16.2.11.2. Products
- 16.2.11.3. SWOT Analysis
- 16.2.11.4. Recent Developments
- 16.2.11.5. Financials (Based on Availability)
- 16.2.12 Sterling Chemicals
- 16.2.12.1. Overview
- 16.2.12.2. Products
- 16.2.12.3. SWOT Analysis
- 16.2.12.4. Recent Developments
- 16.2.12.5. Financials (Based on Availability)
- 16.2.13 Jinan Yinfeng Silicon Products Co Ltd
- 16.2.13.1. Overview
- 16.2.13.2. Products
- 16.2.13.3. SWOT Analysis
- 16.2.13.4. Recent Developments
- 16.2.13.5. Financials (Based on Availability)
- 16.2.14 Akasel
- 16.2.14.1. Overview
- 16.2.14.2. Products
- 16.2.14.3. SWOT Analysis
- 16.2.14.4. Recent Developments
- 16.2.14.5. Financials (Based on Availability)
- 16.2.15 Evonik
- 16.2.15.1. Overview
- 16.2.15.2. Products
- 16.2.15.3. SWOT Analysis
- 16.2.15.4. Recent Developments
- 16.2.15.5. Financials (Based on Availability)
- 16.2.1 Ecolab
List of Figures
- Figure 1: Global Colloidal Silica Market Revenue Breakdown (Million, %) by Region 2024 & 2032
- Figure 2: Global Colloidal Silica Market Volume Breakdown (K Tons, %) by Region 2024 & 2032
- Figure 3: Asia Pacific Colloidal Silica Market Revenue (Million), by Country 2024 & 2032
- Figure 4: Asia Pacific Colloidal Silica Market Volume (K Tons), by Country 2024 & 2032
- Figure 5: Asia Pacific Colloidal Silica Market Revenue Share (%), by Country 2024 & 2032
- Figure 6: Asia Pacific Colloidal Silica Market Volume Share (%), by Country 2024 & 2032
- Figure 7: North America Colloidal Silica Market Revenue (Million), by Country 2024 & 2032
- Figure 8: North America Colloidal Silica Market Volume (K Tons), by Country 2024 & 2032
- Figure 9: North America Colloidal Silica Market Revenue Share (%), by Country 2024 & 2032
- Figure 10: North America Colloidal Silica Market Volume Share (%), by Country 2024 & 2032
- Figure 11: Europe Colloidal Silica Market Revenue (Million), by Country 2024 & 2032
- Figure 12: Europe Colloidal Silica Market Volume (K Tons), by Country 2024 & 2032
- Figure 13: Europe Colloidal Silica Market Revenue Share (%), by Country 2024 & 2032
- Figure 14: Europe Colloidal Silica Market Volume Share (%), by Country 2024 & 2032
- Figure 15: South America Colloidal Silica Market Revenue (Million), by Country 2024 & 2032
- Figure 16: South America Colloidal Silica Market Volume (K Tons), by Country 2024 & 2032
- Figure 17: South America Colloidal Silica Market Revenue Share (%), by Country 2024 & 2032
- Figure 18: South America Colloidal Silica Market Volume Share (%), by Country 2024 & 2032
- Figure 19: Middle East and Africa Colloidal Silica Market Revenue (Million), by Country 2024 & 2032
- Figure 20: Middle East and Africa Colloidal Silica Market Volume (K Tons), by Country 2024 & 2032
- Figure 21: Middle East and Africa Colloidal Silica Market Revenue Share (%), by Country 2024 & 2032
- Figure 22: Middle East and Africa Colloidal Silica Market Volume Share (%), by Country 2024 & 2032
- Figure 23: Asia Pacific Colloidal Silica Market Revenue (Million), by End-user Industry 2024 & 2032
- Figure 24: Asia Pacific Colloidal Silica Market Volume (K Tons), by End-user Industry 2024 & 2032
- Figure 25: Asia Pacific Colloidal Silica Market Revenue Share (%), by End-user Industry 2024 & 2032
- Figure 26: Asia Pacific Colloidal Silica Market Volume Share (%), by End-user Industry 2024 & 2032
- Figure 27: Asia Pacific Colloidal Silica Market Revenue (Million), by Country 2024 & 2032
- Figure 28: Asia Pacific Colloidal Silica Market Volume (K Tons), by Country 2024 & 2032
- Figure 29: Asia Pacific Colloidal Silica Market Revenue Share (%), by Country 2024 & 2032
- Figure 30: Asia Pacific Colloidal Silica Market Volume Share (%), by Country 2024 & 2032
- Figure 31: North America Colloidal Silica Market Revenue (Million), by End-user Industry 2024 & 2032
- Figure 32: North America Colloidal Silica Market Volume (K Tons), by End-user Industry 2024 & 2032
- Figure 33: North America Colloidal Silica Market Revenue Share (%), by End-user Industry 2024 & 2032
- Figure 34: North America Colloidal Silica Market Volume Share (%), by End-user Industry 2024 & 2032
- Figure 35: North America Colloidal Silica Market Revenue (Million), by Country 2024 & 2032
- Figure 36: North America Colloidal Silica Market Volume (K Tons), by Country 2024 & 2032
- Figure 37: North America Colloidal Silica Market Revenue Share (%), by Country 2024 & 2032
- Figure 38: North America Colloidal Silica Market Volume Share (%), by Country 2024 & 2032
- Figure 39: Europe Colloidal Silica Market Revenue (Million), by End-user Industry 2024 & 2032
- Figure 40: Europe Colloidal Silica Market Volume (K Tons), by End-user Industry 2024 & 2032
- Figure 41: Europe Colloidal Silica Market Revenue Share (%), by End-user Industry 2024 & 2032
- Figure 42: Europe Colloidal Silica Market Volume Share (%), by End-user Industry 2024 & 2032
- Figure 43: Europe Colloidal Silica Market Revenue (Million), by Country 2024 & 2032
- Figure 44: Europe Colloidal Silica Market Volume (K Tons), by Country 2024 & 2032
- Figure 45: Europe Colloidal Silica Market Revenue Share (%), by Country 2024 & 2032
- Figure 46: Europe Colloidal Silica Market Volume Share (%), by Country 2024 & 2032
- Figure 47: South America Colloidal Silica Market Revenue (Million), by End-user Industry 2024 & 2032
- Figure 48: South America Colloidal Silica Market Volume (K Tons), by End-user Industry 2024 & 2032
- Figure 49: South America Colloidal Silica Market Revenue Share (%), by End-user Industry 2024 & 2032
- Figure 50: South America Colloidal Silica Market Volume Share (%), by End-user Industry 2024 & 2032
- Figure 51: South America Colloidal Silica Market Revenue (Million), by Country 2024 & 2032
- Figure 52: South America Colloidal Silica Market Volume (K Tons), by Country 2024 & 2032
- Figure 53: South America Colloidal Silica Market Revenue Share (%), by Country 2024 & 2032
- Figure 54: South America Colloidal Silica Market Volume Share (%), by Country 2024 & 2032
- Figure 55: Middle East and Africa Colloidal Silica Market Revenue (Million), by End-user Industry 2024 & 2032
- Figure 56: Middle East and Africa Colloidal Silica Market Volume (K Tons), by End-user Industry 2024 & 2032
- Figure 57: Middle East and Africa Colloidal Silica Market Revenue Share (%), by End-user Industry 2024 & 2032
- Figure 58: Middle East and Africa Colloidal Silica Market Volume Share (%), by End-user Industry 2024 & 2032
- Figure 59: Middle East and Africa Colloidal Silica Market Revenue (Million), by Country 2024 & 2032
- Figure 60: Middle East and Africa Colloidal Silica Market Volume (K Tons), by Country 2024 & 2032
- Figure 61: Middle East and Africa Colloidal Silica Market Revenue Share (%), by Country 2024 & 2032
- Figure 62: Middle East and Africa Colloidal Silica Market Volume Share (%), by Country 2024 & 2032
List of Tables
- Table 1: Global Colloidal Silica Market Revenue Million Forecast, by Region 2019 & 2032
- Table 2: Global Colloidal Silica Market Volume K Tons Forecast, by Region 2019 & 2032
- Table 3: Global Colloidal Silica Market Revenue Million Forecast, by End-user Industry 2019 & 2032
- Table 4: Global Colloidal Silica Market Volume K Tons Forecast, by End-user Industry 2019 & 2032
- Table 5: Global Colloidal Silica Market Revenue Million Forecast, by Region 2019 & 2032
- Table 6: Global Colloidal Silica Market Volume K Tons Forecast, by Region 2019 & 2032
- Table 7: Global Colloidal Silica Market Revenue Million Forecast, by Country 2019 & 2032
- Table 8: Global Colloidal Silica Market Volume K Tons Forecast, by Country 2019 & 2032
- Table 9: China Colloidal Silica Market Revenue (Million) Forecast, by Application 2019 & 2032
- Table 10: China Colloidal Silica Market Volume (K Tons) Forecast, by Application 2019 & 2032
- Table 11: India Colloidal Silica Market Revenue (Million) Forecast, by Application 2019 & 2032
- Table 12: India Colloidal Silica Market Volume (K Tons) Forecast, by Application 2019 & 2032
- Table 13: Japan Colloidal Silica Market Revenue (Million) Forecast, by Application 2019 & 2032
- Table 14: Japan Colloidal Silica Market Volume (K Tons) Forecast, by Application 2019 & 2032
- Table 15: South Korea Colloidal Silica Market Revenue (Million) Forecast, by Application 2019 & 2032
- Table 16: South Korea Colloidal Silica Market Volume (K Tons) Forecast, by Application 2019 & 2032
- Table 17: Rest of Asia Pacific Colloidal Silica Market Revenue (Million) Forecast, by Application 2019 & 2032
- Table 18: Rest of Asia Pacific Colloidal Silica Market Volume (K Tons) Forecast, by Application 2019 & 2032
- Table 19: Global Colloidal Silica Market Revenue Million Forecast, by Country 2019 & 2032
- Table 20: Global Colloidal Silica Market Volume K Tons Forecast, by Country 2019 & 2032
- Table 21: United States Colloidal Silica Market Revenue (Million) Forecast, by Application 2019 & 2032
- Table 22: United States Colloidal Silica Market Volume (K Tons) Forecast, by Application 2019 & 2032
- Table 23: Canada Colloidal Silica Market Revenue (Million) Forecast, by Application 2019 & 2032
- Table 24: Canada Colloidal Silica Market Volume (K Tons) Forecast, by Application 2019 & 2032
- Table 25: Mexico Colloidal Silica Market Revenue (Million) Forecast, by Application 2019 & 2032
- Table 26: Mexico Colloidal Silica Market Volume (K Tons) Forecast, by Application 2019 & 2032
- Table 27: Global Colloidal Silica Market Revenue Million Forecast, by Country 2019 & 2032
- Table 28: Global Colloidal Silica Market Volume K Tons Forecast, by Country 2019 & 2032
- Table 29: Germany Colloidal Silica Market Revenue (Million) Forecast, by Application 2019 & 2032
- Table 30: Germany Colloidal Silica Market Volume (K Tons) Forecast, by Application 2019 & 2032
- Table 31: United Kingdom Colloidal Silica Market Revenue (Million) Forecast, by Application 2019 & 2032
- Table 32: United Kingdom Colloidal Silica Market Volume (K Tons) Forecast, by Application 2019 & 2032
- Table 33: Italy Colloidal Silica Market Revenue (Million) Forecast, by Application 2019 & 2032
- Table 34: Italy Colloidal Silica Market Volume (K Tons) Forecast, by Application 2019 & 2032
- Table 35: France Colloidal Silica Market Revenue (Million) Forecast, by Application 2019 & 2032
- Table 36: France Colloidal Silica Market Volume (K Tons) Forecast, by Application 2019 & 2032
- Table 37: Rest of Europe Colloidal Silica Market Revenue (Million) Forecast, by Application 2019 & 2032
- Table 38: Rest of Europe Colloidal Silica Market Volume (K Tons) Forecast, by Application 2019 & 2032
- Table 39: Global Colloidal Silica Market Revenue Million Forecast, by Country 2019 & 2032
- Table 40: Global Colloidal Silica Market Volume K Tons Forecast, by Country 2019 & 2032
- Table 41: Brazil Colloidal Silica Market Revenue (Million) Forecast, by Application 2019 & 2032
- Table 42: Brazil Colloidal Silica Market Volume (K Tons) Forecast, by Application 2019 & 2032
- Table 43: Argentina Colloidal Silica Market Revenue (Million) Forecast, by Application 2019 & 2032
- Table 44: Argentina Colloidal Silica Market Volume (K Tons) Forecast, by Application 2019 & 2032
- Table 45: Rest of South America Colloidal Silica Market Revenue (Million) Forecast, by Application 2019 & 2032
- Table 46: Rest of South America Colloidal Silica Market Volume (K Tons) Forecast, by Application 2019 & 2032
- Table 47: Global Colloidal Silica Market Revenue Million Forecast, by Country 2019 & 2032
- Table 48: Global Colloidal Silica Market Volume K Tons Forecast, by Country 2019 & 2032
- Table 49: Saudi Arabia Colloidal Silica Market Revenue (Million) Forecast, by Application 2019 & 2032
- Table 50: Saudi Arabia Colloidal Silica Market Volume (K Tons) Forecast, by Application 2019 & 2032
- Table 51: South Africa Colloidal Silica Market Revenue (Million) Forecast, by Application 2019 & 2032
- Table 52: South Africa Colloidal Silica Market Volume (K Tons) Forecast, by Application 2019 & 2032
- Table 53: Rest of Middle East and Africa Colloidal Silica Market Revenue (Million) Forecast, by Application 2019 & 2032
- Table 54: Rest of Middle East and Africa Colloidal Silica Market Volume (K Tons) Forecast, by Application 2019 & 2032
- Table 55: Global Colloidal Silica Market Revenue Million Forecast, by End-user Industry 2019 & 2032
- Table 56: Global Colloidal Silica Market Volume K Tons Forecast, by End-user Industry 2019 & 2032
- Table 57: Global Colloidal Silica Market Revenue Million Forecast, by Country 2019 & 2032
- Table 58: Global Colloidal Silica Market Volume K Tons Forecast, by Country 2019 & 2032
- Table 59: China Colloidal Silica Market Revenue (Million) Forecast, by Application 2019 & 2032
- Table 60: China Colloidal Silica Market Volume (K Tons) Forecast, by Application 2019 & 2032
- Table 61: India Colloidal Silica Market Revenue (Million) Forecast, by Application 2019 & 2032
- Table 62: India Colloidal Silica Market Volume (K Tons) Forecast, by Application 2019 & 2032
- Table 63: Japan Colloidal Silica Market Revenue (Million) Forecast, by Application 2019 & 2032
- Table 64: Japan Colloidal Silica Market Volume (K Tons) Forecast, by Application 2019 & 2032
- Table 65: South Korea Colloidal Silica Market Revenue (Million) Forecast, by Application 2019 & 2032
- Table 66: South Korea Colloidal Silica Market Volume (K Tons) Forecast, by Application 2019 & 2032
- Table 67: Rest of Asia Pacific Colloidal Silica Market Revenue (Million) Forecast, by Application 2019 & 2032
- Table 68: Rest of Asia Pacific Colloidal Silica Market Volume (K Tons) Forecast, by Application 2019 & 2032
- Table 69: Global Colloidal Silica Market Revenue Million Forecast, by End-user Industry 2019 & 2032
- Table 70: Global Colloidal Silica Market Volume K Tons Forecast, by End-user Industry 2019 & 2032
- Table 71: Global Colloidal Silica Market Revenue Million Forecast, by Country 2019 & 2032
- Table 72: Global Colloidal Silica Market Volume K Tons Forecast, by Country 2019 & 2032
- Table 73: United States Colloidal Silica Market Revenue (Million) Forecast, by Application 2019 & 2032
- Table 74: United States Colloidal Silica Market Volume (K Tons) Forecast, by Application 2019 & 2032
- Table 75: Canada Colloidal Silica Market Revenue (Million) Forecast, by Application 2019 & 2032
- Table 76: Canada Colloidal Silica Market Volume (K Tons) Forecast, by Application 2019 & 2032
- Table 77: Mexico Colloidal Silica Market Revenue (Million) Forecast, by Application 2019 & 2032
- Table 78: Mexico Colloidal Silica Market Volume (K Tons) Forecast, by Application 2019 & 2032
- Table 79: Global Colloidal Silica Market Revenue Million Forecast, by End-user Industry 2019 & 2032
- Table 80: Global Colloidal Silica Market Volume K Tons Forecast, by End-user Industry 2019 & 2032
- Table 81: Global Colloidal Silica Market Revenue Million Forecast, by Country 2019 & 2032
- Table 82: Global Colloidal Silica Market Volume K Tons Forecast, by Country 2019 & 2032
- Table 83: Germany Colloidal Silica Market Revenue (Million) Forecast, by Application 2019 & 2032
- Table 84: Germany Colloidal Silica Market Volume (K Tons) Forecast, by Application 2019 & 2032
- Table 85: United Kingdom Colloidal Silica Market Revenue (Million) Forecast, by Application 2019 & 2032
- Table 86: United Kingdom Colloidal Silica Market Volume (K Tons) Forecast, by Application 2019 & 2032
- Table 87: Italy Colloidal Silica Market Revenue (Million) Forecast, by Application 2019 & 2032
- Table 88: Italy Colloidal Silica Market Volume (K Tons) Forecast, by Application 2019 & 2032
- Table 89: France Colloidal Silica Market Revenue (Million) Forecast, by Application 2019 & 2032
- Table 90: France Colloidal Silica Market Volume (K Tons) Forecast, by Application 2019 & 2032
- Table 91: Rest of Europe Colloidal Silica Market Revenue (Million) Forecast, by Application 2019 & 2032
- Table 92: Rest of Europe Colloidal Silica Market Volume (K Tons) Forecast, by Application 2019 & 2032
- Table 93: Global Colloidal Silica Market Revenue Million Forecast, by End-user Industry 2019 & 2032
- Table 94: Global Colloidal Silica Market Volume K Tons Forecast, by End-user Industry 2019 & 2032
- Table 95: Global Colloidal Silica Market Revenue Million Forecast, by Country 2019 & 2032
- Table 96: Global Colloidal Silica Market Volume K Tons Forecast, by Country 2019 & 2032
- Table 97: Brazil Colloidal Silica Market Revenue (Million) Forecast, by Application 2019 & 2032
- Table 98: Brazil Colloidal Silica Market Volume (K Tons) Forecast, by Application 2019 & 2032
- Table 99: Argentina Colloidal Silica Market Revenue (Million) Forecast, by Application 2019 & 2032
- Table 100: Argentina Colloidal Silica Market Volume (K Tons) Forecast, by Application 2019 & 2032
- Table 101: Rest of South America Colloidal Silica Market Revenue (Million) Forecast, by Application 2019 & 2032
- Table 102: Rest of South America Colloidal Silica Market Volume (K Tons) Forecast, by Application 2019 & 2032
- Table 103: Global Colloidal Silica Market Revenue Million Forecast, by End-user Industry 2019 & 2032
- Table 104: Global Colloidal Silica Market Volume K Tons Forecast, by End-user Industry 2019 & 2032
- Table 105: Global Colloidal Silica Market Revenue Million Forecast, by Country 2019 & 2032
- Table 106: Global Colloidal Silica Market Volume K Tons Forecast, by Country 2019 & 2032
- Table 107: Saudi Arabia Colloidal Silica Market Revenue (Million) Forecast, by Application 2019 & 2032
- Table 108: Saudi Arabia Colloidal Silica Market Volume (K Tons) Forecast, by Application 2019 & 2032
- Table 109: South Africa Colloidal Silica Market Revenue (Million) Forecast, by Application 2019 & 2032
- Table 110: South Africa Colloidal Silica Market Volume (K Tons) Forecast, by Application 2019 & 2032
- Table 111: Rest of Middle East and Africa Colloidal Silica Market Revenue (Million) Forecast, by Application 2019 & 2032
- Table 112: Rest of Middle East and Africa Colloidal Silica Market Volume (K Tons) Forecast, by Application 2019 & 2032
Frequently Asked Questions
1. What is the projected Compound Annual Growth Rate (CAGR) of the Colloidal Silica Market?
The projected CAGR is approximately > 5.00%.
2. Which companies are prominent players in the Colloidal Silica Market?
Key companies in the market include Ecolab, AMS Applied Material Solutions, Nissan Chemical Corporation, Ted Pella Inc, W R Grace & Co *List Not Exhaustive, Cabot Corporation, Nyacol, FUSO CHEMICAL CO LTD, Nouryan, CWK Chemiewerk Bad Kstritz GmbH, Linyi Kehan Silicon Products Co LTD, Sterling Chemicals, Jinan Yinfeng Silicon Products Co Ltd, Akasel, Evonik.
3. What are the main segments of the Colloidal Silica Market?
The market segments include End-user Industry.
4. Can you provide details about the market size?
The market size is estimated to be USD 1010 Million as of 2022.
5. What are some drivers contributing to market growth?
Rising Demand for Concrete and Cements in the Construction Industry Globally; Increasing Demand for Silicon wafers for Production of Integrated Circuits in Electronic Devices.
6. What are the notable trends driving market growth?
Increasing Usage in the Construction Industry.
7. Are there any restraints impacting market growth?
Slow Drying Properties of Colloidal Silica; Other Restraints.
8. Can you provide examples of recent developments in the market?
In November 2021, Nouryon announced to increase the production capacity of the colloidal silica manufacturing facility, based in Green Bay, Wisconsin, U.S.A. The increased production capacity will help in meeting demands for packaging and construction end markets. The construction is expected to complete in the second half of 2022.
9. What pricing options are available for accessing the report?
Pricing options include single-user, multi-user, and enterprise licenses priced at USD 4750, USD 5250, and USD 8750 respectively.
10. Is the market size provided in terms of value or volume?
The market size is provided in terms of value, measured in Million and volume, measured in K Tons.
11. Are there any specific market keywords associated with the report?
Yes, the market keyword associated with the report is "Colloidal Silica Market," which aids in identifying and referencing the specific market segment covered.
12. How do I determine which pricing option suits my needs best?
The pricing options vary based on user requirements and access needs. Individual users may opt for single-user licenses, while businesses requiring broader access may choose multi-user or enterprise licenses for cost-effective access to the report.
13. Are there any additional resources or data provided in the Colloidal Silica Market report?
While the report offers comprehensive insights, it's advisable to review the specific contents or supplementary materials provided to ascertain if additional resources or data are available.
14. How can I stay updated on further developments or reports in the Colloidal Silica Market?
To stay informed about further developments, trends, and reports in the Colloidal Silica Market, consider subscribing to industry newsletters, following relevant companies and organizations, or regularly checking reputable industry news sources and publications.
Methodology
Step 1 - Identification of Relevant Samples Size from Population Database


Step 2 - Approaches for Defining Global Market Size (Value, Volume* & Price*)

Note*: In applicable scenarios
Step 3 - Data Sources
Primary Research
- Web Analytics
- Survey Reports
- Research Institute
- Latest Research Reports
- Opinion Leaders
Secondary Research
- Annual Reports
- White Paper
- Latest Press Release
- Industry Association
- Paid Database
- Investor Presentations

Step 4 - Data Triangulation
Involves using different sources of information in order to increase the validity of a study
These sources are likely to be stakeholders in a program - participants, other researchers, program staff, other community members, and so on.
Then we put all data in single framework & apply various statistical tools to find out the dynamic on the market.
During the analysis stage, feedback from the stakeholder groups would be compared to determine areas of agreement as well as areas of divergence
