

Key Insights
The global engineering plastic recycling market is projected for substantial growth, fueled by increasing environmental awareness, robust regulatory frameworks for plastic waste reduction, and a rising demand for sustainable materials across diverse sectors. With an anticipated CAGR of 8% from the base year of 2025, the market is expected to reach a significant valuation of $5 billion. Key growth catalysts include the expanded use of recycled plastics in packaging, particularly within the food and beverage sector, driven by consumer preference for eco-friendly products. The automotive and electronics industries are also major contributors, as manufacturers integrate recycled engineering plastics to lower their environmental impact and achieve sustainability objectives. Innovations in recycling technologies, such as chemical recycling, are enhancing the quality and utility of recycled engineering plastics, creating new market opportunities. The market is segmented by plastic type (polycarbonate, PET, ABS/SAN, polyamide, and others) and end-user industry (packaging, industrial yarn, electrical and electronics, and others). Packaging and electronics currently lead market share, with industrial yarn showing strong potential due to increasing demand for sustainable textiles. Challenges such as cost-effectiveness and inconsistent material quality are being addressed through ongoing research, development, and supportive government policies, promoting wider adoption.
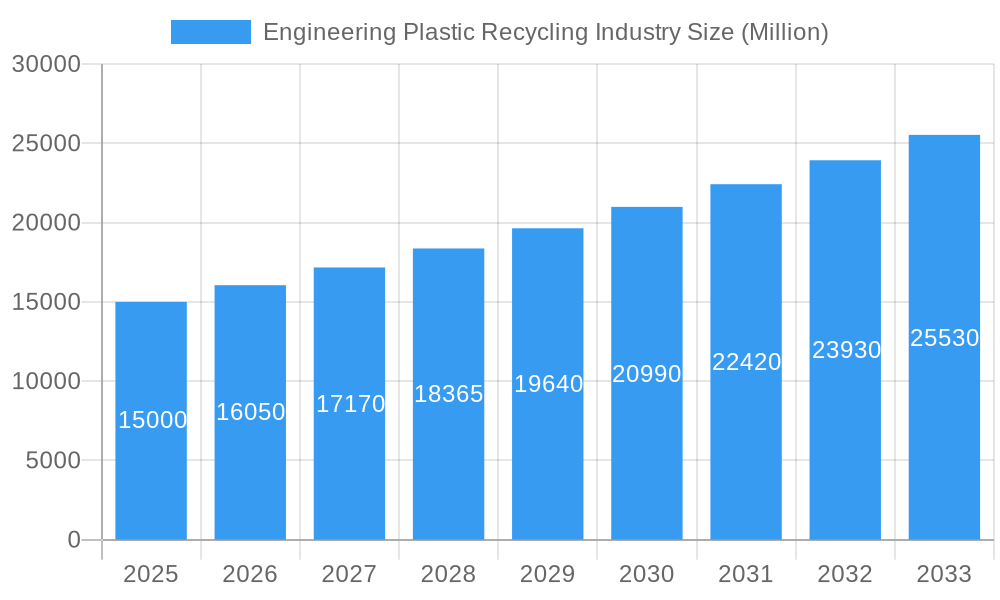
Engineering Plastic Recycling Industry Market Size (In Billion)
Geographically, North America and Europe are prominent markets, supported by advanced recycling infrastructure and stringent environmental regulations. The Asia-Pacific region, particularly China and India, offers significant growth potential driven by rapid industrialization and increasing demand for recycled plastics. South America and the MEA regions are emerging markets, with infrastructure development and regulatory clarity being critical for their expansion. The competitive environment is dynamic, comprising established leaders and innovative startups. Major companies are investing in advanced recycling technologies and expanding production capacities to meet evolving market needs. Strategic collaborations and acquisitions are anticipated to shape the industry's future. Continued emphasis on sustainable solutions will ensure sustained long-term growth for the engineering plastic recycling market.
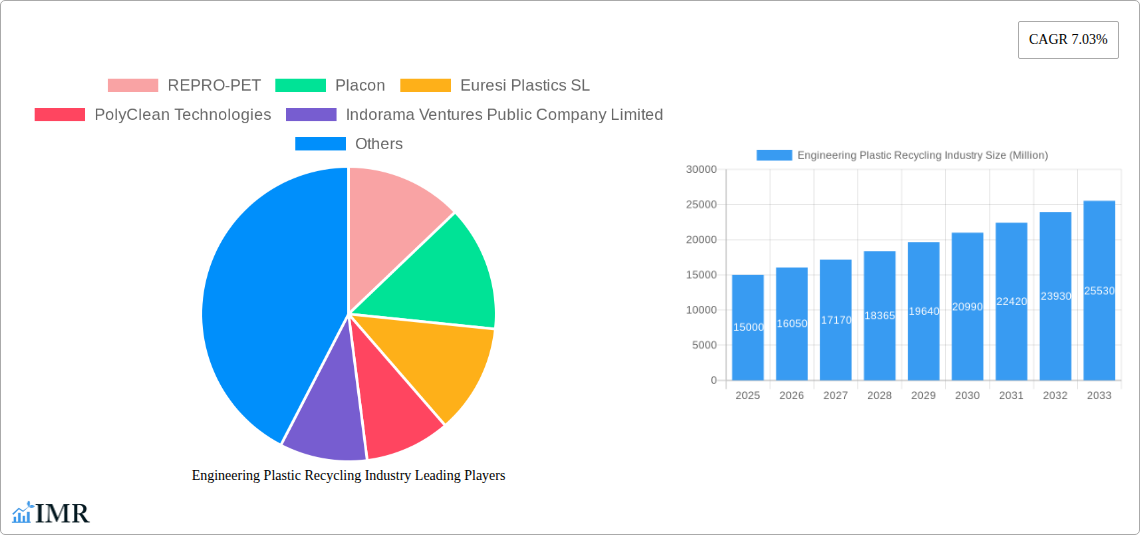
Engineering Plastic Recycling Industry Company Market Share
Engineering Plastic Recycling Industry Market Report: 2019-2033
This comprehensive report provides an in-depth analysis of the Engineering Plastic Recycling Industry, encompassing market dynamics, growth trends, regional analysis, product landscape, key players, and future outlook. The study period covers 2019-2033, with 2025 as the base and estimated year. The report segments the market by plastic type (Polycarbonate, Polyethylene Terephthalate (PET), Styrene Copolymers (ABS and SAN), Polyamide, Other Engineering Plastics) and end-user industry (Packaging, Industrial Yarn, Electrical and Electronics, Other End-user Industries). It offers invaluable insights for industry professionals, investors, and stakeholders seeking to navigate this rapidly evolving market. The report is valued at xx Million units.
Engineering Plastic Recycling Industry Market Dynamics & Structure
The Engineering Plastic Recycling industry is characterized by a moderately concentrated market structure, with several large players and a significant number of smaller, regional operators. Technological innovation, driven by advancements in sorting, separation, and chemical recycling technologies, plays a crucial role in shaping market dynamics. Stringent environmental regulations globally are driving growth, while the availability of cost-effective substitutes and fluctuating raw material prices present ongoing challenges. Consumer demand for sustainable and recycled products is a key growth driver. Mergers and acquisitions (M&A) activity is relatively high, reflecting industry consolidation and expansion strategies. The global market size in 2025 is estimated to be xx Million units.
- Market Concentration: Moderately concentrated, with top 5 players holding approximately xx% market share in 2025.
- Technological Innovation: Advancements in AI-powered sorting, enzymatic depolymerization, and chemical recycling are key drivers.
- Regulatory Framework: Stringent environmental regulations in Europe and North America are accelerating adoption.
- Competitive Substitutes: Virgin plastics remain a significant competitive threat.
- End-User Demographics: Growth is driven by increasing awareness of environmental sustainability among consumers and businesses.
- M&A Trends: Significant M&A activity, with an estimated xx deals in the past 5 years, driving industry consolidation.
Engineering Plastic Recycling Industry Growth Trends & Insights
The Engineering Plastic Recycling market exhibits robust growth, driven by increasing environmental concerns, stringent regulations, and the rising demand for sustainable materials. The market size has grown significantly from xx Million units in 2019 to an estimated xx Million units in 2025, reflecting a Compound Annual Growth Rate (CAGR) of xx% during the historical period (2019-2024). This growth trajectory is expected to continue, with a projected CAGR of xx% from 2025 to 2033. Technological advancements in recycling processes, coupled with increasing consumer preference for eco-friendly products, are key factors contributing to this growth. Market penetration for recycled engineering plastics is increasing steadily, with xx% of the total engineering plastics market estimated to be recycled by 2025. However, challenges such as inconsistent quality of recycled materials and the higher cost compared to virgin plastics remain hurdles to overcome.
Dominant Regions, Countries, or Segments in Engineering Plastic Recycling Industry
The European Union and North America are currently the dominant regions in the Engineering Plastic Recycling industry, driven by strong environmental regulations and high consumer awareness of sustainability. Within these regions, Germany and the United States are leading national markets. In terms of plastic types, Polyethylene Terephthalate (PET) currently holds the largest market share, followed by Polyamide. The Packaging end-user industry accounts for a significant portion of the market volume.
- Key Drivers (EU & North America): Stringent environmental regulations, high consumer awareness, robust recycling infrastructure.
- Key Drivers (PET): High recyclability, established collection systems, diverse applications (packaging, textiles).
- Key Drivers (Packaging): High volume of plastic waste generated, increasing demand for sustainable packaging solutions.
- Growth Potential: Asia-Pacific is expected to witness significant growth in the coming years, fueled by rising disposable incomes and increasing industrialization.
Engineering Plastic Recycling Industry Product Landscape
The engineering plastic recycling industry offers a range of products, including recycled flakes, pellets, and compounds tailored to specific end-use applications. Recent innovations focus on enhancing the quality and performance of recycled plastics to match or exceed virgin materials, improving mechanical properties and reducing impurities. These advancements address a major barrier to wider adoption - the perceived lower quality of recycled materials. Unique selling propositions include enhanced sustainability credentials, reduced carbon footprint, and cost-effectiveness in specific applications.
Key Drivers, Barriers & Challenges in Engineering Plastic Recycling Industry
Key Drivers: Growing environmental consciousness, stringent government regulations on plastic waste management, technological advancements in recycling techniques, and the increasing availability of cost-effective recycling solutions. For example, Indorama Ventures' investments in advanced PET recycling plants significantly increase capacity.
Challenges: Inconsistent quality of recycled materials, high sorting and processing costs, competition from cheaper virgin plastics, and lack of efficient collection and sorting infrastructure in many regions. This results in reduced recycling rates and higher costs compared to virgin plastics. Estimated losses due to inefficiencies are around xx Million units annually.
Emerging Opportunities in Engineering Plastic Recycling Industry
Emerging opportunities include expanding into untapped markets, particularly in developing economies, developing innovative recycling technologies for challenging plastics (e.g., flexible plastics), exploring new applications for recycled plastics (e.g., construction materials), and catering to growing consumer demand for sustainable and recycled products. The focus on chemical recycling offers a potentially game-changing opportunity to recycle materials previously considered unrecyclable.
Growth Accelerators in the Engineering Plastic Recycling Industry
Long-term growth will be fueled by continuous technological innovation, strategic partnerships between recyclers, brand owners, and waste management companies, expansion into new geographical markets, and development of circular economy models that prioritize the reuse and recycling of plastics. Government incentives and extended producer responsibility schemes further enhance growth.
Key Players Shaping the Engineering Plastic Recycling Industry Market
- REPRO-PET
- Placon
- Euresi Plastics SL
- PolyClean Technologies
- Indorama Ventures Public Company Limited
- Reliance Industries Limited
- Krones AG
- Petco
- Clean Tech UK Ltd
- JFC Group
- Far Eastern New Century Corporation (Phoenix Technologies)
- TEIJIN LIMITED
- UltrePET LLC
- Alpek S A B de C V
- EF Plastics UK Ltd
Notable Milestones in Engineering Plastic Recycling Industry Sector
- February 2022: Indorama Ventures acquired UCY Polymers CZ s.r.o., expanding its PET recycling capacity by approximately 1.12 billion bottles annually in the Czech Republic by 2025.
- October 2022: Indorama Ventures opened a PET Value bottle-to-bottle recycling plant in the Philippines in partnership with Coca-Cola Beverages Philippines, significantly boosting PET recycling infrastructure in the region.
In-Depth Engineering Plastic Recycling Industry Market Outlook
The Engineering Plastic Recycling industry is poised for substantial growth in the coming years. Technological advancements, increasing regulatory pressures, and growing consumer demand for sustainable products will drive market expansion. Strategic partnerships and investments in advanced recycling technologies will play a crucial role in shaping the future of this sector. The focus on circular economy principles and the development of new applications for recycled plastics will unlock significant opportunities for growth and innovation. The market is projected to reach xx Million units by 2033, presenting lucrative opportunities for businesses and investors.
Engineering Plastic Recycling Industry Segmentation
-
1. Plastic Type
- 1.1. Polycarbonate
- 1.2. Polyethylene Terephthalate (PET)
- 1.3. Styrene Copolymers (ABS and SAN)
- 1.4. Polyamide
- 1.5. Other Engineering Plastics
-
2. End-user Industry
- 2.1. Packaging
- 2.2. Industrial Yarn
- 2.3. Electrical and Electronics
- 2.4. Other End-user Industries
Engineering Plastic Recycling Industry Segmentation By Geography
-
1. Asia Pacific
- 1.1. China
- 1.2. India
- 1.3. Japan
- 1.4. South Korea
- 1.5. Rest of Asia Pacific
-
2. North America
- 2.1. United States
- 2.2. Canada
- 2.3. Mexico
-
3. Europe
- 3.1. Germany
- 3.2. United Kingdom
- 3.3. France
- 3.4. Italy
- 3.5. Rest of Europe
-
4. Rest of the World
- 4.1. South America
- 4.2. Middle East and Africa
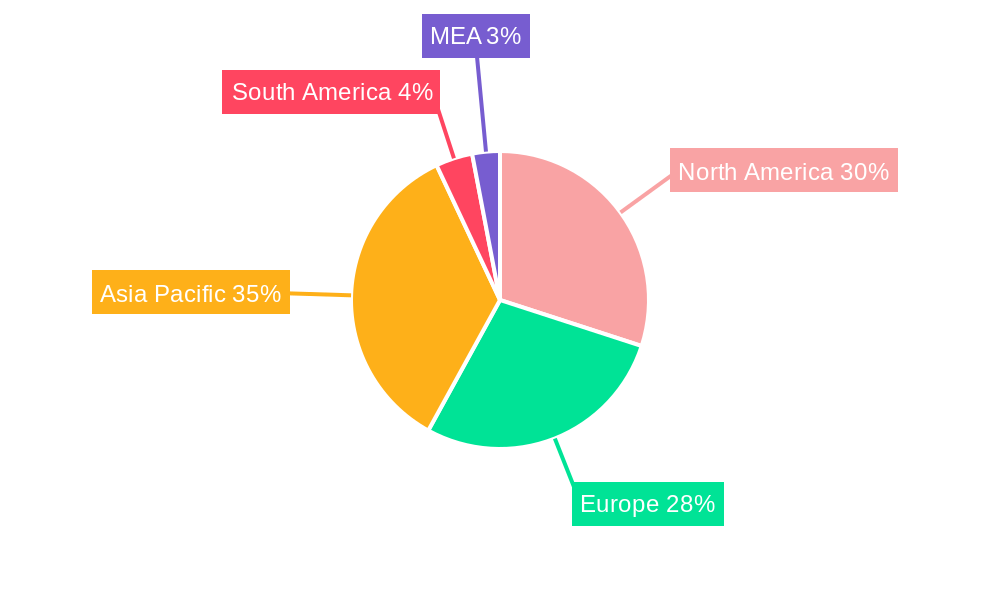
Engineering Plastic Recycling Industry Regional Market Share
Geographic Coverage of Engineering Plastic Recycling Industry
Engineering Plastic Recycling Industry REPORT HIGHLIGHTS
| Aspects | Details |
|---|---|
| Study Period | 2020-2034 |
| Base Year | 2025 |
| Estimated Year | 2026 |
| Forecast Period | 2026-2034 |
| Historical Period | 2020-2025 |
| Growth Rate | CAGR of 8% from 2020-2034 |
| Segmentation |
|
Table of Contents
- 1. Introduction
- 1.1. Research Scope
- 1.2. Market Segmentation
- 1.3. Research Methodology
- 1.4. Definitions and Assumptions
- 2. Executive Summary
- 2.1. Introduction
- 3. Market Dynamics
- 3.1. Introduction
- 3.2. Market Drivers
- 3.2.1. Growing Emphasis on Sustainability among Consumer and Packaging Products; Increasing Use of Recycled Polyester; Other Drivers
- 3.3. Market Restrains
- 3.3.1. Difficulty in Collecting and Sorting Mixed Plastic; Other Restraints
- 3.4. Market Trends
- 3.4.1. Packaging Industry to Dominate the Market
- 4. Market Factor Analysis
- 4.1. Porters Five Forces
- 4.2. Supply/Value Chain
- 4.3. PESTEL analysis
- 4.4. Market Entropy
- 4.5. Patent/Trademark Analysis
- 5. Global Engineering Plastic Recycling Industry Analysis, Insights and Forecast, 2020-2032
- 5.1. Market Analysis, Insights and Forecast - by Plastic Type
- 5.1.1. Polycarbonate
- 5.1.2. Polyethylene Terephthalate (PET)
- 5.1.3. Styrene Copolymers (ABS and SAN)
- 5.1.4. Polyamide
- 5.1.5. Other Engineering Plastics
- 5.2. Market Analysis, Insights and Forecast - by End-user Industry
- 5.2.1. Packaging
- 5.2.2. Industrial Yarn
- 5.2.3. Electrical and Electronics
- 5.2.4. Other End-user Industries
- 5.3. Market Analysis, Insights and Forecast - by Region
- 5.3.1. Asia Pacific
- 5.3.2. North America
- 5.3.3. Europe
- 5.3.4. Rest of the World
- 5.1. Market Analysis, Insights and Forecast - by Plastic Type
- 6. Asia Pacific Engineering Plastic Recycling Industry Analysis, Insights and Forecast, 2020-2032
- 6.1. Market Analysis, Insights and Forecast - by Plastic Type
- 6.1.1. Polycarbonate
- 6.1.2. Polyethylene Terephthalate (PET)
- 6.1.3. Styrene Copolymers (ABS and SAN)
- 6.1.4. Polyamide
- 6.1.5. Other Engineering Plastics
- 6.2. Market Analysis, Insights and Forecast - by End-user Industry
- 6.2.1. Packaging
- 6.2.2. Industrial Yarn
- 6.2.3. Electrical and Electronics
- 6.2.4. Other End-user Industries
- 6.1. Market Analysis, Insights and Forecast - by Plastic Type
- 7. North America Engineering Plastic Recycling Industry Analysis, Insights and Forecast, 2020-2032
- 7.1. Market Analysis, Insights and Forecast - by Plastic Type
- 7.1.1. Polycarbonate
- 7.1.2. Polyethylene Terephthalate (PET)
- 7.1.3. Styrene Copolymers (ABS and SAN)
- 7.1.4. Polyamide
- 7.1.5. Other Engineering Plastics
- 7.2. Market Analysis, Insights and Forecast - by End-user Industry
- 7.2.1. Packaging
- 7.2.2. Industrial Yarn
- 7.2.3. Electrical and Electronics
- 7.2.4. Other End-user Industries
- 7.1. Market Analysis, Insights and Forecast - by Plastic Type
- 8. Europe Engineering Plastic Recycling Industry Analysis, Insights and Forecast, 2020-2032
- 8.1. Market Analysis, Insights and Forecast - by Plastic Type
- 8.1.1. Polycarbonate
- 8.1.2. Polyethylene Terephthalate (PET)
- 8.1.3. Styrene Copolymers (ABS and SAN)
- 8.1.4. Polyamide
- 8.1.5. Other Engineering Plastics
- 8.2. Market Analysis, Insights and Forecast - by End-user Industry
- 8.2.1. Packaging
- 8.2.2. Industrial Yarn
- 8.2.3. Electrical and Electronics
- 8.2.4. Other End-user Industries
- 8.1. Market Analysis, Insights and Forecast - by Plastic Type
- 9. Rest of the World Engineering Plastic Recycling Industry Analysis, Insights and Forecast, 2020-2032
- 9.1. Market Analysis, Insights and Forecast - by Plastic Type
- 9.1.1. Polycarbonate
- 9.1.2. Polyethylene Terephthalate (PET)
- 9.1.3. Styrene Copolymers (ABS and SAN)
- 9.1.4. Polyamide
- 9.1.5. Other Engineering Plastics
- 9.2. Market Analysis, Insights and Forecast - by End-user Industry
- 9.2.1. Packaging
- 9.2.2. Industrial Yarn
- 9.2.3. Electrical and Electronics
- 9.2.4. Other End-user Industries
- 9.1. Market Analysis, Insights and Forecast - by Plastic Type
- 10. Competitive Analysis
- 10.1. Global Market Share Analysis 2025
- 10.2. Company Profiles
- 10.2.1 REPRO-PET
- 10.2.1.1. Overview
- 10.2.1.2. Products
- 10.2.1.3. SWOT Analysis
- 10.2.1.4. Recent Developments
- 10.2.1.5. Financials (Based on Availability)
- 10.2.2 Placon
- 10.2.2.1. Overview
- 10.2.2.2. Products
- 10.2.2.3. SWOT Analysis
- 10.2.2.4. Recent Developments
- 10.2.2.5. Financials (Based on Availability)
- 10.2.3 Euresi Plastics SL
- 10.2.3.1. Overview
- 10.2.3.2. Products
- 10.2.3.3. SWOT Analysis
- 10.2.3.4. Recent Developments
- 10.2.3.5. Financials (Based on Availability)
- 10.2.4 PolyClean Technologies
- 10.2.4.1. Overview
- 10.2.4.2. Products
- 10.2.4.3. SWOT Analysis
- 10.2.4.4. Recent Developments
- 10.2.4.5. Financials (Based on Availability)
- 10.2.5 Indorama Ventures Public Company Limited
- 10.2.5.1. Overview
- 10.2.5.2. Products
- 10.2.5.3. SWOT Analysis
- 10.2.5.4. Recent Developments
- 10.2.5.5. Financials (Based on Availability)
- 10.2.6 Reliance Industries Limited
- 10.2.6.1. Overview
- 10.2.6.2. Products
- 10.2.6.3. SWOT Analysis
- 10.2.6.4. Recent Developments
- 10.2.6.5. Financials (Based on Availability)
- 10.2.7 Krones AG
- 10.2.7.1. Overview
- 10.2.7.2. Products
- 10.2.7.3. SWOT Analysis
- 10.2.7.4. Recent Developments
- 10.2.7.5. Financials (Based on Availability)
- 10.2.8 Petco
- 10.2.8.1. Overview
- 10.2.8.2. Products
- 10.2.8.3. SWOT Analysis
- 10.2.8.4. Recent Developments
- 10.2.8.5. Financials (Based on Availability)
- 10.2.9 Clean Tech UK Ltd
- 10.2.9.1. Overview
- 10.2.9.2. Products
- 10.2.9.3. SWOT Analysis
- 10.2.9.4. Recent Developments
- 10.2.9.5. Financials (Based on Availability)
- 10.2.10 JFC Group
- 10.2.10.1. Overview
- 10.2.10.2. Products
- 10.2.10.3. SWOT Analysis
- 10.2.10.4. Recent Developments
- 10.2.10.5. Financials (Based on Availability)
- 10.2.11 Far Eastern New Century Corporation (Phoenix Technologies)
- 10.2.11.1. Overview
- 10.2.11.2. Products
- 10.2.11.3. SWOT Analysis
- 10.2.11.4. Recent Developments
- 10.2.11.5. Financials (Based on Availability)
- 10.2.12 TEIJIN LIMITED
- 10.2.12.1. Overview
- 10.2.12.2. Products
- 10.2.12.3. SWOT Analysis
- 10.2.12.4. Recent Developments
- 10.2.12.5. Financials (Based on Availability)
- 10.2.13 UltrePET LLC
- 10.2.13.1. Overview
- 10.2.13.2. Products
- 10.2.13.3. SWOT Analysis
- 10.2.13.4. Recent Developments
- 10.2.13.5. Financials (Based on Availability)
- 10.2.14 Alpek S A B de C V
- 10.2.14.1. Overview
- 10.2.14.2. Products
- 10.2.14.3. SWOT Analysis
- 10.2.14.4. Recent Developments
- 10.2.14.5. Financials (Based on Availability)
- 10.2.15 EF Plastics UK Ltd
- 10.2.15.1. Overview
- 10.2.15.2. Products
- 10.2.15.3. SWOT Analysis
- 10.2.15.4. Recent Developments
- 10.2.15.5. Financials (Based on Availability)
- 10.2.1 REPRO-PET
List of Figures
- Figure 1: Global Engineering Plastic Recycling Industry Revenue Breakdown (billion, %) by Region 2025 & 2033
- Figure 2: Global Engineering Plastic Recycling Industry Volume Breakdown (K Tons, %) by Region 2025 & 2033
- Figure 3: Asia Pacific Engineering Plastic Recycling Industry Revenue (billion), by Plastic Type 2025 & 2033
- Figure 4: Asia Pacific Engineering Plastic Recycling Industry Volume (K Tons), by Plastic Type 2025 & 2033
- Figure 5: Asia Pacific Engineering Plastic Recycling Industry Revenue Share (%), by Plastic Type 2025 & 2033
- Figure 6: Asia Pacific Engineering Plastic Recycling Industry Volume Share (%), by Plastic Type 2025 & 2033
- Figure 7: Asia Pacific Engineering Plastic Recycling Industry Revenue (billion), by End-user Industry 2025 & 2033
- Figure 8: Asia Pacific Engineering Plastic Recycling Industry Volume (K Tons), by End-user Industry 2025 & 2033
- Figure 9: Asia Pacific Engineering Plastic Recycling Industry Revenue Share (%), by End-user Industry 2025 & 2033
- Figure 10: Asia Pacific Engineering Plastic Recycling Industry Volume Share (%), by End-user Industry 2025 & 2033
- Figure 11: Asia Pacific Engineering Plastic Recycling Industry Revenue (billion), by Country 2025 & 2033
- Figure 12: Asia Pacific Engineering Plastic Recycling Industry Volume (K Tons), by Country 2025 & 2033
- Figure 13: Asia Pacific Engineering Plastic Recycling Industry Revenue Share (%), by Country 2025 & 2033
- Figure 14: Asia Pacific Engineering Plastic Recycling Industry Volume Share (%), by Country 2025 & 2033
- Figure 15: North America Engineering Plastic Recycling Industry Revenue (billion), by Plastic Type 2025 & 2033
- Figure 16: North America Engineering Plastic Recycling Industry Volume (K Tons), by Plastic Type 2025 & 2033
- Figure 17: North America Engineering Plastic Recycling Industry Revenue Share (%), by Plastic Type 2025 & 2033
- Figure 18: North America Engineering Plastic Recycling Industry Volume Share (%), by Plastic Type 2025 & 2033
- Figure 19: North America Engineering Plastic Recycling Industry Revenue (billion), by End-user Industry 2025 & 2033
- Figure 20: North America Engineering Plastic Recycling Industry Volume (K Tons), by End-user Industry 2025 & 2033
- Figure 21: North America Engineering Plastic Recycling Industry Revenue Share (%), by End-user Industry 2025 & 2033
- Figure 22: North America Engineering Plastic Recycling Industry Volume Share (%), by End-user Industry 2025 & 2033
- Figure 23: North America Engineering Plastic Recycling Industry Revenue (billion), by Country 2025 & 2033
- Figure 24: North America Engineering Plastic Recycling Industry Volume (K Tons), by Country 2025 & 2033
- Figure 25: North America Engineering Plastic Recycling Industry Revenue Share (%), by Country 2025 & 2033
- Figure 26: North America Engineering Plastic Recycling Industry Volume Share (%), by Country 2025 & 2033
- Figure 27: Europe Engineering Plastic Recycling Industry Revenue (billion), by Plastic Type 2025 & 2033
- Figure 28: Europe Engineering Plastic Recycling Industry Volume (K Tons), by Plastic Type 2025 & 2033
- Figure 29: Europe Engineering Plastic Recycling Industry Revenue Share (%), by Plastic Type 2025 & 2033
- Figure 30: Europe Engineering Plastic Recycling Industry Volume Share (%), by Plastic Type 2025 & 2033
- Figure 31: Europe Engineering Plastic Recycling Industry Revenue (billion), by End-user Industry 2025 & 2033
- Figure 32: Europe Engineering Plastic Recycling Industry Volume (K Tons), by End-user Industry 2025 & 2033
- Figure 33: Europe Engineering Plastic Recycling Industry Revenue Share (%), by End-user Industry 2025 & 2033
- Figure 34: Europe Engineering Plastic Recycling Industry Volume Share (%), by End-user Industry 2025 & 2033
- Figure 35: Europe Engineering Plastic Recycling Industry Revenue (billion), by Country 2025 & 2033
- Figure 36: Europe Engineering Plastic Recycling Industry Volume (K Tons), by Country 2025 & 2033
- Figure 37: Europe Engineering Plastic Recycling Industry Revenue Share (%), by Country 2025 & 2033
- Figure 38: Europe Engineering Plastic Recycling Industry Volume Share (%), by Country 2025 & 2033
- Figure 39: Rest of the World Engineering Plastic Recycling Industry Revenue (billion), by Plastic Type 2025 & 2033
- Figure 40: Rest of the World Engineering Plastic Recycling Industry Volume (K Tons), by Plastic Type 2025 & 2033
- Figure 41: Rest of the World Engineering Plastic Recycling Industry Revenue Share (%), by Plastic Type 2025 & 2033
- Figure 42: Rest of the World Engineering Plastic Recycling Industry Volume Share (%), by Plastic Type 2025 & 2033
- Figure 43: Rest of the World Engineering Plastic Recycling Industry Revenue (billion), by End-user Industry 2025 & 2033
- Figure 44: Rest of the World Engineering Plastic Recycling Industry Volume (K Tons), by End-user Industry 2025 & 2033
- Figure 45: Rest of the World Engineering Plastic Recycling Industry Revenue Share (%), by End-user Industry 2025 & 2033
- Figure 46: Rest of the World Engineering Plastic Recycling Industry Volume Share (%), by End-user Industry 2025 & 2033
- Figure 47: Rest of the World Engineering Plastic Recycling Industry Revenue (billion), by Country 2025 & 2033
- Figure 48: Rest of the World Engineering Plastic Recycling Industry Volume (K Tons), by Country 2025 & 2033
- Figure 49: Rest of the World Engineering Plastic Recycling Industry Revenue Share (%), by Country 2025 & 2033
- Figure 50: Rest of the World Engineering Plastic Recycling Industry Volume Share (%), by Country 2025 & 2033
List of Tables
- Table 1: Global Engineering Plastic Recycling Industry Revenue billion Forecast, by Plastic Type 2020 & 2033
- Table 2: Global Engineering Plastic Recycling Industry Volume K Tons Forecast, by Plastic Type 2020 & 2033
- Table 3: Global Engineering Plastic Recycling Industry Revenue billion Forecast, by End-user Industry 2020 & 2033
- Table 4: Global Engineering Plastic Recycling Industry Volume K Tons Forecast, by End-user Industry 2020 & 2033
- Table 5: Global Engineering Plastic Recycling Industry Revenue billion Forecast, by Region 2020 & 2033
- Table 6: Global Engineering Plastic Recycling Industry Volume K Tons Forecast, by Region 2020 & 2033
- Table 7: Global Engineering Plastic Recycling Industry Revenue billion Forecast, by Plastic Type 2020 & 2033
- Table 8: Global Engineering Plastic Recycling Industry Volume K Tons Forecast, by Plastic Type 2020 & 2033
- Table 9: Global Engineering Plastic Recycling Industry Revenue billion Forecast, by End-user Industry 2020 & 2033
- Table 10: Global Engineering Plastic Recycling Industry Volume K Tons Forecast, by End-user Industry 2020 & 2033
- Table 11: Global Engineering Plastic Recycling Industry Revenue billion Forecast, by Country 2020 & 2033
- Table 12: Global Engineering Plastic Recycling Industry Volume K Tons Forecast, by Country 2020 & 2033
- Table 13: China Engineering Plastic Recycling Industry Revenue (billion) Forecast, by Application 2020 & 2033
- Table 14: China Engineering Plastic Recycling Industry Volume (K Tons) Forecast, by Application 2020 & 2033
- Table 15: India Engineering Plastic Recycling Industry Revenue (billion) Forecast, by Application 2020 & 2033
- Table 16: India Engineering Plastic Recycling Industry Volume (K Tons) Forecast, by Application 2020 & 2033
- Table 17: Japan Engineering Plastic Recycling Industry Revenue (billion) Forecast, by Application 2020 & 2033
- Table 18: Japan Engineering Plastic Recycling Industry Volume (K Tons) Forecast, by Application 2020 & 2033
- Table 19: South Korea Engineering Plastic Recycling Industry Revenue (billion) Forecast, by Application 2020 & 2033
- Table 20: South Korea Engineering Plastic Recycling Industry Volume (K Tons) Forecast, by Application 2020 & 2033
- Table 21: Rest of Asia Pacific Engineering Plastic Recycling Industry Revenue (billion) Forecast, by Application 2020 & 2033
- Table 22: Rest of Asia Pacific Engineering Plastic Recycling Industry Volume (K Tons) Forecast, by Application 2020 & 2033
- Table 23: Global Engineering Plastic Recycling Industry Revenue billion Forecast, by Plastic Type 2020 & 2033
- Table 24: Global Engineering Plastic Recycling Industry Volume K Tons Forecast, by Plastic Type 2020 & 2033
- Table 25: Global Engineering Plastic Recycling Industry Revenue billion Forecast, by End-user Industry 2020 & 2033
- Table 26: Global Engineering Plastic Recycling Industry Volume K Tons Forecast, by End-user Industry 2020 & 2033
- Table 27: Global Engineering Plastic Recycling Industry Revenue billion Forecast, by Country 2020 & 2033
- Table 28: Global Engineering Plastic Recycling Industry Volume K Tons Forecast, by Country 2020 & 2033
- Table 29: United States Engineering Plastic Recycling Industry Revenue (billion) Forecast, by Application 2020 & 2033
- Table 30: United States Engineering Plastic Recycling Industry Volume (K Tons) Forecast, by Application 2020 & 2033
- Table 31: Canada Engineering Plastic Recycling Industry Revenue (billion) Forecast, by Application 2020 & 2033
- Table 32: Canada Engineering Plastic Recycling Industry Volume (K Tons) Forecast, by Application 2020 & 2033
- Table 33: Mexico Engineering Plastic Recycling Industry Revenue (billion) Forecast, by Application 2020 & 2033
- Table 34: Mexico Engineering Plastic Recycling Industry Volume (K Tons) Forecast, by Application 2020 & 2033
- Table 35: Global Engineering Plastic Recycling Industry Revenue billion Forecast, by Plastic Type 2020 & 2033
- Table 36: Global Engineering Plastic Recycling Industry Volume K Tons Forecast, by Plastic Type 2020 & 2033
- Table 37: Global Engineering Plastic Recycling Industry Revenue billion Forecast, by End-user Industry 2020 & 2033
- Table 38: Global Engineering Plastic Recycling Industry Volume K Tons Forecast, by End-user Industry 2020 & 2033
- Table 39: Global Engineering Plastic Recycling Industry Revenue billion Forecast, by Country 2020 & 2033
- Table 40: Global Engineering Plastic Recycling Industry Volume K Tons Forecast, by Country 2020 & 2033
- Table 41: Germany Engineering Plastic Recycling Industry Revenue (billion) Forecast, by Application 2020 & 2033
- Table 42: Germany Engineering Plastic Recycling Industry Volume (K Tons) Forecast, by Application 2020 & 2033
- Table 43: United Kingdom Engineering Plastic Recycling Industry Revenue (billion) Forecast, by Application 2020 & 2033
- Table 44: United Kingdom Engineering Plastic Recycling Industry Volume (K Tons) Forecast, by Application 2020 & 2033
- Table 45: France Engineering Plastic Recycling Industry Revenue (billion) Forecast, by Application 2020 & 2033
- Table 46: France Engineering Plastic Recycling Industry Volume (K Tons) Forecast, by Application 2020 & 2033
- Table 47: Italy Engineering Plastic Recycling Industry Revenue (billion) Forecast, by Application 2020 & 2033
- Table 48: Italy Engineering Plastic Recycling Industry Volume (K Tons) Forecast, by Application 2020 & 2033
- Table 49: Rest of Europe Engineering Plastic Recycling Industry Revenue (billion) Forecast, by Application 2020 & 2033
- Table 50: Rest of Europe Engineering Plastic Recycling Industry Volume (K Tons) Forecast, by Application 2020 & 2033
- Table 51: Global Engineering Plastic Recycling Industry Revenue billion Forecast, by Plastic Type 2020 & 2033
- Table 52: Global Engineering Plastic Recycling Industry Volume K Tons Forecast, by Plastic Type 2020 & 2033
- Table 53: Global Engineering Plastic Recycling Industry Revenue billion Forecast, by End-user Industry 2020 & 2033
- Table 54: Global Engineering Plastic Recycling Industry Volume K Tons Forecast, by End-user Industry 2020 & 2033
- Table 55: Global Engineering Plastic Recycling Industry Revenue billion Forecast, by Country 2020 & 2033
- Table 56: Global Engineering Plastic Recycling Industry Volume K Tons Forecast, by Country 2020 & 2033
- Table 57: South America Engineering Plastic Recycling Industry Revenue (billion) Forecast, by Application 2020 & 2033
- Table 58: South America Engineering Plastic Recycling Industry Volume (K Tons) Forecast, by Application 2020 & 2033
- Table 59: Middle East and Africa Engineering Plastic Recycling Industry Revenue (billion) Forecast, by Application 2020 & 2033
- Table 60: Middle East and Africa Engineering Plastic Recycling Industry Volume (K Tons) Forecast, by Application 2020 & 2033
Frequently Asked Questions
1. What is the projected Compound Annual Growth Rate (CAGR) of the Engineering Plastic Recycling Industry?
The projected CAGR is approximately 8%.
2. Which companies are prominent players in the Engineering Plastic Recycling Industry?
Key companies in the market include REPRO-PET, Placon, Euresi Plastics SL, PolyClean Technologies, Indorama Ventures Public Company Limited, Reliance Industries Limited, Krones AG, Petco, Clean Tech UK Ltd, JFC Group, Far Eastern New Century Corporation (Phoenix Technologies), TEIJIN LIMITED, UltrePET LLC, Alpek S A B de C V, EF Plastics UK Ltd.
3. What are the main segments of the Engineering Plastic Recycling Industry?
The market segments include Plastic Type, End-user Industry.
4. Can you provide details about the market size?
The market size is estimated to be USD 5 billion as of 2022.
5. What are some drivers contributing to market growth?
Growing Emphasis on Sustainability among Consumer and Packaging Products; Increasing Use of Recycled Polyester; Other Drivers.
6. What are the notable trends driving market growth?
Packaging Industry to Dominate the Market.
7. Are there any restraints impacting market growth?
Difficulty in Collecting and Sorting Mixed Plastic; Other Restraints.
8. Can you provide examples of recent developments in the market?
October 2022: Indorama Venturas announced the opening of a PET Value bottle-to-bottle recycling plant in the Philippines in partnership with Coca-Cola Beverages Philippines.
9. What pricing options are available for accessing the report?
Pricing options include single-user, multi-user, and enterprise licenses priced at USD 4750, USD 5250, and USD 8750 respectively.
10. Is the market size provided in terms of value or volume?
The market size is provided in terms of value, measured in billion and volume, measured in K Tons.
11. Are there any specific market keywords associated with the report?
Yes, the market keyword associated with the report is "Engineering Plastic Recycling Industry," which aids in identifying and referencing the specific market segment covered.
12. How do I determine which pricing option suits my needs best?
The pricing options vary based on user requirements and access needs. Individual users may opt for single-user licenses, while businesses requiring broader access may choose multi-user or enterprise licenses for cost-effective access to the report.
13. Are there any additional resources or data provided in the Engineering Plastic Recycling Industry report?
While the report offers comprehensive insights, it's advisable to review the specific contents or supplementary materials provided to ascertain if additional resources or data are available.
14. How can I stay updated on further developments or reports in the Engineering Plastic Recycling Industry?
To stay informed about further developments, trends, and reports in the Engineering Plastic Recycling Industry, consider subscribing to industry newsletters, following relevant companies and organizations, or regularly checking reputable industry news sources and publications.
Methodology
Step 1 - Identification of Relevant Samples Size from Population Database


Step 2 - Approaches for Defining Global Market Size (Value, Volume* & Price*)

Note*: In applicable scenarios
Step 3 - Data Sources
Primary Research
- Web Analytics
- Survey Reports
- Research Institute
- Latest Research Reports
- Opinion Leaders
Secondary Research
- Annual Reports
- White Paper
- Latest Press Release
- Industry Association
- Paid Database
- Investor Presentations

Step 4 - Data Triangulation
Involves using different sources of information in order to increase the validity of a study
These sources are likely to be stakeholders in a program - participants, other researchers, program staff, other community members, and so on.
Then we put all data in single framework & apply various statistical tools to find out the dynamic on the market.
During the analysis stage, feedback from the stakeholder groups would be compared to determine areas of agreement as well as areas of divergence