

Key Insights
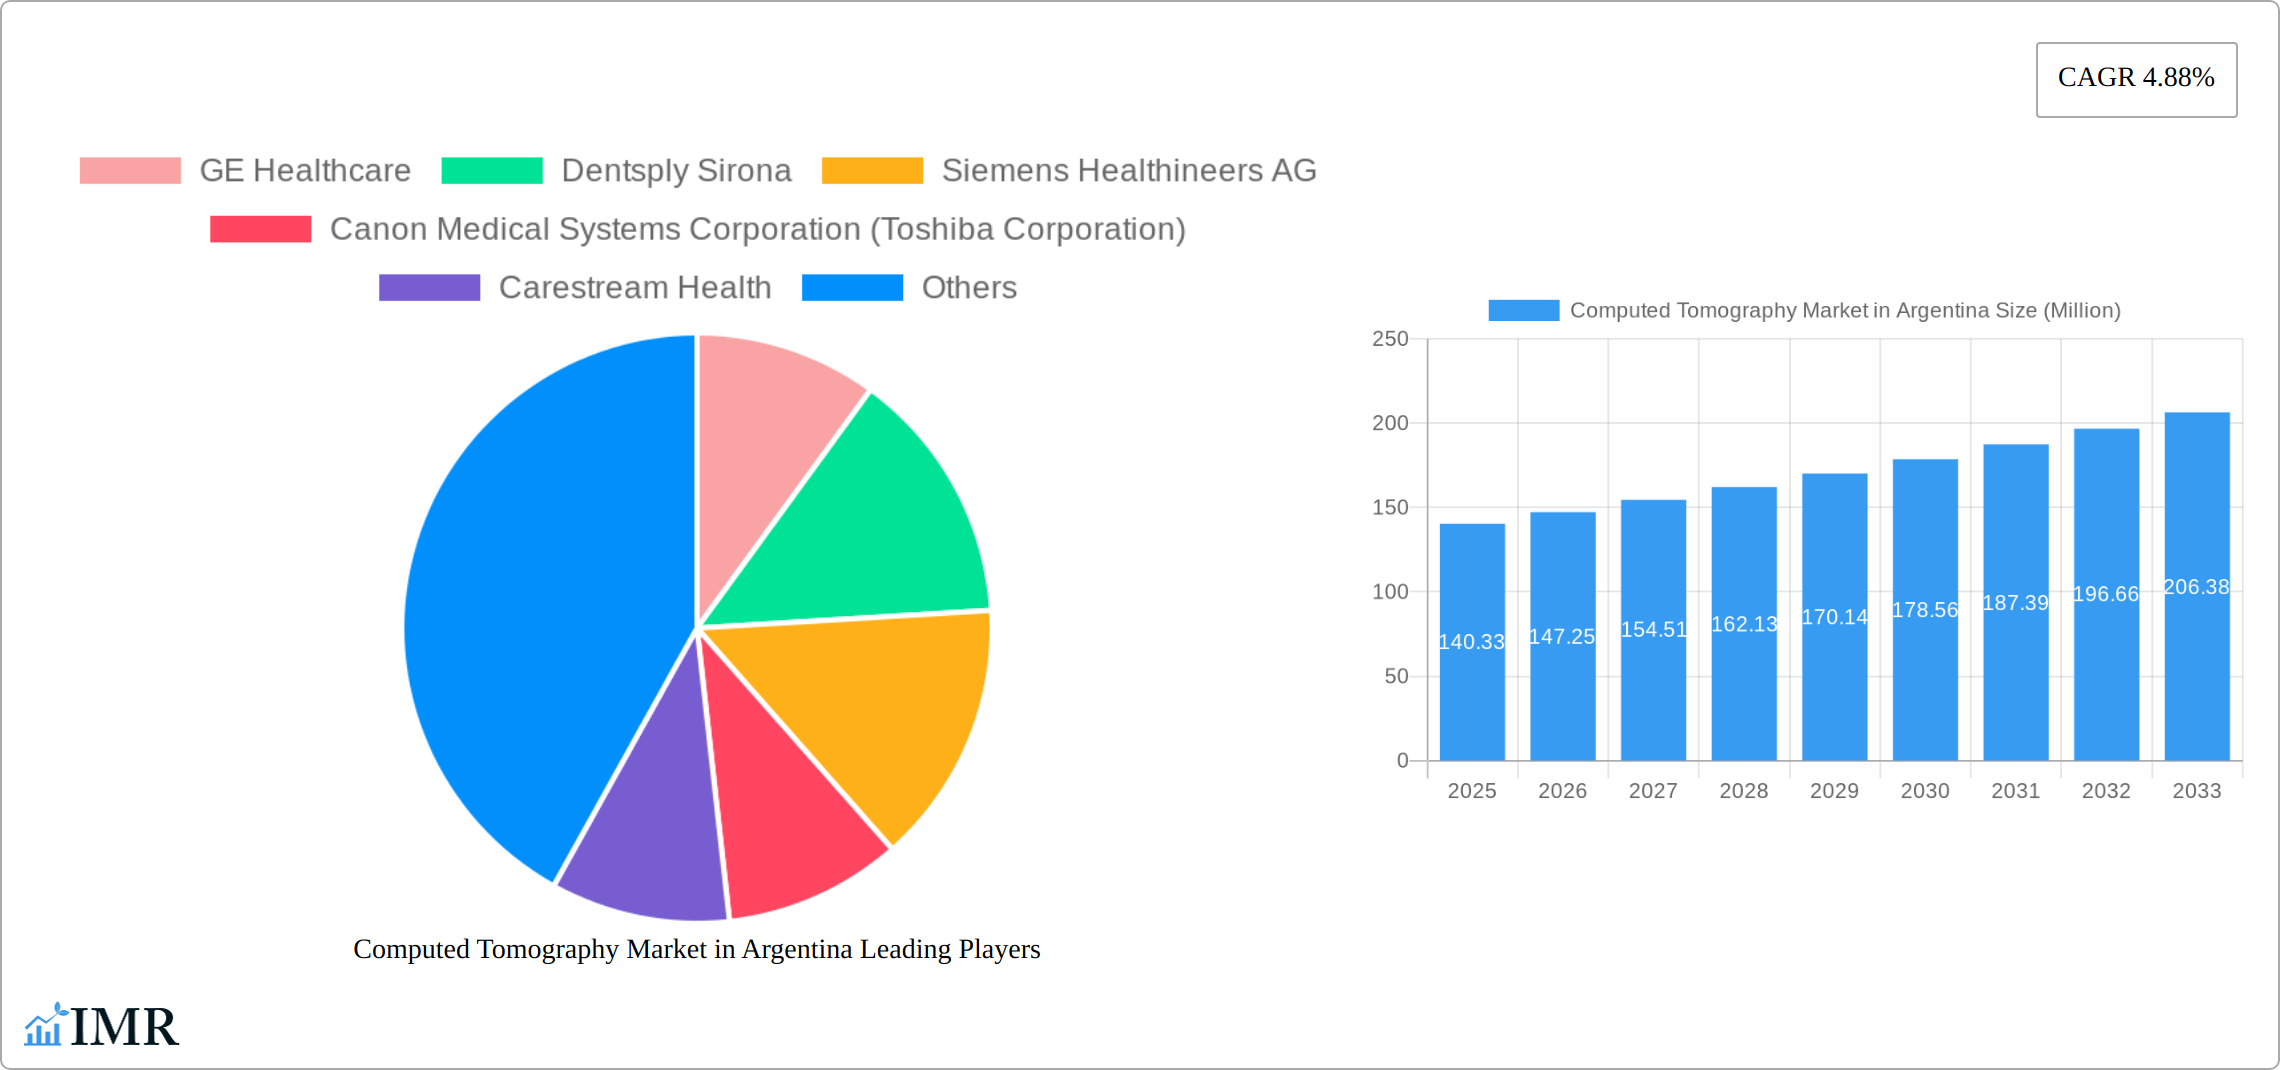
The Argentinian Computed Tomography (CT) market, valued at $140.33 million in 2025, is projected to experience robust growth, driven by factors such as increasing prevalence of chronic diseases (cancer, cardiovascular diseases, neurological disorders), rising geriatric population requiring more frequent scans, and government initiatives to improve healthcare infrastructure. Technological advancements, including the introduction of multi-slice CT scanners with improved image quality and faster scan times, are further fueling market expansion. The market is segmented by end-user (hospitals, diagnostic centers, other end-users), type of CT scanner (low, medium, and high slice), and application (oncology, neurology, cardiovascular, musculoskeletal, and others). Hospitals currently dominate the end-user segment, reflecting the concentration of advanced diagnostic capabilities in these facilities. The high-slice CT scanner segment is anticipated to witness significant growth due to its superior imaging capabilities and diagnostic accuracy. Growth in oncology and cardiovascular applications is expected to be particularly strong, aligned with the rising incidence of related diseases in Argentina.
However, the market faces certain restraints. High costs associated with CT scanners and their maintenance, limited healthcare expenditure in certain regions, and a shortage of trained radiology professionals could impede market growth. Despite these challenges, the increasing adoption of advanced imaging technologies and improving healthcare infrastructure are expected to mitigate these limitations. Key players like GE Healthcare, Dentsply Sirona, Siemens Healthineers AG, Canon Medical Systems Corporation, Carestream Health, Koninklijke Philips NV, and Planmeca Group are actively competing in the Argentinian market, constantly introducing innovative solutions and expanding their market presence through strategic partnerships and collaborations. The forecast period of 2025-2033 presents a significant opportunity for growth, especially as advancements in AI-powered image analysis further enhance diagnostic capabilities and efficiency.
Computed Tomography Market in Argentina: A Comprehensive Report (2019-2033)
This in-depth report provides a comprehensive analysis of the Computed Tomography (CT) market in Argentina, covering market dynamics, growth trends, key players, and future outlook. The report utilizes data from 2019-2024 (Historical Period), with 2025 serving as the Base Year and Estimated Year. The Forecast Period extends from 2025-2033. This detailed analysis is crucial for industry professionals, investors, and healthcare providers seeking to understand and navigate this dynamic market. The report segments the market by End User (Hospitals, Diagnostic Centers, Other End Users), Type (Low Slice, Medium Slice, High Slice), and Application (Oncology, Neurology, Cardiovascular, Musculoskeletal, Other Applications).
Computed Tomography Market in Argentina Market Dynamics & Structure
The Argentinian CT market is characterized by moderate concentration, with key players holding significant market share. Technological advancements, primarily in image quality and speed, are significant drivers. Regulatory frameworks, including those related to medical device approvals and healthcare reimbursements, influence market growth. The market faces competition from alternative imaging technologies, such as MRI and ultrasound, but the increasing demand for faster, higher-resolution imaging continues to fuel CT adoption. End-user demographics, particularly the aging population and rising prevalence of chronic diseases, are key factors. Mergers and acquisitions (M&A) activity remains relatively low, with xx deals recorded in the period 2019-2024, representing a xx% market share consolidation.
- Market Concentration: Moderately concentrated, with top 5 players holding approximately xx% of the market share in 2024.
- Technological Innovation: Driven by advancements in detector technology, image reconstruction algorithms, and AI-powered image analysis.
- Regulatory Landscape: Stable but subject to periodic changes impacting pricing and market access.
- Competitive Substitutes: MRI and ultrasound are primary competitors, but CT maintains advantages in speed and certain applications.
- End-User Demographics: Aging population and rising prevalence of chronic diseases drive demand for CT scans.
- M&A Activity: Low activity during the historical period, with xx deals recorded resulting in xx% market consolidation.
Computed Tomography Market in Argentina Growth Trends & Insights
The Argentinian CT market experienced a Compound Annual Growth Rate (CAGR) of xx% during 2019-2024, reaching a market size of xx million units in 2024. This growth is attributed to increased healthcare spending, technological advancements, and rising prevalence of diseases requiring CT scans. Adoption rates are expected to increase further, driven by government initiatives to improve healthcare infrastructure and a growing awareness of CT's diagnostic capabilities. Market penetration remains relatively low compared to developed nations, indicating significant untapped potential. Technological disruptions, such as the integration of AI and advanced imaging techniques, are expected to further accelerate market growth.

Dominant Regions, Countries, or Segments in Computed Tomography Market in Argentina
Buenos Aires and Cordoba are the leading regions, accounting for approximately xx% of the market in 2024. Within the segmentation, Hospitals represent the largest end-user segment (xx%), followed by Diagnostic Centers (xx%). High-slice CT scanners dominate the type segment (xx%), driven by their superior image quality and speed. Oncology and Cardiovascular applications are the leading application segments, representing xx% and xx% of the total market respectively.
- Key Drivers: Increased healthcare spending, government initiatives to modernize healthcare infrastructure, rising prevalence of chronic diseases.
- Dominance Factors: Concentration of healthcare facilities in Buenos Aires and Cordoba, high demand for advanced imaging techniques in major cities.
- Growth Potential: Significant potential for growth in smaller cities and provinces, driven by increased access to healthcare and technology.
Computed Tomography Market in Argentina Product Landscape
The Argentinian CT market showcases a range of products, from low-slice to high-slice scanners with varying levels of technological sophistication. Recent innovations include improved detector technology leading to faster scan times and better image resolution, as well as AI-powered image analysis software enhancing diagnostic accuracy. Key selling propositions revolve around image quality, speed, ease of use, and integration with existing hospital information systems.
Key Drivers, Barriers & Challenges in Computed Tomography Market in Argentina
Key Drivers: Rising prevalence of chronic diseases, government investments in healthcare infrastructure, technological advancements improving image quality and speed.
Key Challenges: High cost of equipment, limited reimbursement coverage in certain segments, economic fluctuations impacting healthcare spending, and potential supply chain disruptions.
Emerging Opportunities in Computed Tomography Market in Argentina
Emerging opportunities lie in expanding access to CT services in underserved areas, increased adoption of AI-powered image analysis, and the development of specialized CT applications catering to specific disease areas. The focus on preventive healthcare and early disease detection presents significant potential for market growth.
Growth Accelerators in the Computed Tomography Market in Argentina Industry
Technological breakthroughs, specifically in AI and advanced imaging techniques, represent significant growth catalysts. Strategic partnerships between equipment manufacturers, healthcare providers, and government agencies are also crucial in driving market expansion. Increasing awareness of CT’s diagnostic capabilities among healthcare professionals further fuels market growth.
Key Players Shaping the Computed Tomography Market in Argentina Market
- GE Healthcare https://www.gehealthcare.com/
- Dentsply Sirona https://www.dentsplysirona.com/
- Siemens Healthineers AG https://www.siemens-healthineers.com/
- Canon Medical Systems Corporation (Toshiba Corporation) https://www.canon-medical.com/
- Carestream Health https://www.carestream.com/
- Koninklijke Philips NV https://www.philips.com/
- Planmeca Group (Planmed OY) https://www.planmeca.com/
Notable Milestones in Computed Tomography Market in Argentina Sector
- January 2021: Konica Minolta Healthcare Americas Inc. and AGIMED deployed imaging management solutions in Córdoba.
- November 2020: Agfa Radiology Solutions Argentina installed a DR 600 CT system at Imágenes Jaraba Medical Center.
In-Depth Computed Tomography Market in Argentina Market Outlook
The Argentinian CT market is poised for significant growth over the forecast period, driven by technological advancements, increasing healthcare spending, and the rising prevalence of chronic diseases. Strategic partnerships and investments in healthcare infrastructure will further accelerate market expansion. The continued adoption of high-slice CT scanners and AI-powered image analysis solutions will shape the future of the market. Opportunities exist in expanding access to CT services in underserved regions and developing innovative applications tailored to specific clinical needs.
Computed Tomography Market in Argentina Segmentation
-
1. Type
- 1.1. Low Slice
- 1.2. Medium Slice
- 1.3. High Slice
-
2. Application
- 2.1. Oncology
- 2.2. Neurology
- 2.3. Cardiovascular
- 2.4. Musculoskeletal
- 2.5. Other Applications
-
3. End User
- 3.1. Hospitals
- 3.2. Diagnostic Centers
- 3.3. Other End Users
Computed Tomography Market in Argentina Segmentation By Geography
-
1. North America
- 1.1. United States
- 1.2. Canada
- 1.3. Mexico
-
2. South America
- 2.1. Brazil
- 2.2. Argentina
- 2.3. Rest of South America
-
3. Europe
- 3.1. United Kingdom
- 3.2. Germany
- 3.3. France
- 3.4. Italy
- 3.5. Spain
- 3.6. Russia
- 3.7. Benelux
- 3.8. Nordics
- 3.9. Rest of Europe
-
4. Middle East & Africa
- 4.1. Turkey
- 4.2. Israel
- 4.3. GCC
- 4.4. North Africa
- 4.5. South Africa
- 4.6. Rest of Middle East & Africa
-
5. Asia Pacific
- 5.1. China
- 5.2. India
- 5.3. Japan
- 5.4. South Korea
- 5.5. ASEAN
- 5.6. Oceania
- 5.7. Rest of Asia Pacific

Computed Tomography Market in Argentina REPORT HIGHLIGHTS
| Aspects | Details |
|---|---|
| Study Period | 2019-2033 |
| Base Year | 2024 |
| Estimated Year | 2025 |
| Forecast Period | 2025-2033 |
| Historical Period | 2019-2024 |
| Growth Rate | CAGR of 4.88% from 2019-2033 |
| Segmentation |
|
Table of Contents
- 1. Introduction
- 1.1. Research Scope
- 1.2. Market Segmentation
- 1.3. Research Methodology
- 1.4. Definitions and Assumptions
- 2. Executive Summary
- 2.1. Introduction
- 3. Market Dynamics
- 3.1. Introduction
- 3.2. Market Drivers
- 3.2.1. Increasing Prevalence of Chronic Diseases; Rising Geriatric Population; Increasing Technological Advancements
- 3.3. Market Restrains
- 3.3.1. Lack Of Proper Reimbursement And Stringent Regulatory Approval Procedures; High Cost of Equipment
- 3.4. Market Trends
- 3.4.1. Medium Slice Segment is Expected to Hold a Significant Market Share Over the Forecast Period
- 4. Market Factor Analysis
- 4.1. Porters Five Forces
- 4.2. Supply/Value Chain
- 4.3. PESTEL analysis
- 4.4. Market Entropy
- 4.5. Patent/Trademark Analysis
- 5. Global Computed Tomography Market in Argentina Analysis, Insights and Forecast, 2019-2031
- 5.1. Market Analysis, Insights and Forecast - by Type
- 5.1.1. Low Slice
- 5.1.2. Medium Slice
- 5.1.3. High Slice
- 5.2. Market Analysis, Insights and Forecast - by Application
- 5.2.1. Oncology
- 5.2.2. Neurology
- 5.2.3. Cardiovascular
- 5.2.4. Musculoskeletal
- 5.2.5. Other Applications
- 5.3. Market Analysis, Insights and Forecast - by End User
- 5.3.1. Hospitals
- 5.3.2. Diagnostic Centers
- 5.3.3. Other End Users
- 5.4. Market Analysis, Insights and Forecast - by Region
- 5.4.1. North America
- 5.4.2. South America
- 5.4.3. Europe
- 5.4.4. Middle East & Africa
- 5.4.5. Asia Pacific
- 5.1. Market Analysis, Insights and Forecast - by Type
- 6. North America Computed Tomography Market in Argentina Analysis, Insights and Forecast, 2019-2031
- 6.1. Market Analysis, Insights and Forecast - by Type
- 6.1.1. Low Slice
- 6.1.2. Medium Slice
- 6.1.3. High Slice
- 6.2. Market Analysis, Insights and Forecast - by Application
- 6.2.1. Oncology
- 6.2.2. Neurology
- 6.2.3. Cardiovascular
- 6.2.4. Musculoskeletal
- 6.2.5. Other Applications
- 6.3. Market Analysis, Insights and Forecast - by End User
- 6.3.1. Hospitals
- 6.3.2. Diagnostic Centers
- 6.3.3. Other End Users
- 6.1. Market Analysis, Insights and Forecast - by Type
- 7. South America Computed Tomography Market in Argentina Analysis, Insights and Forecast, 2019-2031
- 7.1. Market Analysis, Insights and Forecast - by Type
- 7.1.1. Low Slice
- 7.1.2. Medium Slice
- 7.1.3. High Slice
- 7.2. Market Analysis, Insights and Forecast - by Application
- 7.2.1. Oncology
- 7.2.2. Neurology
- 7.2.3. Cardiovascular
- 7.2.4. Musculoskeletal
- 7.2.5. Other Applications
- 7.3. Market Analysis, Insights and Forecast - by End User
- 7.3.1. Hospitals
- 7.3.2. Diagnostic Centers
- 7.3.3. Other End Users
- 7.1. Market Analysis, Insights and Forecast - by Type
- 8. Europe Computed Tomography Market in Argentina Analysis, Insights and Forecast, 2019-2031
- 8.1. Market Analysis, Insights and Forecast - by Type
- 8.1.1. Low Slice
- 8.1.2. Medium Slice
- 8.1.3. High Slice
- 8.2. Market Analysis, Insights and Forecast - by Application
- 8.2.1. Oncology
- 8.2.2. Neurology
- 8.2.3. Cardiovascular
- 8.2.4. Musculoskeletal
- 8.2.5. Other Applications
- 8.3. Market Analysis, Insights and Forecast - by End User
- 8.3.1. Hospitals
- 8.3.2. Diagnostic Centers
- 8.3.3. Other End Users
- 8.1. Market Analysis, Insights and Forecast - by Type
- 9. Middle East & Africa Computed Tomography Market in Argentina Analysis, Insights and Forecast, 2019-2031
- 9.1. Market Analysis, Insights and Forecast - by Type
- 9.1.1. Low Slice
- 9.1.2. Medium Slice
- 9.1.3. High Slice
- 9.2. Market Analysis, Insights and Forecast - by Application
- 9.2.1. Oncology
- 9.2.2. Neurology
- 9.2.3. Cardiovascular
- 9.2.4. Musculoskeletal
- 9.2.5. Other Applications
- 9.3. Market Analysis, Insights and Forecast - by End User
- 9.3.1. Hospitals
- 9.3.2. Diagnostic Centers
- 9.3.3. Other End Users
- 9.1. Market Analysis, Insights and Forecast - by Type
- 10. Asia Pacific Computed Tomography Market in Argentina Analysis, Insights and Forecast, 2019-2031
- 10.1. Market Analysis, Insights and Forecast - by Type
- 10.1.1. Low Slice
- 10.1.2. Medium Slice
- 10.1.3. High Slice
- 10.2. Market Analysis, Insights and Forecast - by Application
- 10.2.1. Oncology
- 10.2.2. Neurology
- 10.2.3. Cardiovascular
- 10.2.4. Musculoskeletal
- 10.2.5. Other Applications
- 10.3. Market Analysis, Insights and Forecast - by End User
- 10.3.1. Hospitals
- 10.3.2. Diagnostic Centers
- 10.3.3. Other End Users
- 10.1. Market Analysis, Insights and Forecast - by Type
- 11. Competitive Analysis
- 11.1. Global Market Share Analysis 2024
- 11.2. Company Profiles
- 11.2.1 GE Healthcare
- 11.2.1.1. Overview
- 11.2.1.2. Products
- 11.2.1.3. SWOT Analysis
- 11.2.1.4. Recent Developments
- 11.2.1.5. Financials (Based on Availability)
- 11.2.2 Dentsply Sirona
- 11.2.2.1. Overview
- 11.2.2.2. Products
- 11.2.2.3. SWOT Analysis
- 11.2.2.4. Recent Developments
- 11.2.2.5. Financials (Based on Availability)
- 11.2.3 Siemens Healthineers AG
- 11.2.3.1. Overview
- 11.2.3.2. Products
- 11.2.3.3. SWOT Analysis
- 11.2.3.4. Recent Developments
- 11.2.3.5. Financials (Based on Availability)
- 11.2.4 Canon Medical Systems Corporation (Toshiba Corporation)
- 11.2.4.1. Overview
- 11.2.4.2. Products
- 11.2.4.3. SWOT Analysis
- 11.2.4.4. Recent Developments
- 11.2.4.5. Financials (Based on Availability)
- 11.2.5 Carestream Health
- 11.2.5.1. Overview
- 11.2.5.2. Products
- 11.2.5.3. SWOT Analysis
- 11.2.5.4. Recent Developments
- 11.2.5.5. Financials (Based on Availability)
- 11.2.6 Koninklijke Philips NV
- 11.2.6.1. Overview
- 11.2.6.2. Products
- 11.2.6.3. SWOT Analysis
- 11.2.6.4. Recent Developments
- 11.2.6.5. Financials (Based on Availability)
- 11.2.7 Planmeca Group (Planmed OY)
- 11.2.7.1. Overview
- 11.2.7.2. Products
- 11.2.7.3. SWOT Analysis
- 11.2.7.4. Recent Developments
- 11.2.7.5. Financials (Based on Availability)
- 11.2.1 GE Healthcare
List of Figures
- Figure 1: Global Computed Tomography Market in Argentina Revenue Breakdown (Million, %) by Region 2024 & 2032
- Figure 2: Argentina Computed Tomography Market in Argentina Revenue (Million), by Country 2024 & 2032
- Figure 3: Argentina Computed Tomography Market in Argentina Revenue Share (%), by Country 2024 & 2032
- Figure 4: North America Computed Tomography Market in Argentina Revenue (Million), by Type 2024 & 2032
- Figure 5: North America Computed Tomography Market in Argentina Revenue Share (%), by Type 2024 & 2032
- Figure 6: North America Computed Tomography Market in Argentina Revenue (Million), by Application 2024 & 2032
- Figure 7: North America Computed Tomography Market in Argentina Revenue Share (%), by Application 2024 & 2032
- Figure 8: North America Computed Tomography Market in Argentina Revenue (Million), by End User 2024 & 2032
- Figure 9: North America Computed Tomography Market in Argentina Revenue Share (%), by End User 2024 & 2032
- Figure 10: North America Computed Tomography Market in Argentina Revenue (Million), by Country 2024 & 2032
- Figure 11: North America Computed Tomography Market in Argentina Revenue Share (%), by Country 2024 & 2032
- Figure 12: South America Computed Tomography Market in Argentina Revenue (Million), by Type 2024 & 2032
- Figure 13: South America Computed Tomography Market in Argentina Revenue Share (%), by Type 2024 & 2032
- Figure 14: South America Computed Tomography Market in Argentina Revenue (Million), by Application 2024 & 2032
- Figure 15: South America Computed Tomography Market in Argentina Revenue Share (%), by Application 2024 & 2032
- Figure 16: South America Computed Tomography Market in Argentina Revenue (Million), by End User 2024 & 2032
- Figure 17: South America Computed Tomography Market in Argentina Revenue Share (%), by End User 2024 & 2032
- Figure 18: South America Computed Tomography Market in Argentina Revenue (Million), by Country 2024 & 2032
- Figure 19: South America Computed Tomography Market in Argentina Revenue Share (%), by Country 2024 & 2032
- Figure 20: Europe Computed Tomography Market in Argentina Revenue (Million), by Type 2024 & 2032
- Figure 21: Europe Computed Tomography Market in Argentina Revenue Share (%), by Type 2024 & 2032
- Figure 22: Europe Computed Tomography Market in Argentina Revenue (Million), by Application 2024 & 2032
- Figure 23: Europe Computed Tomography Market in Argentina Revenue Share (%), by Application 2024 & 2032
- Figure 24: Europe Computed Tomography Market in Argentina Revenue (Million), by End User 2024 & 2032
- Figure 25: Europe Computed Tomography Market in Argentina Revenue Share (%), by End User 2024 & 2032
- Figure 26: Europe Computed Tomography Market in Argentina Revenue (Million), by Country 2024 & 2032
- Figure 27: Europe Computed Tomography Market in Argentina Revenue Share (%), by Country 2024 & 2032
- Figure 28: Middle East & Africa Computed Tomography Market in Argentina Revenue (Million), by Type 2024 & 2032
- Figure 29: Middle East & Africa Computed Tomography Market in Argentina Revenue Share (%), by Type 2024 & 2032
- Figure 30: Middle East & Africa Computed Tomography Market in Argentina Revenue (Million), by Application 2024 & 2032
- Figure 31: Middle East & Africa Computed Tomography Market in Argentina Revenue Share (%), by Application 2024 & 2032
- Figure 32: Middle East & Africa Computed Tomography Market in Argentina Revenue (Million), by End User 2024 & 2032
- Figure 33: Middle East & Africa Computed Tomography Market in Argentina Revenue Share (%), by End User 2024 & 2032
- Figure 34: Middle East & Africa Computed Tomography Market in Argentina Revenue (Million), by Country 2024 & 2032
- Figure 35: Middle East & Africa Computed Tomography Market in Argentina Revenue Share (%), by Country 2024 & 2032
- Figure 36: Asia Pacific Computed Tomography Market in Argentina Revenue (Million), by Type 2024 & 2032
- Figure 37: Asia Pacific Computed Tomography Market in Argentina Revenue Share (%), by Type 2024 & 2032
- Figure 38: Asia Pacific Computed Tomography Market in Argentina Revenue (Million), by Application 2024 & 2032
- Figure 39: Asia Pacific Computed Tomography Market in Argentina Revenue Share (%), by Application 2024 & 2032
- Figure 40: Asia Pacific Computed Tomography Market in Argentina Revenue (Million), by End User 2024 & 2032
- Figure 41: Asia Pacific Computed Tomography Market in Argentina Revenue Share (%), by End User 2024 & 2032
- Figure 42: Asia Pacific Computed Tomography Market in Argentina Revenue (Million), by Country 2024 & 2032
- Figure 43: Asia Pacific Computed Tomography Market in Argentina Revenue Share (%), by Country 2024 & 2032
List of Tables
- Table 1: Global Computed Tomography Market in Argentina Revenue Million Forecast, by Region 2019 & 2032
- Table 2: Global Computed Tomography Market in Argentina Revenue Million Forecast, by Type 2019 & 2032
- Table 3: Global Computed Tomography Market in Argentina Revenue Million Forecast, by Application 2019 & 2032
- Table 4: Global Computed Tomography Market in Argentina Revenue Million Forecast, by End User 2019 & 2032
- Table 5: Global Computed Tomography Market in Argentina Revenue Million Forecast, by Region 2019 & 2032
- Table 6: Global Computed Tomography Market in Argentina Revenue Million Forecast, by Country 2019 & 2032
- Table 7: Global Computed Tomography Market in Argentina Revenue Million Forecast, by Type 2019 & 2032
- Table 8: Global Computed Tomography Market in Argentina Revenue Million Forecast, by Application 2019 & 2032
- Table 9: Global Computed Tomography Market in Argentina Revenue Million Forecast, by End User 2019 & 2032
- Table 10: Global Computed Tomography Market in Argentina Revenue Million Forecast, by Country 2019 & 2032
- Table 11: United States Computed Tomography Market in Argentina Revenue (Million) Forecast, by Application 2019 & 2032
- Table 12: Canada Computed Tomography Market in Argentina Revenue (Million) Forecast, by Application 2019 & 2032
- Table 13: Mexico Computed Tomography Market in Argentina Revenue (Million) Forecast, by Application 2019 & 2032
- Table 14: Global Computed Tomography Market in Argentina Revenue Million Forecast, by Type 2019 & 2032
- Table 15: Global Computed Tomography Market in Argentina Revenue Million Forecast, by Application 2019 & 2032
- Table 16: Global Computed Tomography Market in Argentina Revenue Million Forecast, by End User 2019 & 2032
- Table 17: Global Computed Tomography Market in Argentina Revenue Million Forecast, by Country 2019 & 2032
- Table 18: Brazil Computed Tomography Market in Argentina Revenue (Million) Forecast, by Application 2019 & 2032
- Table 19: Argentina Computed Tomography Market in Argentina Revenue (Million) Forecast, by Application 2019 & 2032
- Table 20: Rest of South America Computed Tomography Market in Argentina Revenue (Million) Forecast, by Application 2019 & 2032
- Table 21: Global Computed Tomography Market in Argentina Revenue Million Forecast, by Type 2019 & 2032
- Table 22: Global Computed Tomography Market in Argentina Revenue Million Forecast, by Application 2019 & 2032
- Table 23: Global Computed Tomography Market in Argentina Revenue Million Forecast, by End User 2019 & 2032
- Table 24: Global Computed Tomography Market in Argentina Revenue Million Forecast, by Country 2019 & 2032
- Table 25: United Kingdom Computed Tomography Market in Argentina Revenue (Million) Forecast, by Application 2019 & 2032
- Table 26: Germany Computed Tomography Market in Argentina Revenue (Million) Forecast, by Application 2019 & 2032
- Table 27: France Computed Tomography Market in Argentina Revenue (Million) Forecast, by Application 2019 & 2032
- Table 28: Italy Computed Tomography Market in Argentina Revenue (Million) Forecast, by Application 2019 & 2032
- Table 29: Spain Computed Tomography Market in Argentina Revenue (Million) Forecast, by Application 2019 & 2032
- Table 30: Russia Computed Tomography Market in Argentina Revenue (Million) Forecast, by Application 2019 & 2032
- Table 31: Benelux Computed Tomography Market in Argentina Revenue (Million) Forecast, by Application 2019 & 2032
- Table 32: Nordics Computed Tomography Market in Argentina Revenue (Million) Forecast, by Application 2019 & 2032
- Table 33: Rest of Europe Computed Tomography Market in Argentina Revenue (Million) Forecast, by Application 2019 & 2032
- Table 34: Global Computed Tomography Market in Argentina Revenue Million Forecast, by Type 2019 & 2032
- Table 35: Global Computed Tomography Market in Argentina Revenue Million Forecast, by Application 2019 & 2032
- Table 36: Global Computed Tomography Market in Argentina Revenue Million Forecast, by End User 2019 & 2032
- Table 37: Global Computed Tomography Market in Argentina Revenue Million Forecast, by Country 2019 & 2032
- Table 38: Turkey Computed Tomography Market in Argentina Revenue (Million) Forecast, by Application 2019 & 2032
- Table 39: Israel Computed Tomography Market in Argentina Revenue (Million) Forecast, by Application 2019 & 2032
- Table 40: GCC Computed Tomography Market in Argentina Revenue (Million) Forecast, by Application 2019 & 2032
- Table 41: North Africa Computed Tomography Market in Argentina Revenue (Million) Forecast, by Application 2019 & 2032
- Table 42: South Africa Computed Tomography Market in Argentina Revenue (Million) Forecast, by Application 2019 & 2032
- Table 43: Rest of Middle East & Africa Computed Tomography Market in Argentina Revenue (Million) Forecast, by Application 2019 & 2032
- Table 44: Global Computed Tomography Market in Argentina Revenue Million Forecast, by Type 2019 & 2032
- Table 45: Global Computed Tomography Market in Argentina Revenue Million Forecast, by Application 2019 & 2032
- Table 46: Global Computed Tomography Market in Argentina Revenue Million Forecast, by End User 2019 & 2032
- Table 47: Global Computed Tomography Market in Argentina Revenue Million Forecast, by Country 2019 & 2032
- Table 48: China Computed Tomography Market in Argentina Revenue (Million) Forecast, by Application 2019 & 2032
- Table 49: India Computed Tomography Market in Argentina Revenue (Million) Forecast, by Application 2019 & 2032
- Table 50: Japan Computed Tomography Market in Argentina Revenue (Million) Forecast, by Application 2019 & 2032
- Table 51: South Korea Computed Tomography Market in Argentina Revenue (Million) Forecast, by Application 2019 & 2032
- Table 52: ASEAN Computed Tomography Market in Argentina Revenue (Million) Forecast, by Application 2019 & 2032
- Table 53: Oceania Computed Tomography Market in Argentina Revenue (Million) Forecast, by Application 2019 & 2032
- Table 54: Rest of Asia Pacific Computed Tomography Market in Argentina Revenue (Million) Forecast, by Application 2019 & 2032
Frequently Asked Questions
1. What is the projected Compound Annual Growth Rate (CAGR) of the Computed Tomography Market in Argentina?
The projected CAGR is approximately 4.88%.
2. Which companies are prominent players in the Computed Tomography Market in Argentina?
Key companies in the market include GE Healthcare, Dentsply Sirona, Siemens Healthineers AG, Canon Medical Systems Corporation (Toshiba Corporation), Carestream Health, Koninklijke Philips NV, Planmeca Group (Planmed OY).
3. What are the main segments of the Computed Tomography Market in Argentina?
The market segments include Type, Application, End User.
4. Can you provide details about the market size?
The market size is estimated to be USD 140.33 Million as of 2022.
5. What are some drivers contributing to market growth?
Increasing Prevalence of Chronic Diseases; Rising Geriatric Population; Increasing Technological Advancements.
6. What are the notable trends driving market growth?
Medium Slice Segment is Expected to Hold a Significant Market Share Over the Forecast Period.
7. Are there any restraints impacting market growth?
Lack Of Proper Reimbursement And Stringent Regulatory Approval Procedures; High Cost of Equipment.
8. Can you provide examples of recent developments in the market?
In January 2021, in Córdoba, Argentina's primary public health hospital system, Konica Minolta Healthcare Americas Inc. and its strategic partner AGIMED, a healthcare provider, deployed Konica Minolta imaging management solutions.
9. What pricing options are available for accessing the report?
Pricing options include single-user, multi-user, and enterprise licenses priced at USD 3800, USD 4500, and USD 5800 respectively.
10. Is the market size provided in terms of value or volume?
The market size is provided in terms of value, measured in Million.
11. Are there any specific market keywords associated with the report?
Yes, the market keyword associated with the report is "Computed Tomography Market in Argentina," which aids in identifying and referencing the specific market segment covered.
12. How do I determine which pricing option suits my needs best?
The pricing options vary based on user requirements and access needs. Individual users may opt for single-user licenses, while businesses requiring broader access may choose multi-user or enterprise licenses for cost-effective access to the report.
13. Are there any additional resources or data provided in the Computed Tomography Market in Argentina report?
While the report offers comprehensive insights, it's advisable to review the specific contents or supplementary materials provided to ascertain if additional resources or data are available.
14. How can I stay updated on further developments or reports in the Computed Tomography Market in Argentina?
To stay informed about further developments, trends, and reports in the Computed Tomography Market in Argentina, consider subscribing to industry newsletters, following relevant companies and organizations, or regularly checking reputable industry news sources and publications.
Methodology
Step 1 - Identification of Relevant Samples Size from Population Database


Step 2 - Approaches for Defining Global Market Size (Value, Volume* & Price*)

Note*: In applicable scenarios
Step 3 - Data Sources
Primary Research
- Web Analytics
- Survey Reports
- Research Institute
- Latest Research Reports
- Opinion Leaders
Secondary Research
- Annual Reports
- White Paper
- Latest Press Release
- Industry Association
- Paid Database
- Investor Presentations

Step 4 - Data Triangulation
Involves using different sources of information in order to increase the validity of a study
These sources are likely to be stakeholders in a program - participants, other researchers, program staff, other community members, and so on.
Then we put all data in single framework & apply various statistical tools to find out the dynamic on the market.
During the analysis stage, feedback from the stakeholder groups would be compared to determine areas of agreement as well as areas of divergence
