

Key Insights
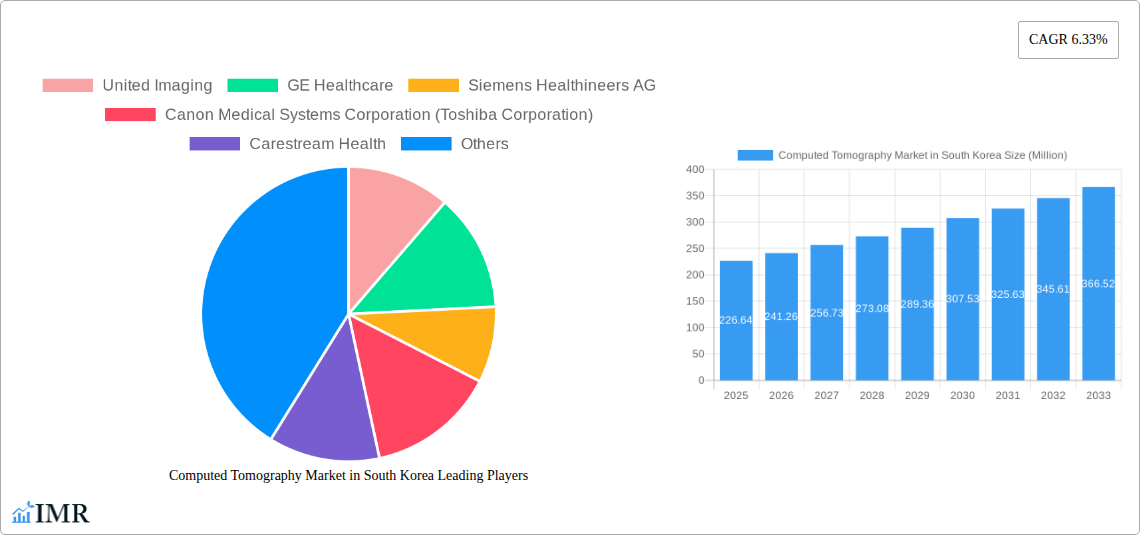
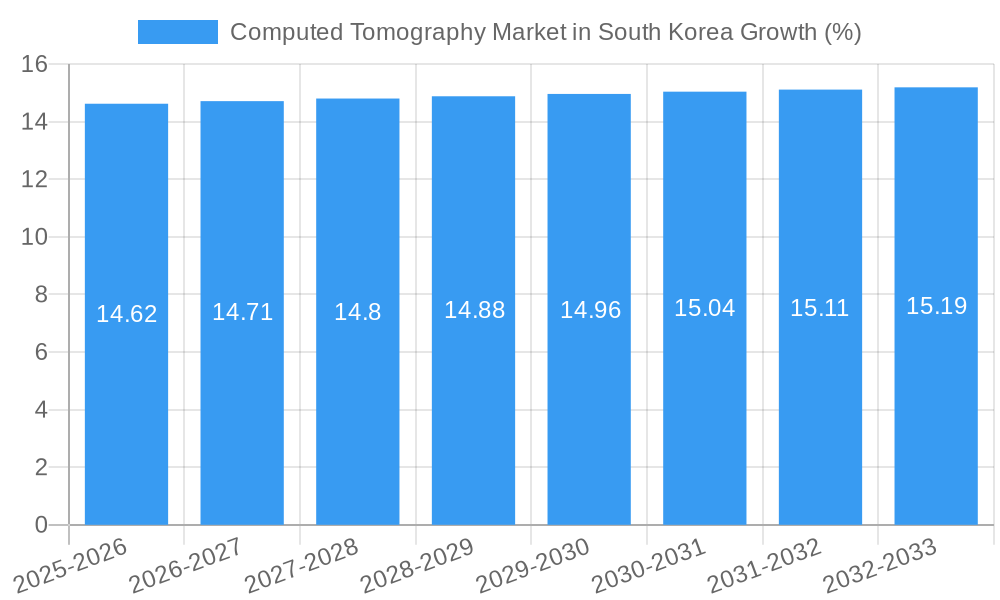
The South Korean computed tomography (CT) market, valued at $226.64 million in 2025, is projected to experience robust growth, driven by a rising prevalence of chronic diseases necessitating advanced diagnostic imaging, increasing healthcare expenditure, and technological advancements leading to improved image quality and faster scan times. The market's compound annual growth rate (CAGR) of 6.33% from 2025 to 2033 indicates a significant expansion over the forecast period. This growth is further fueled by the increasing adoption of multi-slice CT scanners offering enhanced capabilities and higher resolution images, particularly within the oncology, neurology, and cardiovascular segments. The high slice segment is likely to dominate due to its superior imaging capabilities and clinical benefits. Hospitals and diagnostic centers represent the major end-users, contributing significantly to market revenue. However, challenges remain, including the high cost of CT scanners and associated maintenance, potentially hindering market penetration in smaller clinics. Furthermore, the increasing emphasis on radiation safety and the development of alternative imaging modalities could slightly restrain market growth in the long term. Key players such as United Imaging, GE Healthcare, and Siemens Healthineers are actively engaged in competitive strategies including product innovation and strategic partnerships to maintain their market positions within this dynamic landscape.
The consistent growth trajectory is primarily attributed to South Korea's well-established healthcare infrastructure and its proactive approach to disease prevention and management. Technological improvements and the introduction of AI-powered image analysis tools enhance diagnostic accuracy and workflow efficiency, making CT scans even more appealing to healthcare providers. Further market segmentation reveals substantial growth potential within the Musculoskeletal application area as the aging population in South Korea increases the demand for accurate and timely diagnosis of bone and joint conditions. The continued expansion of private healthcare facilities also provides additional growth opportunities for CT market participants. Therefore, the South Korean CT market offers promising investment prospects for industry players willing to adapt to the changing market dynamics and consumer preferences.
Computed Tomography Market in South Korea: A Comprehensive Market Report (2019-2033)
This comprehensive report provides a detailed analysis of the Computed Tomography (CT) market in South Korea, offering invaluable insights for industry professionals, investors, and strategic decision-makers. The report covers the period from 2019 to 2033, with 2025 serving as the base and estimated year. It segments the market by type (Low Slice, Medium Slice, High Slice), application (Oncology, Neurology, Cardiovascular, Musculoskeletal, Other Applications), and end-user (Hospitals, Diagnostic Centers, Other End Users). The report also examines key players like United Imaging, GE Healthcare, Siemens Healthineers AG, Canon Medical Systems Corporation (Toshiba Corporation), Carestream Health, Koninklijke Philips NV, and Planmeca Group (Planmed OY), analyzing their market strategies and contributions to market growth. The South Korean CT market is expected to reach xx Million units by 2033, presenting significant opportunities for growth and investment.
Computed Tomography Market in South Korea Market Dynamics & Structure
The South Korean CT market is characterized by a moderately concentrated competitive landscape, with key players vying for market share through technological advancements and strategic partnerships. The market is driven by increasing prevalence of chronic diseases, rising healthcare expenditure, and government initiatives promoting advanced medical technologies. However, high equipment costs and stringent regulatory approvals pose challenges to market expansion.
- Market Concentration: The top five players hold an estimated 70% market share in 2025.
- Technological Innovation: Continuous improvements in image quality, speed, and radiation dose reduction drive market growth.
- Regulatory Framework: Stringent regulatory approvals by the Ministry of Food and Drug Safety (MFDS) influence market entry and product adoption.
- Competitive Substitutes: Magnetic Resonance Imaging (MRI) and Ultrasound imaging present competitive alternatives.
- End-User Demographics: The aging population and rising incidence of cancer contribute to increased CT scan demand.
- M&A Trends: Consolidation among players is expected to continue, driven by the need for economies of scale and technological expertise. An estimated xx M&A deals are predicted between 2025 and 2033.
Computed Tomography Market in South Korea Growth Trends & Insights
The South Korean CT market experienced robust growth during the historical period (2019-2024), driven primarily by factors such as increasing healthcare expenditure, technological advancements leading to improved image quality and reduced radiation dose, and government initiatives aimed at strengthening the healthcare infrastructure. The market is projected to maintain a healthy Compound Annual Growth Rate (CAGR) of xx% during the forecast period (2025-2033). This growth is attributable to several factors, including: The rising prevalence of chronic diseases like cancer, cardiovascular diseases, and neurological disorders fuels the demand for accurate and timely diagnosis provided by CT scans. Technological advancements such as multi-slice CT and dual-energy CT are improving image quality and diagnostic capabilities, thereby boosting market adoption. Government initiatives and investments in modernizing healthcare infrastructure are further strengthening the market's growth trajectory. Furthermore, the increasing adoption of advanced imaging techniques in various applications, including oncology, cardiology, and neurology, is expected to drive market expansion over the forecast period. The market penetration of CT scanners in South Korea is estimated at xx% in 2025, projected to reach xx% by 2033.
Dominant Regions, Countries, or Segments in Computed Tomography Market in South Korea
Seoul and other major metropolitan areas dominate the South Korean CT market due to higher concentration of hospitals and diagnostic centers, advanced healthcare infrastructure and higher disposable income. Within the market segments, High Slice CT systems are projected to dominate due to their superior image quality and faster scanning speed. Oncology applications account for a significant share of the market due to the increasing prevalence of cancer.
- Key Drivers:
- Strong government support for healthcare infrastructure development.
- High prevalence of chronic diseases.
- Growing preference for advanced imaging modalities.
- Dominant Segments:
- Type: High Slice CT systems hold the largest market share, driven by their superior imaging capabilities.
- Application: Oncology is the leading application segment due to the rising incidence of cancer.
- End-User: Hospitals represent the largest segment due to their comprehensive diagnostic services.
Computed Tomography Market in South Korea Product Landscape
The South Korean CT market offers a diverse range of products, including low-slice, medium-slice, and high-slice CT scanners from various global and domestic manufacturers. These systems are differentiated based on features such as slice count, image quality, speed, and radiation dose efficiency. Recent innovations include AI-powered image reconstruction algorithms that improve image clarity and reduce noise. Manufacturers are also focusing on developing compact and cost-effective CT scanners suitable for smaller clinics and diagnostic centers.
Key Drivers, Barriers & Challenges in Computed Tomography Market in South Korea
Key Drivers: Rising prevalence of chronic diseases, technological advancements leading to improved image quality and reduced radiation dose, increasing healthcare expenditure, and government initiatives.
Challenges: High equipment costs, stringent regulatory approvals, competition from alternative imaging modalities (MRI, ultrasound), and skilled personnel shortages. The stringent regulatory landscape increases time-to-market and approval costs, potentially impacting overall market expansion. Moreover, the relatively high cost of advanced CT systems restricts their accessibility in smaller clinics and hospitals.
Emerging Opportunities in Computed Tomography Market in South Korea
Untapped opportunities lie in expanding CT services to smaller clinics and rural areas. The integration of AI and machine learning in CT imaging presents significant potential for improving diagnostic accuracy and workflow efficiency. The growing adoption of telehealth and remote diagnostics could also create opportunities for deploying remotely-accessible CT scanning solutions.
Growth Accelerators in the Computed Tomography Market in South Korea Industry
Technological advancements continue to be a major catalyst for growth, specifically AI-driven image analysis and advanced reconstruction techniques. Strategic partnerships between medical device manufacturers and healthcare providers further accelerate market expansion by improving service delivery and access to technology. Government initiatives to promote advanced medical technology adoption also serve as a significant growth driver.
Key Players Shaping the Computed Tomography Market in South Korea Market
- United Imaging
- GE Healthcare
- Siemens Healthineers AG
- Canon Medical Systems Corporation (Toshiba Corporation)
- Carestream Health
- Koninklijke Philips NV
- Planmeca Group (Planmed OY)
Notable Milestones in Computed Tomography Market in South Korea Sector
- March 2022: Philips Korea unveiled Greeting CT Premium at KIMES2022.
- January 2022: Bayer AG's MEDRAD Centargo received MFDS approval.
In-Depth Computed Tomography Market in South Korea Market Outlook
The South Korean CT market is poised for continued growth, driven by technological innovation, favorable government policies, and a rising need for advanced diagnostic capabilities. Strategic investments in infrastructure, coupled with the expanding applications of CT technology across various medical specialties, present lucrative opportunities for both domestic and international players. The focus on improving diagnostic accuracy and reducing radiation exposure will further fuel market demand in the coming years.
Computed Tomography Market in South Korea Segmentation
-
1. Type
- 1.1. Low Slice
- 1.2. Medium Slice
- 1.3. High Slice
-
2. Application
- 2.1. Oncology
- 2.2. Neurology
- 2.3. Cardiovascular
- 2.4. Musculoskeletal
- 2.5. Other Applications
-
3. End User
- 3.1. Hospitals
- 3.2. Diagnostic Centers
- 3.3. Other End Users
Computed Tomography Market in South Korea Segmentation By Geography
-
1. North America
- 1.1. United States
- 1.2. Canada
- 1.3. Mexico
-
2. South America
- 2.1. Brazil
- 2.2. Argentina
- 2.3. Rest of South America
-
3. Europe
- 3.1. United Kingdom
- 3.2. Germany
- 3.3. France
- 3.4. Italy
- 3.5. Spain
- 3.6. Russia
- 3.7. Benelux
- 3.8. Nordics
- 3.9. Rest of Europe
-
4. Middle East & Africa
- 4.1. Turkey
- 4.2. Israel
- 4.3. GCC
- 4.4. North Africa
- 4.5. South Africa
- 4.6. Rest of Middle East & Africa
-
5. Asia Pacific
- 5.1. China
- 5.2. India
- 5.3. Japan
- 5.4. South Korea
- 5.5. ASEAN
- 5.6. Oceania
- 5.7. Rest of Asia Pacific
Computed Tomography Market in South Korea REPORT HIGHLIGHTS
| Aspects | Details |
|---|---|
| Study Period | 2019-2033 |
| Base Year | 2024 |
| Estimated Year | 2025 |
| Forecast Period | 2025-2033 |
| Historical Period | 2019-2024 |
| Growth Rate | CAGR of 6.33% from 2019-2033 |
| Segmentation |
|
Table of Contents
- 1. Introduction
- 1.1. Research Scope
- 1.2. Market Segmentation
- 1.3. Research Methodology
- 1.4. Definitions and Assumptions
- 2. Executive Summary
- 2.1. Introduction
- 3. Market Dynamics
- 3.1. Introduction
- 3.2. Market Drivers
- 3.2.1. Increasing Prevalence of Chronic Diseases; Rising Geriatric Population; Increasing Technological Advancements
- 3.3. Market Restrains
- 3.3.1. Lack Of Proper Reimbursement And Stringent Regulatory Approval Procedures; High Cost of Equipment
- 3.4. Market Trends
- 3.4.1. Oncology Segment is Expected to Hold a Significant Market Share Over the Forecast Period
- 4. Market Factor Analysis
- 4.1. Porters Five Forces
- 4.2. Supply/Value Chain
- 4.3. PESTEL analysis
- 4.4. Market Entropy
- 4.5. Patent/Trademark Analysis
- 5. Global Computed Tomography Market in South Korea Analysis, Insights and Forecast, 2019-2031
- 5.1. Market Analysis, Insights and Forecast - by Type
- 5.1.1. Low Slice
- 5.1.2. Medium Slice
- 5.1.3. High Slice
- 5.2. Market Analysis, Insights and Forecast - by Application
- 5.2.1. Oncology
- 5.2.2. Neurology
- 5.2.3. Cardiovascular
- 5.2.4. Musculoskeletal
- 5.2.5. Other Applications
- 5.3. Market Analysis, Insights and Forecast - by End User
- 5.3.1. Hospitals
- 5.3.2. Diagnostic Centers
- 5.3.3. Other End Users
- 5.4. Market Analysis, Insights and Forecast - by Region
- 5.4.1. North America
- 5.4.2. South America
- 5.4.3. Europe
- 5.4.4. Middle East & Africa
- 5.4.5. Asia Pacific
- 5.1. Market Analysis, Insights and Forecast - by Type
- 6. North America Computed Tomography Market in South Korea Analysis, Insights and Forecast, 2019-2031
- 6.1. Market Analysis, Insights and Forecast - by Type
- 6.1.1. Low Slice
- 6.1.2. Medium Slice
- 6.1.3. High Slice
- 6.2. Market Analysis, Insights and Forecast - by Application
- 6.2.1. Oncology
- 6.2.2. Neurology
- 6.2.3. Cardiovascular
- 6.2.4. Musculoskeletal
- 6.2.5. Other Applications
- 6.3. Market Analysis, Insights and Forecast - by End User
- 6.3.1. Hospitals
- 6.3.2. Diagnostic Centers
- 6.3.3. Other End Users
- 6.1. Market Analysis, Insights and Forecast - by Type
- 7. South America Computed Tomography Market in South Korea Analysis, Insights and Forecast, 2019-2031
- 7.1. Market Analysis, Insights and Forecast - by Type
- 7.1.1. Low Slice
- 7.1.2. Medium Slice
- 7.1.3. High Slice
- 7.2. Market Analysis, Insights and Forecast - by Application
- 7.2.1. Oncology
- 7.2.2. Neurology
- 7.2.3. Cardiovascular
- 7.2.4. Musculoskeletal
- 7.2.5. Other Applications
- 7.3. Market Analysis, Insights and Forecast - by End User
- 7.3.1. Hospitals
- 7.3.2. Diagnostic Centers
- 7.3.3. Other End Users
- 7.1. Market Analysis, Insights and Forecast - by Type
- 8. Europe Computed Tomography Market in South Korea Analysis, Insights and Forecast, 2019-2031
- 8.1. Market Analysis, Insights and Forecast - by Type
- 8.1.1. Low Slice
- 8.1.2. Medium Slice
- 8.1.3. High Slice
- 8.2. Market Analysis, Insights and Forecast - by Application
- 8.2.1. Oncology
- 8.2.2. Neurology
- 8.2.3. Cardiovascular
- 8.2.4. Musculoskeletal
- 8.2.5. Other Applications
- 8.3. Market Analysis, Insights and Forecast - by End User
- 8.3.1. Hospitals
- 8.3.2. Diagnostic Centers
- 8.3.3. Other End Users
- 8.1. Market Analysis, Insights and Forecast - by Type
- 9. Middle East & Africa Computed Tomography Market in South Korea Analysis, Insights and Forecast, 2019-2031
- 9.1. Market Analysis, Insights and Forecast - by Type
- 9.1.1. Low Slice
- 9.1.2. Medium Slice
- 9.1.3. High Slice
- 9.2. Market Analysis, Insights and Forecast - by Application
- 9.2.1. Oncology
- 9.2.2. Neurology
- 9.2.3. Cardiovascular
- 9.2.4. Musculoskeletal
- 9.2.5. Other Applications
- 9.3. Market Analysis, Insights and Forecast - by End User
- 9.3.1. Hospitals
- 9.3.2. Diagnostic Centers
- 9.3.3. Other End Users
- 9.1. Market Analysis, Insights and Forecast - by Type
- 10. Asia Pacific Computed Tomography Market in South Korea Analysis, Insights and Forecast, 2019-2031
- 10.1. Market Analysis, Insights and Forecast - by Type
- 10.1.1. Low Slice
- 10.1.2. Medium Slice
- 10.1.3. High Slice
- 10.2. Market Analysis, Insights and Forecast - by Application
- 10.2.1. Oncology
- 10.2.2. Neurology
- 10.2.3. Cardiovascular
- 10.2.4. Musculoskeletal
- 10.2.5. Other Applications
- 10.3. Market Analysis, Insights and Forecast - by End User
- 10.3.1. Hospitals
- 10.3.2. Diagnostic Centers
- 10.3.3. Other End Users
- 10.1. Market Analysis, Insights and Forecast - by Type
- 11. Competitive Analysis
- 11.1. Global Market Share Analysis 2024
- 11.2. Company Profiles
- 11.2.1 United Imaging
- 11.2.1.1. Overview
- 11.2.1.2. Products
- 11.2.1.3. SWOT Analysis
- 11.2.1.4. Recent Developments
- 11.2.1.5. Financials (Based on Availability)
- 11.2.2 GE Healthcare
- 11.2.2.1. Overview
- 11.2.2.2. Products
- 11.2.2.3. SWOT Analysis
- 11.2.2.4. Recent Developments
- 11.2.2.5. Financials (Based on Availability)
- 11.2.3 Siemens Healthineers AG
- 11.2.3.1. Overview
- 11.2.3.2. Products
- 11.2.3.3. SWOT Analysis
- 11.2.3.4. Recent Developments
- 11.2.3.5. Financials (Based on Availability)
- 11.2.4 Canon Medical Systems Corporation (Toshiba Corporation)
- 11.2.4.1. Overview
- 11.2.4.2. Products
- 11.2.4.3. SWOT Analysis
- 11.2.4.4. Recent Developments
- 11.2.4.5. Financials (Based on Availability)
- 11.2.5 Carestream Health
- 11.2.5.1. Overview
- 11.2.5.2. Products
- 11.2.5.3. SWOT Analysis
- 11.2.5.4. Recent Developments
- 11.2.5.5. Financials (Based on Availability)
- 11.2.6 Koninklijke Philips NV
- 11.2.6.1. Overview
- 11.2.6.2. Products
- 11.2.6.3. SWOT Analysis
- 11.2.6.4. Recent Developments
- 11.2.6.5. Financials (Based on Availability)
- 11.2.7 Planmeca Group (Planmed OY)
- 11.2.7.1. Overview
- 11.2.7.2. Products
- 11.2.7.3. SWOT Analysis
- 11.2.7.4. Recent Developments
- 11.2.7.5. Financials (Based on Availability)
- 11.2.1 United Imaging
List of Figures
- Figure 1: Global Computed Tomography Market in South Korea Revenue Breakdown (Million, %) by Region 2024 & 2032
- Figure 2: South Korea Computed Tomography Market in South Korea Revenue (Million), by Country 2024 & 2032
- Figure 3: South Korea Computed Tomography Market in South Korea Revenue Share (%), by Country 2024 & 2032
- Figure 4: North America Computed Tomography Market in South Korea Revenue (Million), by Type 2024 & 2032
- Figure 5: North America Computed Tomography Market in South Korea Revenue Share (%), by Type 2024 & 2032
- Figure 6: North America Computed Tomography Market in South Korea Revenue (Million), by Application 2024 & 2032
- Figure 7: North America Computed Tomography Market in South Korea Revenue Share (%), by Application 2024 & 2032
- Figure 8: North America Computed Tomography Market in South Korea Revenue (Million), by End User 2024 & 2032
- Figure 9: North America Computed Tomography Market in South Korea Revenue Share (%), by End User 2024 & 2032
- Figure 10: North America Computed Tomography Market in South Korea Revenue (Million), by Country 2024 & 2032
- Figure 11: North America Computed Tomography Market in South Korea Revenue Share (%), by Country 2024 & 2032
- Figure 12: South America Computed Tomography Market in South Korea Revenue (Million), by Type 2024 & 2032
- Figure 13: South America Computed Tomography Market in South Korea Revenue Share (%), by Type 2024 & 2032
- Figure 14: South America Computed Tomography Market in South Korea Revenue (Million), by Application 2024 & 2032
- Figure 15: South America Computed Tomography Market in South Korea Revenue Share (%), by Application 2024 & 2032
- Figure 16: South America Computed Tomography Market in South Korea Revenue (Million), by End User 2024 & 2032
- Figure 17: South America Computed Tomography Market in South Korea Revenue Share (%), by End User 2024 & 2032
- Figure 18: South America Computed Tomography Market in South Korea Revenue (Million), by Country 2024 & 2032
- Figure 19: South America Computed Tomography Market in South Korea Revenue Share (%), by Country 2024 & 2032
- Figure 20: Europe Computed Tomography Market in South Korea Revenue (Million), by Type 2024 & 2032
- Figure 21: Europe Computed Tomography Market in South Korea Revenue Share (%), by Type 2024 & 2032
- Figure 22: Europe Computed Tomography Market in South Korea Revenue (Million), by Application 2024 & 2032
- Figure 23: Europe Computed Tomography Market in South Korea Revenue Share (%), by Application 2024 & 2032
- Figure 24: Europe Computed Tomography Market in South Korea Revenue (Million), by End User 2024 & 2032
- Figure 25: Europe Computed Tomography Market in South Korea Revenue Share (%), by End User 2024 & 2032
- Figure 26: Europe Computed Tomography Market in South Korea Revenue (Million), by Country 2024 & 2032
- Figure 27: Europe Computed Tomography Market in South Korea Revenue Share (%), by Country 2024 & 2032
- Figure 28: Middle East & Africa Computed Tomography Market in South Korea Revenue (Million), by Type 2024 & 2032
- Figure 29: Middle East & Africa Computed Tomography Market in South Korea Revenue Share (%), by Type 2024 & 2032
- Figure 30: Middle East & Africa Computed Tomography Market in South Korea Revenue (Million), by Application 2024 & 2032
- Figure 31: Middle East & Africa Computed Tomography Market in South Korea Revenue Share (%), by Application 2024 & 2032
- Figure 32: Middle East & Africa Computed Tomography Market in South Korea Revenue (Million), by End User 2024 & 2032
- Figure 33: Middle East & Africa Computed Tomography Market in South Korea Revenue Share (%), by End User 2024 & 2032
- Figure 34: Middle East & Africa Computed Tomography Market in South Korea Revenue (Million), by Country 2024 & 2032
- Figure 35: Middle East & Africa Computed Tomography Market in South Korea Revenue Share (%), by Country 2024 & 2032
- Figure 36: Asia Pacific Computed Tomography Market in South Korea Revenue (Million), by Type 2024 & 2032
- Figure 37: Asia Pacific Computed Tomography Market in South Korea Revenue Share (%), by Type 2024 & 2032
- Figure 38: Asia Pacific Computed Tomography Market in South Korea Revenue (Million), by Application 2024 & 2032
- Figure 39: Asia Pacific Computed Tomography Market in South Korea Revenue Share (%), by Application 2024 & 2032
- Figure 40: Asia Pacific Computed Tomography Market in South Korea Revenue (Million), by End User 2024 & 2032
- Figure 41: Asia Pacific Computed Tomography Market in South Korea Revenue Share (%), by End User 2024 & 2032
- Figure 42: Asia Pacific Computed Tomography Market in South Korea Revenue (Million), by Country 2024 & 2032
- Figure 43: Asia Pacific Computed Tomography Market in South Korea Revenue Share (%), by Country 2024 & 2032
List of Tables
- Table 1: Global Computed Tomography Market in South Korea Revenue Million Forecast, by Region 2019 & 2032
- Table 2: Global Computed Tomography Market in South Korea Revenue Million Forecast, by Type 2019 & 2032
- Table 3: Global Computed Tomography Market in South Korea Revenue Million Forecast, by Application 2019 & 2032
- Table 4: Global Computed Tomography Market in South Korea Revenue Million Forecast, by End User 2019 & 2032
- Table 5: Global Computed Tomography Market in South Korea Revenue Million Forecast, by Region 2019 & 2032
- Table 6: Global Computed Tomography Market in South Korea Revenue Million Forecast, by Country 2019 & 2032
- Table 7: Global Computed Tomography Market in South Korea Revenue Million Forecast, by Type 2019 & 2032
- Table 8: Global Computed Tomography Market in South Korea Revenue Million Forecast, by Application 2019 & 2032
- Table 9: Global Computed Tomography Market in South Korea Revenue Million Forecast, by End User 2019 & 2032
- Table 10: Global Computed Tomography Market in South Korea Revenue Million Forecast, by Country 2019 & 2032
- Table 11: United States Computed Tomography Market in South Korea Revenue (Million) Forecast, by Application 2019 & 2032
- Table 12: Canada Computed Tomography Market in South Korea Revenue (Million) Forecast, by Application 2019 & 2032
- Table 13: Mexico Computed Tomography Market in South Korea Revenue (Million) Forecast, by Application 2019 & 2032
- Table 14: Global Computed Tomography Market in South Korea Revenue Million Forecast, by Type 2019 & 2032
- Table 15: Global Computed Tomography Market in South Korea Revenue Million Forecast, by Application 2019 & 2032
- Table 16: Global Computed Tomography Market in South Korea Revenue Million Forecast, by End User 2019 & 2032
- Table 17: Global Computed Tomography Market in South Korea Revenue Million Forecast, by Country 2019 & 2032
- Table 18: Brazil Computed Tomography Market in South Korea Revenue (Million) Forecast, by Application 2019 & 2032
- Table 19: Argentina Computed Tomography Market in South Korea Revenue (Million) Forecast, by Application 2019 & 2032
- Table 20: Rest of South America Computed Tomography Market in South Korea Revenue (Million) Forecast, by Application 2019 & 2032
- Table 21: Global Computed Tomography Market in South Korea Revenue Million Forecast, by Type 2019 & 2032
- Table 22: Global Computed Tomography Market in South Korea Revenue Million Forecast, by Application 2019 & 2032
- Table 23: Global Computed Tomography Market in South Korea Revenue Million Forecast, by End User 2019 & 2032
- Table 24: Global Computed Tomography Market in South Korea Revenue Million Forecast, by Country 2019 & 2032
- Table 25: United Kingdom Computed Tomography Market in South Korea Revenue (Million) Forecast, by Application 2019 & 2032
- Table 26: Germany Computed Tomography Market in South Korea Revenue (Million) Forecast, by Application 2019 & 2032
- Table 27: France Computed Tomography Market in South Korea Revenue (Million) Forecast, by Application 2019 & 2032
- Table 28: Italy Computed Tomography Market in South Korea Revenue (Million) Forecast, by Application 2019 & 2032
- Table 29: Spain Computed Tomography Market in South Korea Revenue (Million) Forecast, by Application 2019 & 2032
- Table 30: Russia Computed Tomography Market in South Korea Revenue (Million) Forecast, by Application 2019 & 2032
- Table 31: Benelux Computed Tomography Market in South Korea Revenue (Million) Forecast, by Application 2019 & 2032
- Table 32: Nordics Computed Tomography Market in South Korea Revenue (Million) Forecast, by Application 2019 & 2032
- Table 33: Rest of Europe Computed Tomography Market in South Korea Revenue (Million) Forecast, by Application 2019 & 2032
- Table 34: Global Computed Tomography Market in South Korea Revenue Million Forecast, by Type 2019 & 2032
- Table 35: Global Computed Tomography Market in South Korea Revenue Million Forecast, by Application 2019 & 2032
- Table 36: Global Computed Tomography Market in South Korea Revenue Million Forecast, by End User 2019 & 2032
- Table 37: Global Computed Tomography Market in South Korea Revenue Million Forecast, by Country 2019 & 2032
- Table 38: Turkey Computed Tomography Market in South Korea Revenue (Million) Forecast, by Application 2019 & 2032
- Table 39: Israel Computed Tomography Market in South Korea Revenue (Million) Forecast, by Application 2019 & 2032
- Table 40: GCC Computed Tomography Market in South Korea Revenue (Million) Forecast, by Application 2019 & 2032
- Table 41: North Africa Computed Tomography Market in South Korea Revenue (Million) Forecast, by Application 2019 & 2032
- Table 42: South Africa Computed Tomography Market in South Korea Revenue (Million) Forecast, by Application 2019 & 2032
- Table 43: Rest of Middle East & Africa Computed Tomography Market in South Korea Revenue (Million) Forecast, by Application 2019 & 2032
- Table 44: Global Computed Tomography Market in South Korea Revenue Million Forecast, by Type 2019 & 2032
- Table 45: Global Computed Tomography Market in South Korea Revenue Million Forecast, by Application 2019 & 2032
- Table 46: Global Computed Tomography Market in South Korea Revenue Million Forecast, by End User 2019 & 2032
- Table 47: Global Computed Tomography Market in South Korea Revenue Million Forecast, by Country 2019 & 2032
- Table 48: China Computed Tomography Market in South Korea Revenue (Million) Forecast, by Application 2019 & 2032
- Table 49: India Computed Tomography Market in South Korea Revenue (Million) Forecast, by Application 2019 & 2032
- Table 50: Japan Computed Tomography Market in South Korea Revenue (Million) Forecast, by Application 2019 & 2032
- Table 51: South Korea Computed Tomography Market in South Korea Revenue (Million) Forecast, by Application 2019 & 2032
- Table 52: ASEAN Computed Tomography Market in South Korea Revenue (Million) Forecast, by Application 2019 & 2032
- Table 53: Oceania Computed Tomography Market in South Korea Revenue (Million) Forecast, by Application 2019 & 2032
- Table 54: Rest of Asia Pacific Computed Tomography Market in South Korea Revenue (Million) Forecast, by Application 2019 & 2032
Frequently Asked Questions
1. What is the projected Compound Annual Growth Rate (CAGR) of the Computed Tomography Market in South Korea?
The projected CAGR is approximately 6.33%.
2. Which companies are prominent players in the Computed Tomography Market in South Korea?
Key companies in the market include United Imaging, GE Healthcare, Siemens Healthineers AG, Canon Medical Systems Corporation (Toshiba Corporation), Carestream Health, Koninklijke Philips NV, Planmeca Group (Planmed OY).
3. What are the main segments of the Computed Tomography Market in South Korea?
The market segments include Type, Application, End User.
4. Can you provide details about the market size?
The market size is estimated to be USD 226.64 Million as of 2022.
5. What are some drivers contributing to market growth?
Increasing Prevalence of Chronic Diseases; Rising Geriatric Population; Increasing Technological Advancements.
6. What are the notable trends driving market growth?
Oncology Segment is Expected to Hold a Significant Market Share Over the Forecast Period.
7. Are there any restraints impacting market growth?
Lack Of Proper Reimbursement And Stringent Regulatory Approval Procedures; High Cost of Equipment.
8. Can you provide examples of recent developments in the market?
In March 2022, Philips Korea unveiled Greeting CT Premium at 37th Korea International Medical & Hospital Equipment Show (KIMES2022) held at Samsung-dong COEX in Seoul.
9. What pricing options are available for accessing the report?
Pricing options include single-user, multi-user, and enterprise licenses priced at USD 3800, USD 4500, and USD 5800 respectively.
10. Is the market size provided in terms of value or volume?
The market size is provided in terms of value, measured in Million.
11. Are there any specific market keywords associated with the report?
Yes, the market keyword associated with the report is "Computed Tomography Market in South Korea," which aids in identifying and referencing the specific market segment covered.
12. How do I determine which pricing option suits my needs best?
The pricing options vary based on user requirements and access needs. Individual users may opt for single-user licenses, while businesses requiring broader access may choose multi-user or enterprise licenses for cost-effective access to the report.
13. Are there any additional resources or data provided in the Computed Tomography Market in South Korea report?
While the report offers comprehensive insights, it's advisable to review the specific contents or supplementary materials provided to ascertain if additional resources or data are available.
14. How can I stay updated on further developments or reports in the Computed Tomography Market in South Korea?
To stay informed about further developments, trends, and reports in the Computed Tomography Market in South Korea, consider subscribing to industry newsletters, following relevant companies and organizations, or regularly checking reputable industry news sources and publications.
Methodology
Step 1 - Identification of Relevant Samples Size from Population Database


Step 2 - Approaches for Defining Global Market Size (Value, Volume* & Price*)

Note*: In applicable scenarios
Step 3 - Data Sources
Primary Research
- Web Analytics
- Survey Reports
- Research Institute
- Latest Research Reports
- Opinion Leaders
Secondary Research
- Annual Reports
- White Paper
- Latest Press Release
- Industry Association
- Paid Database
- Investor Presentations

Step 4 - Data Triangulation
Involves using different sources of information in order to increase the validity of a study
These sources are likely to be stakeholders in a program - participants, other researchers, program staff, other community members, and so on.
Then we put all data in single framework & apply various statistical tools to find out the dynamic on the market.
During the analysis stage, feedback from the stakeholder groups would be compared to determine areas of agreement as well as areas of divergence
