

Key Insights
The global End-Stage Renal Disease (ESRD) market is projected for significant expansion, with a current market size of $4.59 billion in the base year 2025. This growth trajectory is underpinned by increasing incidences of Chronic Kidney Disease (CKD), an aging demographic, and heightened awareness of effective ESRD treatments. The market is anticipated to experience a Compound Annual Growth Rate (CAGR) of 4.35%, forecasting a market size of approximately $4.59 billion by 2033. Key drivers include technological innovations in dialysis, the growing adoption of minimally invasive procedures, and the rising demand for home dialysis solutions that enhance patient quality of life. While North America and Europe currently lead due to robust healthcare infrastructure and higher prevalence rates, the Asia-Pacific region is poised for rapid growth driven by its large population, increasing disposable incomes, and expanding healthcare access. The market is segmented by treatment modalities, including kidney transplantation and various dialysis methods (hemodialysis, peritoneal dialysis), and by diagnostic approaches, encompassing blood tests, urine tests, imaging, and other diagnostic tools. The competitive landscape features established leaders such as Fresenius, Baxter, and DaVita, alongside specialized niche technology providers. Challenges include high treatment costs, regional healthcare policy disparities, and a limited supply of donor organs.
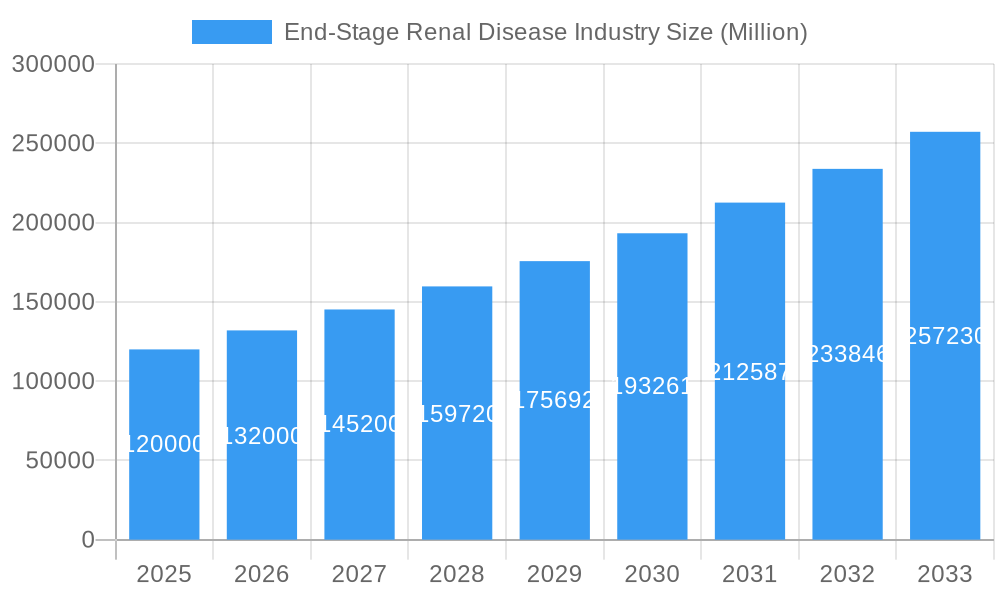
End-Stage Renal Disease Industry Market Size (In Billion)
Future market expansion for ESRD will be propelled by ongoing advancements in dialysis technologies, particularly the development of portable and home-based systems. Enhanced diagnostic tools for earlier disease detection and improved access to affordable healthcare, especially in emerging economies, will be critical. A greater emphasis on preventative strategies, such as the management of hypertension and diabetes—major CKD risk factors—will also shape market dynamics. Strategic alliances among healthcare providers, technology developers, and regulatory bodies are essential to overcome existing hurdles and foster market growth. The proliferation of telehealth and remote patient monitoring technologies offers substantial opportunities for cost-effective, personalized care management, further bolstering market growth prospects.
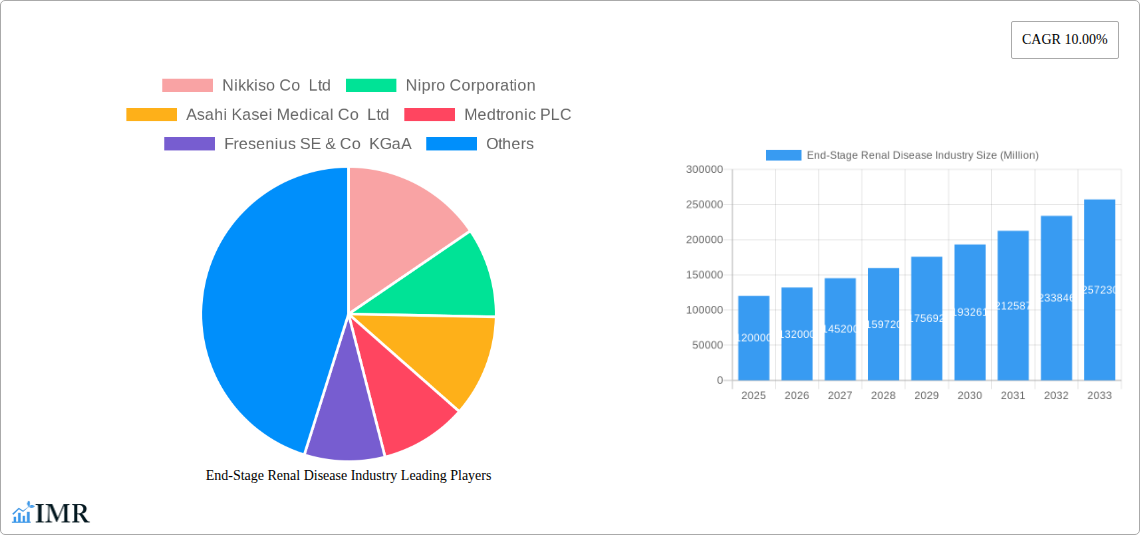
End-Stage Renal Disease Industry Company Market Share
End-Stage Renal Disease (ESRD) Industry Market Report: 2019-2033
This comprehensive report provides a detailed analysis of the End-Stage Renal Disease (ESRD) industry, encompassing market dynamics, growth trends, regional insights, product landscape, key players, and future outlook. The study period covers 2019-2033, with a base year of 2025 and a forecast period of 2025-2033. The report is designed for industry professionals, investors, and researchers seeking in-depth understanding of this vital healthcare sector. Market values are presented in millions of units.
End-Stage Renal Disease Industry Market Dynamics & Structure
The ESRD market is characterized by a moderate level of concentration, with several large players dominating the dialysis equipment and consumables segments. Technological innovation, particularly in dialysis techniques and devices, is a key driver, alongside regulatory changes influencing reimbursement policies and treatment access. Competitive product substitutes are limited, primarily focusing on advancements within dialysis and transplantation procedures. The market is significantly influenced by aging populations and the rising prevalence of chronic kidney disease (CKD), leading to increased demand for treatment. Mergers and acquisitions (M&A) activity has been moderate, reflecting consolidation amongst key players and strategic expansions into new markets.
- Market Concentration: Moderately concentrated, with top 5 players holding xx% market share (2024).
- Technological Innovation: Continuous advancements in dialysis technologies (e.g., portable dialysis systems, home dialysis options) and transplantation techniques.
- Regulatory Framework: Stringent regulations governing medical devices and healthcare reimbursement impact market access and pricing.
- Competitive Substitutes: Limited direct substitutes; innovation focuses on improving existing treatment modalities.
- End-User Demographics: Aging populations and rising prevalence of diabetes and hypertension are major drivers.
- M&A Trends: Moderate M&A activity, driven by strategic expansion and consolidation amongst key players. Approximately xx deals were recorded between 2019 and 2024.
End-Stage Renal Disease Industry Growth Trends & Insights
The global ESRD market experienced robust growth during the historical period (2019-2024), driven by factors such as rising prevalence of CKD, an aging population, and improved healthcare infrastructure in emerging economies. The market is expected to maintain a healthy CAGR of xx% during the forecast period (2025-2033), reaching a market size of xx million by 2033. Technological advancements like the introduction of portable dialysis systems are significantly influencing adoption rates, particularly for home dialysis. Shifts in consumer preferences towards convenient and less invasive treatments are also driving market growth. Market penetration of home dialysis continues to increase, albeit gradually, due to patient preference and logistical challenges.
Dominant Regions, Countries, or Segments in End-Stage Renal Disease Industry
North America currently dominates the ESRD market due to high prevalence of CKD, advanced healthcare infrastructure, and high healthcare expenditure. However, significant growth potential exists in emerging markets like Asia-Pacific and Latin America driven by increasing awareness and rising healthcare investments. Within treatment segments, Dialysis accounts for the largest share due to its widespread availability compared to transplantation, which is limited by organ donor scarcity. Within diagnostic testing, Blood tests currently hold the largest market share owing to routine usage in monitoring kidney function.
- Key Drivers in North America: Advanced healthcare infrastructure, high healthcare expenditure, high prevalence of CKD risk factors (diabetes, hypertension).
- Growth Potential in Asia-Pacific: Rising prevalence of CKD, increasing healthcare expenditure, and government initiatives to improve healthcare access.
- Dialysis Segment Dominance: High demand due to readily available technology and treatment accessibility compared to transplantation.
- Blood Test Dominance in Diagnosis: Routine usage in CKD monitoring and ESRD management.
End-Stage Renal Disease Industry Product Landscape
The ESRD product landscape includes dialysis machines, disposables (dialyzers, catheters), transplantation devices and materials, and diagnostic testing equipment. Recent innovations focus on miniaturization, portability, and improved efficiency of dialysis systems, enhancing patient comfort and compliance. Unique selling propositions include improved biocompatibility, reduced clotting risk, and enhanced ease of use. Technological advancements include automated peritoneal dialysis (APD) systems and advancements in hemodialysis membranes.
Key Drivers, Barriers & Challenges in End-Stage Renal Disease Industry
Key Drivers:
- Rising prevalence of chronic kidney disease (CKD) globally.
- Aging population in developed and developing countries.
- Technological advancements leading to more efficient and accessible dialysis treatments.
- Increasing healthcare expenditure and insurance coverage for ESRD treatment.
Key Barriers & Challenges:
- High cost of treatment, particularly dialysis, leading to affordability challenges.
- Shortage of organ donors for kidney transplantation.
- Stringent regulatory approvals for new medical devices.
- Supply chain disruptions impacting the availability of dialysis consumables.
- xx% increase in dialysis consumables cost from 2020 to 2024 leading to increased treatment cost.
Emerging Opportunities in End-Stage Renal Disease Industry
- Development of novel therapies for CKD progression prevention.
- Expansion of home dialysis programs to improve patient convenience and reduce healthcare costs.
- Adoption of telehealth technologies for remote patient monitoring and management.
- Development of portable and user-friendly dialysis machines for home use.
- Exploring innovative solutions to address organ donor shortage, such as 3D-printed organs.
Growth Accelerators in the End-Stage Renal Disease Industry
Technological advancements, strategic partnerships between healthcare providers and device manufacturers, and expansion into untapped markets in developing economies will significantly accelerate the ESRD industry's growth. Investments in research and development focused on less invasive procedures and improved dialysis techniques further enhance long-term growth prospects. The increased focus on early diagnosis and prevention of CKD will also contribute to market growth.
Key Players Shaping the End-Stage Renal Disease Industry Market
Notable Milestones in End-Stage Renal Disease Industry Sector
- March 2022: Launch of a new hemodialysis unit in Mauritius, adding 22 machines and capacity for 150 patients. This highlights decentralization efforts in ESRD care.
- April 2022: FDA approval of Fresenius Medical Care's Versi PD Cycler System, a next-generation portable automated peritoneal dialysis system, signifying technological advancement in home dialysis.
In-Depth End-Stage Renal Disease Industry Market Outlook
The ESRD market is poised for substantial growth driven by technological innovation, increased awareness, and growing healthcare investments globally. Strategic partnerships, market expansion into developing countries, and the development of innovative treatment options present significant opportunities for market players. The focus on preventative care and early detection of CKD will play a crucial role in shaping future market dynamics. The increasing adoption of home dialysis solutions and improvements in dialysis technology will further drive market growth.
End-Stage Renal Disease Industry Segmentation
-
1. Treatment
- 1.1. Kidney Transplantation
- 1.2. Dialysis
- 1.3. Diagnosis
End-Stage Renal Disease Industry Segmentation By Geography
-
1. North America
- 1.1. United States
- 1.2. Canada
- 1.3. Mexico
-
2. Europe
- 2.1. Germany
- 2.2. United Kingdom
- 2.3. France
- 2.4. Italy
- 2.5. Spain
- 2.6. Rest of Europe
-
3. Asia Pacific
- 3.1. China
- 3.2. Japan
- 3.3. India
- 3.4. Australia
- 3.5. South Korea
- 3.6. Rest of Asia Pacific
-
4. Middle East and Africa
- 4.1. GCC
- 4.2. South Africa
- 4.3. Rest of Middle East and Africa
-
5. South America
- 5.1. Brazil
- 5.2. Argentina
- 5.3. Rest of South America
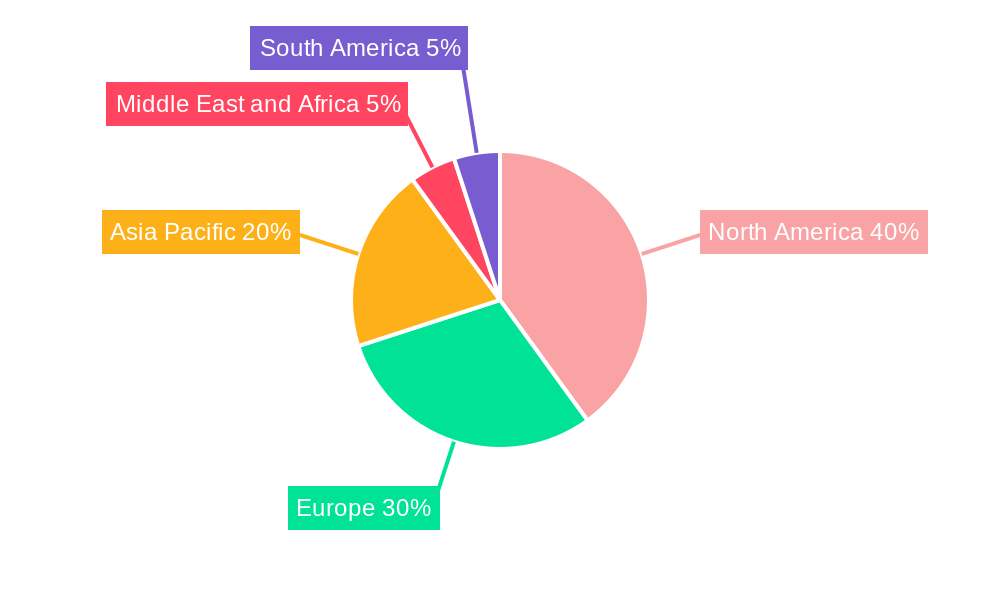
End-Stage Renal Disease Industry Regional Market Share
Geographic Coverage of End-Stage Renal Disease Industry
End-Stage Renal Disease Industry REPORT HIGHLIGHTS
| Aspects | Details |
|---|---|
| Study Period | 2020-2034 |
| Base Year | 2025 |
| Estimated Year | 2026 |
| Forecast Period | 2026-2034 |
| Historical Period | 2020-2025 |
| Growth Rate | CAGR of 4.35% from 2020-2034 |
| Segmentation |
|
Table of Contents
- 1. Introduction
- 1.1. Research Scope
- 1.2. Market Segmentation
- 1.3. Research Objective
- 1.4. Definitions and Assumptions
- 2. Executive Summary
- 2.1. Market Snapshot
- 3. Market Dynamics
- 3.1. Market Drivers
- 3.2. Market Restrains
- 3.3. Market Trends
- 3.4. Market Opportunities
- 4. Market Factor Analysis
- 4.1. Porters Five Forces
- 4.1.1. Bargaining Power of Suppliers
- 4.1.2. Bargaining Power of Buyers
- 4.1.3. Threat of New Entrants
- 4.1.4. Threat of Substitutes
- 4.1.5. Competitive Rivalry
- 4.2. PESTEL analysis
- 4.3. BCG Analysis
- 4.3.1. Stars (High Growth, High Market Share)
- 4.3.2. Cash Cows (Low Growth, High Market Share)
- 4.3.3. Question Mark (High Growth, Low Market Share)
- 4.3.4. Dogs (Low Growth, Low Market Share)
- 4.4. Ansoff Matrix Analysis
- 4.5. Supply Chain Analysis
- 4.6. Regulatory Landscape
- 4.7. Current Market Potential and Opportunity Assessment (TAM–SAM–SOM Framework)
- 4.8. IMR Analyst Note
- 4.1. Porters Five Forces
- 5. Market Analysis, Insights and Forecast 2021-2033
- 5.1. Market Analysis, Insights and Forecast - by Treatment
- 5.1.1. Kidney Transplantation
- 5.1.2. Dialysis
- 5.1.3. Diagnosis
- 5.2. Market Analysis, Insights and Forecast - by Region
- 5.2.1. North America
- 5.2.2. Europe
- 5.2.3. Asia Pacific
- 5.2.4. Middle East and Africa
- 5.2.5. South America
- 5.1. Market Analysis, Insights and Forecast - by Treatment
- 6. Global End-Stage Renal Disease Industry Analysis, Insights and Forecast, 2021-2033
- 6.1. Market Analysis, Insights and Forecast - by Treatment
- 6.1.1. Kidney Transplantation
- 6.1.2. Dialysis
- 6.1.3. Diagnosis
- 6.1. Market Analysis, Insights and Forecast - by Treatment
- 7. North America End-Stage Renal Disease Industry Analysis, Insights and Forecast, 2020-2032
- 7.1. Market Analysis, Insights and Forecast - by Treatment
- 7.1.1. Kidney Transplantation
- 7.1.2. Dialysis
- 7.1.3. Diagnosis
- 7.1. Market Analysis, Insights and Forecast - by Treatment
- 8. Europe End-Stage Renal Disease Industry Analysis, Insights and Forecast, 2020-2032
- 8.1. Market Analysis, Insights and Forecast - by Treatment
- 8.1.1. Kidney Transplantation
- 8.1.2. Dialysis
- 8.1.3. Diagnosis
- 8.1. Market Analysis, Insights and Forecast - by Treatment
- 9. Asia Pacific End-Stage Renal Disease Industry Analysis, Insights and Forecast, 2020-2032
- 9.1. Market Analysis, Insights and Forecast - by Treatment
- 9.1.1. Kidney Transplantation
- 9.1.2. Dialysis
- 9.1.3. Diagnosis
- 9.1. Market Analysis, Insights and Forecast - by Treatment
- 10. Middle East and Africa End-Stage Renal Disease Industry Analysis, Insights and Forecast, 2020-2032
- 10.1. Market Analysis, Insights and Forecast - by Treatment
- 10.1.1. Kidney Transplantation
- 10.1.2. Dialysis
- 10.1.3. Diagnosis
- 10.1. Market Analysis, Insights and Forecast - by Treatment
- 11. South America End-Stage Renal Disease Industry Analysis, Insights and Forecast, 2020-2032
- 11.1. Market Analysis, Insights and Forecast - by Treatment
- 11.1.1. Kidney Transplantation
- 11.1.2. Dialysis
- 11.1.3. Diagnosis
- 11.1. Market Analysis, Insights and Forecast - by Treatment
- 12. Competitive Analysis
- 12.1. Company Profiles
- 12.1.1 Nikkiso Co Ltd
- 12.1.1.1. Company Overview
- 12.1.1.2. Products
- 12.1.1.3. Company Financials
- 12.1.1.4. SWOT Analysis
- 12.1.2 Nipro Corporation
- 12.1.2.1. Company Overview
- 12.1.2.2. Products
- 12.1.2.3. Company Financials
- 12.1.2.4. SWOT Analysis
- 12.1.3 Asahi Kasei Medical Co Ltd
- 12.1.3.1. Company Overview
- 12.1.3.2. Products
- 12.1.3.3. Company Financials
- 12.1.3.4. SWOT Analysis
- 12.1.4 Medtronic PLC
- 12.1.4.1. Company Overview
- 12.1.4.2. Products
- 12.1.4.3. Company Financials
- 12.1.4.4. SWOT Analysis
- 12.1.5 Fresenius SE & Co KGaA
- 12.1.5.1. Company Overview
- 12.1.5.2. Products
- 12.1.5.3. Company Financials
- 12.1.5.4. SWOT Analysis
- 12.1.6 Becton Dickinson and Company
- 12.1.6.1. Company Overview
- 12.1.6.2. Products
- 12.1.6.3. Company Financials
- 12.1.6.4. SWOT Analysis
- 12.1.7 Cantel Medical (STERIS)
- 12.1.7.1. Company Overview
- 12.1.7.2. Products
- 12.1.7.3. Company Financials
- 12.1.7.4. SWOT Analysis
- 12.1.8 Baxter International Inc
- 12.1.8.1. Company Overview
- 12.1.8.2. Products
- 12.1.8.3. Company Financials
- 12.1.8.4. SWOT Analysis
- 12.1.9 B Braun SE
- 12.1.9.1. Company Overview
- 12.1.9.2. Products
- 12.1.9.3. Company Financials
- 12.1.9.4. SWOT Analysis
- 12.1.1 Nikkiso Co Ltd
- 12.2. Market Entropy
- 12.2.1 Company's Key Areas Served
- 12.2.2 Recent Developments
- 12.3. Company Market Share Analysis 2025
- 12.3.1 Top 5 Companies Market Share Analysis
- 12.3.2 Top 3 Companies Market Share Analysis
- 12.4. List of Potential Customers
- 13. Research Methodology
List of Figures
- Figure 1: Global End-Stage Renal Disease Industry Revenue Breakdown (billion, %) by Region 2025 & 2033
- Figure 2: Global End-Stage Renal Disease Industry Volume Breakdown (K Unit, %) by Region 2025 & 2033
- Figure 3: North America End-Stage Renal Disease Industry Revenue (billion), by Treatment 2025 & 2033
- Figure 4: North America End-Stage Renal Disease Industry Volume (K Unit), by Treatment 2025 & 2033
- Figure 5: North America End-Stage Renal Disease Industry Revenue Share (%), by Treatment 2025 & 2033
- Figure 6: North America End-Stage Renal Disease Industry Volume Share (%), by Treatment 2025 & 2033
- Figure 7: North America End-Stage Renal Disease Industry Revenue (billion), by Country 2025 & 2033
- Figure 8: North America End-Stage Renal Disease Industry Volume (K Unit), by Country 2025 & 2033
- Figure 9: North America End-Stage Renal Disease Industry Revenue Share (%), by Country 2025 & 2033
- Figure 10: North America End-Stage Renal Disease Industry Volume Share (%), by Country 2025 & 2033
- Figure 11: Europe End-Stage Renal Disease Industry Revenue (billion), by Treatment 2025 & 2033
- Figure 12: Europe End-Stage Renal Disease Industry Volume (K Unit), by Treatment 2025 & 2033
- Figure 13: Europe End-Stage Renal Disease Industry Revenue Share (%), by Treatment 2025 & 2033
- Figure 14: Europe End-Stage Renal Disease Industry Volume Share (%), by Treatment 2025 & 2033
- Figure 15: Europe End-Stage Renal Disease Industry Revenue (billion), by Country 2025 & 2033
- Figure 16: Europe End-Stage Renal Disease Industry Volume (K Unit), by Country 2025 & 2033
- Figure 17: Europe End-Stage Renal Disease Industry Revenue Share (%), by Country 2025 & 2033
- Figure 18: Europe End-Stage Renal Disease Industry Volume Share (%), by Country 2025 & 2033
- Figure 19: Asia Pacific End-Stage Renal Disease Industry Revenue (billion), by Treatment 2025 & 2033
- Figure 20: Asia Pacific End-Stage Renal Disease Industry Volume (K Unit), by Treatment 2025 & 2033
- Figure 21: Asia Pacific End-Stage Renal Disease Industry Revenue Share (%), by Treatment 2025 & 2033
- Figure 22: Asia Pacific End-Stage Renal Disease Industry Volume Share (%), by Treatment 2025 & 2033
- Figure 23: Asia Pacific End-Stage Renal Disease Industry Revenue (billion), by Country 2025 & 2033
- Figure 24: Asia Pacific End-Stage Renal Disease Industry Volume (K Unit), by Country 2025 & 2033
- Figure 25: Asia Pacific End-Stage Renal Disease Industry Revenue Share (%), by Country 2025 & 2033
- Figure 26: Asia Pacific End-Stage Renal Disease Industry Volume Share (%), by Country 2025 & 2033
- Figure 27: Middle East and Africa End-Stage Renal Disease Industry Revenue (billion), by Treatment 2025 & 2033
- Figure 28: Middle East and Africa End-Stage Renal Disease Industry Volume (K Unit), by Treatment 2025 & 2033
- Figure 29: Middle East and Africa End-Stage Renal Disease Industry Revenue Share (%), by Treatment 2025 & 2033
- Figure 30: Middle East and Africa End-Stage Renal Disease Industry Volume Share (%), by Treatment 2025 & 2033
- Figure 31: Middle East and Africa End-Stage Renal Disease Industry Revenue (billion), by Country 2025 & 2033
- Figure 32: Middle East and Africa End-Stage Renal Disease Industry Volume (K Unit), by Country 2025 & 2033
- Figure 33: Middle East and Africa End-Stage Renal Disease Industry Revenue Share (%), by Country 2025 & 2033
- Figure 34: Middle East and Africa End-Stage Renal Disease Industry Volume Share (%), by Country 2025 & 2033
- Figure 35: South America End-Stage Renal Disease Industry Revenue (billion), by Treatment 2025 & 2033
- Figure 36: South America End-Stage Renal Disease Industry Volume (K Unit), by Treatment 2025 & 2033
- Figure 37: South America End-Stage Renal Disease Industry Revenue Share (%), by Treatment 2025 & 2033
- Figure 38: South America End-Stage Renal Disease Industry Volume Share (%), by Treatment 2025 & 2033
- Figure 39: South America End-Stage Renal Disease Industry Revenue (billion), by Country 2025 & 2033
- Figure 40: South America End-Stage Renal Disease Industry Volume (K Unit), by Country 2025 & 2033
- Figure 41: South America End-Stage Renal Disease Industry Revenue Share (%), by Country 2025 & 2033
- Figure 42: South America End-Stage Renal Disease Industry Volume Share (%), by Country 2025 & 2033
List of Tables
- Table 1: Global End-Stage Renal Disease Industry Revenue billion Forecast, by Treatment 2020 & 2033
- Table 2: Global End-Stage Renal Disease Industry Volume K Unit Forecast, by Treatment 2020 & 2033
- Table 3: Global End-Stage Renal Disease Industry Revenue billion Forecast, by Region 2020 & 2033
- Table 4: Global End-Stage Renal Disease Industry Volume K Unit Forecast, by Region 2020 & 2033
- Table 5: Global End-Stage Renal Disease Industry Revenue billion Forecast, by Treatment 2020 & 2033
- Table 6: Global End-Stage Renal Disease Industry Volume K Unit Forecast, by Treatment 2020 & 2033
- Table 7: Global End-Stage Renal Disease Industry Revenue billion Forecast, by Country 2020 & 2033
- Table 8: Global End-Stage Renal Disease Industry Volume K Unit Forecast, by Country 2020 & 2033
- Table 9: United States End-Stage Renal Disease Industry Revenue (billion) Forecast, by Application 2020 & 2033
- Table 10: United States End-Stage Renal Disease Industry Volume (K Unit) Forecast, by Application 2020 & 2033
- Table 11: Canada End-Stage Renal Disease Industry Revenue (billion) Forecast, by Application 2020 & 2033
- Table 12: Canada End-Stage Renal Disease Industry Volume (K Unit) Forecast, by Application 2020 & 2033
- Table 13: Mexico End-Stage Renal Disease Industry Revenue (billion) Forecast, by Application 2020 & 2033
- Table 14: Mexico End-Stage Renal Disease Industry Volume (K Unit) Forecast, by Application 2020 & 2033
- Table 15: Global End-Stage Renal Disease Industry Revenue billion Forecast, by Treatment 2020 & 2033
- Table 16: Global End-Stage Renal Disease Industry Volume K Unit Forecast, by Treatment 2020 & 2033
- Table 17: Global End-Stage Renal Disease Industry Revenue billion Forecast, by Country 2020 & 2033
- Table 18: Global End-Stage Renal Disease Industry Volume K Unit Forecast, by Country 2020 & 2033
- Table 19: Germany End-Stage Renal Disease Industry Revenue (billion) Forecast, by Application 2020 & 2033
- Table 20: Germany End-Stage Renal Disease Industry Volume (K Unit) Forecast, by Application 2020 & 2033
- Table 21: United Kingdom End-Stage Renal Disease Industry Revenue (billion) Forecast, by Application 2020 & 2033
- Table 22: United Kingdom End-Stage Renal Disease Industry Volume (K Unit) Forecast, by Application 2020 & 2033
- Table 23: France End-Stage Renal Disease Industry Revenue (billion) Forecast, by Application 2020 & 2033
- Table 24: France End-Stage Renal Disease Industry Volume (K Unit) Forecast, by Application 2020 & 2033
- Table 25: Italy End-Stage Renal Disease Industry Revenue (billion) Forecast, by Application 2020 & 2033
- Table 26: Italy End-Stage Renal Disease Industry Volume (K Unit) Forecast, by Application 2020 & 2033
- Table 27: Spain End-Stage Renal Disease Industry Revenue (billion) Forecast, by Application 2020 & 2033
- Table 28: Spain End-Stage Renal Disease Industry Volume (K Unit) Forecast, by Application 2020 & 2033
- Table 29: Rest of Europe End-Stage Renal Disease Industry Revenue (billion) Forecast, by Application 2020 & 2033
- Table 30: Rest of Europe End-Stage Renal Disease Industry Volume (K Unit) Forecast, by Application 2020 & 2033
- Table 31: Global End-Stage Renal Disease Industry Revenue billion Forecast, by Treatment 2020 & 2033
- Table 32: Global End-Stage Renal Disease Industry Volume K Unit Forecast, by Treatment 2020 & 2033
- Table 33: Global End-Stage Renal Disease Industry Revenue billion Forecast, by Country 2020 & 2033
- Table 34: Global End-Stage Renal Disease Industry Volume K Unit Forecast, by Country 2020 & 2033
- Table 35: China End-Stage Renal Disease Industry Revenue (billion) Forecast, by Application 2020 & 2033
- Table 36: China End-Stage Renal Disease Industry Volume (K Unit) Forecast, by Application 2020 & 2033
- Table 37: Japan End-Stage Renal Disease Industry Revenue (billion) Forecast, by Application 2020 & 2033
- Table 38: Japan End-Stage Renal Disease Industry Volume (K Unit) Forecast, by Application 2020 & 2033
- Table 39: India End-Stage Renal Disease Industry Revenue (billion) Forecast, by Application 2020 & 2033
- Table 40: India End-Stage Renal Disease Industry Volume (K Unit) Forecast, by Application 2020 & 2033
- Table 41: Australia End-Stage Renal Disease Industry Revenue (billion) Forecast, by Application 2020 & 2033
- Table 42: Australia End-Stage Renal Disease Industry Volume (K Unit) Forecast, by Application 2020 & 2033
- Table 43: South Korea End-Stage Renal Disease Industry Revenue (billion) Forecast, by Application 2020 & 2033
- Table 44: South Korea End-Stage Renal Disease Industry Volume (K Unit) Forecast, by Application 2020 & 2033
- Table 45: Rest of Asia Pacific End-Stage Renal Disease Industry Revenue (billion) Forecast, by Application 2020 & 2033
- Table 46: Rest of Asia Pacific End-Stage Renal Disease Industry Volume (K Unit) Forecast, by Application 2020 & 2033
- Table 47: Global End-Stage Renal Disease Industry Revenue billion Forecast, by Treatment 2020 & 2033
- Table 48: Global End-Stage Renal Disease Industry Volume K Unit Forecast, by Treatment 2020 & 2033
- Table 49: Global End-Stage Renal Disease Industry Revenue billion Forecast, by Country 2020 & 2033
- Table 50: Global End-Stage Renal Disease Industry Volume K Unit Forecast, by Country 2020 & 2033
- Table 51: GCC End-Stage Renal Disease Industry Revenue (billion) Forecast, by Application 2020 & 2033
- Table 52: GCC End-Stage Renal Disease Industry Volume (K Unit) Forecast, by Application 2020 & 2033
- Table 53: South Africa End-Stage Renal Disease Industry Revenue (billion) Forecast, by Application 2020 & 2033
- Table 54: South Africa End-Stage Renal Disease Industry Volume (K Unit) Forecast, by Application 2020 & 2033
- Table 55: Rest of Middle East and Africa End-Stage Renal Disease Industry Revenue (billion) Forecast, by Application 2020 & 2033
- Table 56: Rest of Middle East and Africa End-Stage Renal Disease Industry Volume (K Unit) Forecast, by Application 2020 & 2033
- Table 57: Global End-Stage Renal Disease Industry Revenue billion Forecast, by Treatment 2020 & 2033
- Table 58: Global End-Stage Renal Disease Industry Volume K Unit Forecast, by Treatment 2020 & 2033
- Table 59: Global End-Stage Renal Disease Industry Revenue billion Forecast, by Country 2020 & 2033
- Table 60: Global End-Stage Renal Disease Industry Volume K Unit Forecast, by Country 2020 & 2033
- Table 61: Brazil End-Stage Renal Disease Industry Revenue (billion) Forecast, by Application 2020 & 2033
- Table 62: Brazil End-Stage Renal Disease Industry Volume (K Unit) Forecast, by Application 2020 & 2033
- Table 63: Argentina End-Stage Renal Disease Industry Revenue (billion) Forecast, by Application 2020 & 2033
- Table 64: Argentina End-Stage Renal Disease Industry Volume (K Unit) Forecast, by Application 2020 & 2033
- Table 65: Rest of South America End-Stage Renal Disease Industry Revenue (billion) Forecast, by Application 2020 & 2033
- Table 66: Rest of South America End-Stage Renal Disease Industry Volume (K Unit) Forecast, by Application 2020 & 2033
Frequently Asked Questions
1. What is the projected Compound Annual Growth Rate (CAGR) of the End-Stage Renal Disease Industry?
The projected CAGR is approximately 4.35%.
2. Which companies are prominent players in the End-Stage Renal Disease Industry?
Key companies in the market include Nikkiso Co Ltd, Nipro Corporation, Asahi Kasei Medical Co Ltd, Medtronic PLC, Fresenius SE & Co KGaA, Becton Dickinson and Company, Cantel Medical (STERIS), Baxter International Inc, B Braun SE.
3. What are the main segments of the End-Stage Renal Disease Industry?
The market segments include Treatment.
4. Can you provide details about the market size?
The market size is estimated to be USD 4.59 billion as of 2022.
5. What are some drivers contributing to market growth?
Increase in Number of Patient Suffering from Chronic Kidney Disease; Introduction of Technologically Advanced Products; Rising Prevalence of Diabetes and Hypertension.
6. What are the notable trends driving market growth?
Dialysis Segment by Treatment is Expected to Witness a Significant Growth over the Forecast Period.
7. Are there any restraints impacting market growth?
Delay in Diagnosis of the Chronic Kidney Disease.
8. Can you provide examples of recent developments in the market?
April 2022- Fresenius Medical Care announced that the United States FDA approved the Versi PD Cycler System. It is a next-generation portable automated peritoneal dialysis system approved in North America.
9. What pricing options are available for accessing the report?
Pricing options include single-user, multi-user, and enterprise licenses priced at USD 4750, USD 5250, and USD 8750 respectively.
10. Is the market size provided in terms of value or volume?
The market size is provided in terms of value, measured in billion and volume, measured in K Unit.
11. Are there any specific market keywords associated with the report?
Yes, the market keyword associated with the report is "End-Stage Renal Disease Industry," which aids in identifying and referencing the specific market segment covered.
12. How do I determine which pricing option suits my needs best?
The pricing options vary based on user requirements and access needs. Individual users may opt for single-user licenses, while businesses requiring broader access may choose multi-user or enterprise licenses for cost-effective access to the report.
13. Are there any additional resources or data provided in the End-Stage Renal Disease Industry report?
While the report offers comprehensive insights, it's advisable to review the specific contents or supplementary materials provided to ascertain if additional resources or data are available.
14. How can I stay updated on further developments or reports in the End-Stage Renal Disease Industry?
To stay informed about further developments, trends, and reports in the End-Stage Renal Disease Industry, consider subscribing to industry newsletters, following relevant companies and organizations, or regularly checking reputable industry news sources and publications.
Methodology
Step 1 - Identification of Relevant Samples Size from Population Database


Step 2 - Approaches for Defining Global Market Size (Value, Volume* & Price*)

Note*: In applicable scenarios
Step 3 - Data Sources
Primary Research
- Web Analytics
- Survey Reports
- Research Institute
- Latest Research Reports
- Opinion Leaders
Secondary Research
- Annual Reports
- White Paper
- Latest Press Release
- Industry Association
- Paid Database
- Investor Presentations

Step 4 - Data Triangulation
Involves using different sources of information in order to increase the validity of a study
These sources are likely to be stakeholders in a program - participants, other researchers, program staff, other community members, and so on.
Then we put all data in single framework & apply various statistical tools to find out the dynamic on the market.
During the analysis stage, feedback from the stakeholder groups would be compared to determine areas of agreement as well as areas of divergence