

Key Insights
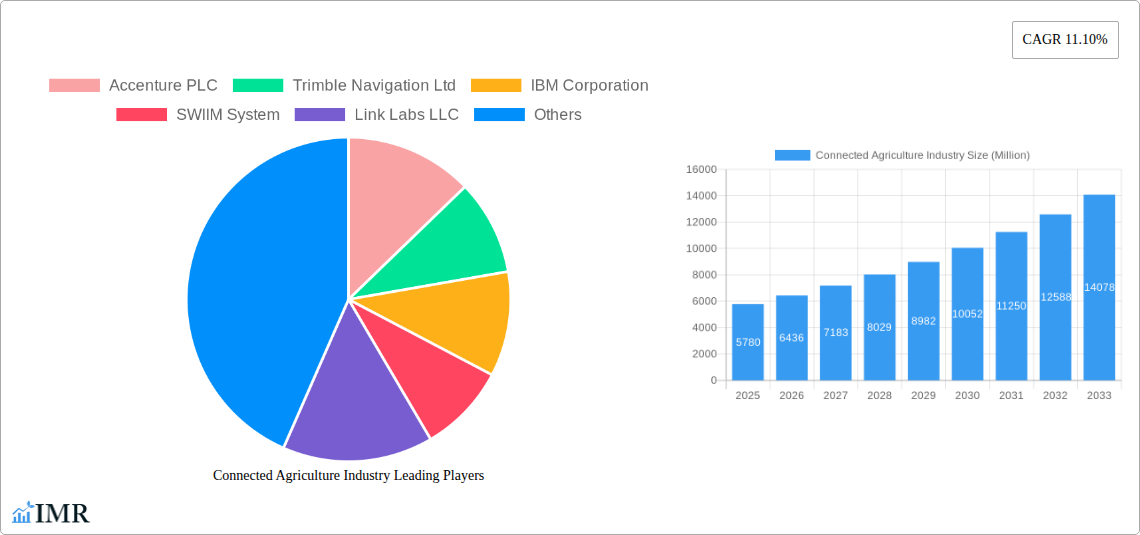
The Connected Agriculture market is experiencing robust growth, projected to reach a market size of $5.78 billion in 2025 and exhibiting a Compound Annual Growth Rate (CAGR) of 11.10%. This expansion is fueled by several key drivers. The increasing adoption of precision farming techniques, driven by the need for enhanced efficiency and sustainability in agricultural practices, is a major catalyst. Technological advancements in areas like IoT sensors, data analytics, and AI-powered decision support systems are enabling farmers to optimize resource utilization, improve crop yields, and reduce operational costs. Furthermore, government initiatives promoting digital agriculture and the rising penetration of high-speed internet in rural areas are further accelerating market growth. The market is segmented by component (solutions and supervisory control services) and application (smart logistics, smart irrigation, and farming planning and management). North America currently holds a significant market share, driven by early adoption of connected agriculture technologies and a well-established technological infrastructure. However, the Asia-Pacific region is poised for significant growth due to its large agricultural sector and increasing investments in agricultural modernization. Challenges remain, including the high initial investment costs associated with implementing connected agriculture technologies, concerns regarding data security and privacy, and the digital literacy gap among farmers in certain regions. Nevertheless, the long-term outlook for the Connected Agriculture market remains highly positive, with continuous technological innovation and expanding adoption expected to drive sustained growth throughout the forecast period (2025-2033).
The competitive landscape is characterized by a mix of established technology giants and specialized agricultural technology companies. Accenture, Trimble, IBM, and Cisco are among the prominent players, offering a range of solutions and services across the value chain. These companies are strategically expanding their offerings and forming partnerships to capitalize on the growing market opportunities. The success of individual companies will depend on their ability to deliver innovative and user-friendly solutions, effectively address the challenges related to data management and security, and build strong relationships with farmers and agricultural stakeholders. Future growth will be shaped by the integration of advanced technologies like blockchain for supply chain transparency, advancements in robotics and automation, and the development of more sophisticated data analytics capabilities to provide actionable insights for precision farming. The continued expansion of 5G networks will also play a crucial role in enhancing connectivity and enabling the wider adoption of real-time data-driven decision-making.
Connected Agriculture Industry Market Report: 2019-2033
This comprehensive report provides a detailed analysis of the Connected Agriculture industry, encompassing market dynamics, growth trends, regional performance, key players, and future outlook. With a study period spanning 2019-2033, a base year of 2025, and a forecast period of 2025-2033, this report is an indispensable resource for industry professionals, investors, and stakeholders seeking to understand and capitalize on the opportunities within this rapidly evolving sector. The report delves into both parent and child markets, offering a granular perspective on segments like Smart Irrigation, Smart Logistics, and Farming Planning & Management. The market is valued at xx Million in 2025 and is projected to reach xx Million by 2033.
Connected Agriculture Industry Market Dynamics & Structure
The Connected Agriculture market is characterized by a moderately consolidated structure, with several major players vying for market share. Accenture PLC, Trimble Navigation Ltd, IBM Corporation, and other technology giants play significant roles, alongside specialized agricultural technology providers. Technological innovation, particularly in areas like IoT sensors, AI-powered analytics, and cloud computing, is a key driver of market growth. Regulatory frameworks related to data privacy, cybersecurity, and agricultural practices influence market dynamics. Competitive pressures arise from both established players and emerging startups offering innovative solutions.
- Market Concentration: Moderately consolidated, with top 5 players holding approximately xx% market share in 2025.
- Technological Innovation: Key drivers include advancements in AI, IoT, and cloud computing, enabling precision agriculture and data-driven decision-making.
- Regulatory Framework: Compliance with data privacy regulations (GDPR, CCPA) and agricultural standards is crucial.
- Competitive Substitutes: Traditional farming methods and less sophisticated technologies represent competitive substitutes.
- End-User Demographics: Predominantly large-scale commercial farms, but increasing adoption among small and medium-sized farms.
- M&A Trends: A growing number of mergers and acquisitions (xx deals in the last 5 years) illustrate the industry's consolidation and expansion.
Connected Agriculture Industry Growth Trends & Insights
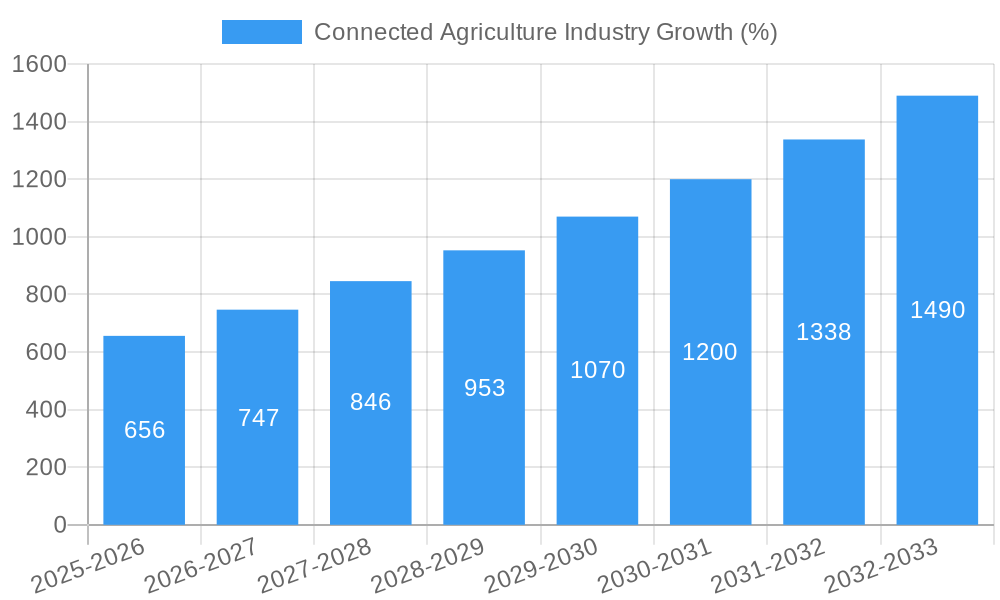
The Connected Agriculture market has witnessed robust growth over the historical period (2019-2024), driven by increasing adoption of precision farming techniques and a rising demand for improved efficiency and sustainability. The market size experienced a CAGR of xx% during this period, reaching xx Million in 2024. The forecast period (2025-2033) is expected to show continued growth, propelled by factors like technological advancements, increasing government support for digital agriculture, and growing awareness among farmers about the benefits of connected solutions. Market penetration is expected to increase from xx% in 2025 to xx% by 2033. Technological disruptions, particularly in areas like robotics and drone technology, will significantly impact market dynamics. Shifting consumer behavior towards sustainable and efficient agricultural practices further fuels the market's expansion.
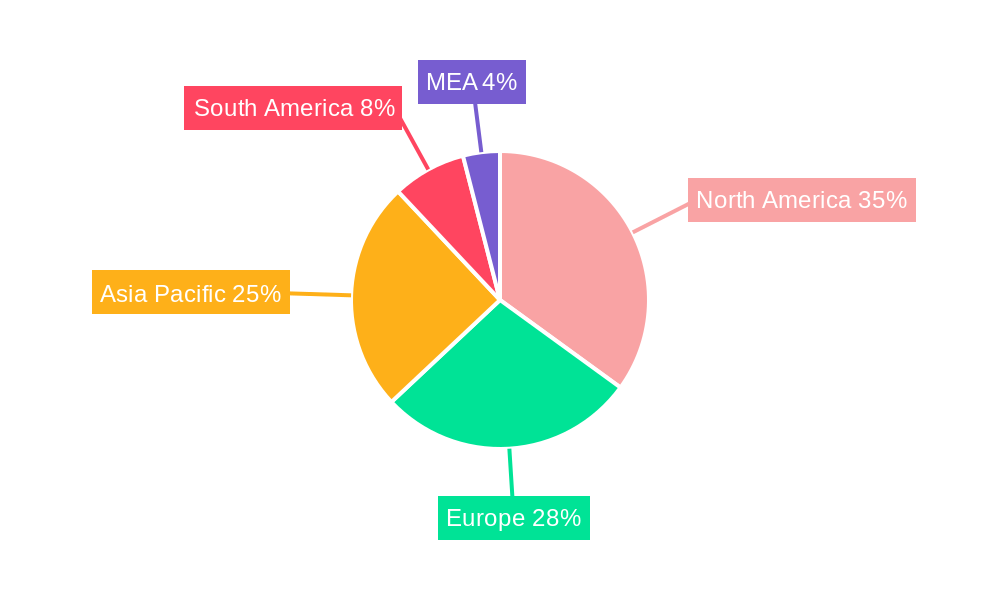
Dominant Regions, Countries, or Segments in Connected Agriculture Industry
North America and Europe currently hold the largest market share in the Connected Agriculture industry, driven by high technology adoption rates and supportive government policies. However, Asia-Pacific is expected to exhibit the highest growth rate during the forecast period, fueled by increasing agricultural production and investments in agricultural technology.
By Component: Solutions segment dominates due to high demand for integrated platforms and software.
By Supervisory Control: Services segment shows faster growth, reflecting increased need for remote monitoring and data analysis.
By Application: Smart Irrigation, Farming Planning & Management, and Smart Logistics all show significant growth potential. Smart irrigation systems are witnessing rapid adoption due to water scarcity concerns.
- Key Drivers: Government initiatives promoting digital agriculture, investments in rural infrastructure, and farmer awareness of cost-effectiveness.
- Dominance Factors: Strong technological infrastructure, favorable government policies, high farmer adoption rates in developed regions.
Connected Agriculture Industry Product Landscape
The Connected Agriculture industry offers a diverse range of products, including sensors, software platforms, data analytics tools, and precision farming equipment. These products are designed to improve farm efficiency, optimize resource use, and enhance crop yield. Recent innovations focus on AI-powered decision support systems, autonomous farming equipment, and advanced data analytics capabilities. Unique selling propositions often center on enhanced precision, improved data integration, and reduced operational costs.
Key Drivers, Barriers & Challenges in Connected Agriculture Industry
Key Drivers:
- Increasing demand for enhanced farm efficiency and productivity.
- Rising adoption of precision agriculture techniques.
- Technological advancements (AI, IoT, cloud computing).
- Government initiatives supporting digital agriculture.
Key Challenges:
- High initial investment costs for technology adoption.
- Lack of digital literacy and technical expertise among farmers.
- Concerns about data security and privacy.
- Interoperability issues between different systems and platforms. This leads to an estimated xx Million loss in revenue annually.
Emerging Opportunities in Connected Agriculture Industry
- Expanding adoption in developing countries.
- Integration of blockchain technology for supply chain traceability.
- Growth of precision livestock farming applications.
- Development of sustainable and environmentally friendly agricultural practices.
Growth Accelerators in the Connected Agriculture Industry
Technological breakthroughs in areas like AI, robotics, and drone technology will continue to drive growth. Strategic partnerships between technology companies and agricultural businesses will foster innovation and market expansion. Government policies promoting the adoption of digital agriculture will further fuel market growth.
Key Players Shaping the Connected Agriculture Industry Market
- Accenture PLC
- Trimble Navigation Ltd
- IBM Corporation
- SWIIM System
- Link Labs LLC
- Cisco Systems Inc
- Microsoft Corporation
- Orange Business Services
- SAP SE
- Vodafone Group PLC
Notable Milestones in Connected Agriculture Industry Sector
- November 2023: AGCO acquired FarmFacts GmbH, expanding its Farm Management Information Software (FMIS) capabilities.
- September 2023: John Deere and Yara partnered to combine agronomic expertise with precision technology, boosting fertilizer efficiency.
In-Depth Connected Agriculture Industry Market Outlook
The Connected Agriculture market is poised for continued strong growth in the coming years, driven by technological advancements, increasing farmer adoption, and supportive government policies. Strategic partnerships and investments in innovative solutions will further accelerate market expansion, creating significant opportunities for industry players. The focus on sustainability and efficiency will also shape future market developments, leading to a more data-driven and technologically advanced agricultural sector.
Connected Agriculture Industry Segmentation
-
1. Component
-
1.1. Solution
- 1.1.1. Network Management
- 1.1.2. Agriculture Asset Management
- 1.1.3. Supervisory Control
- 1.2. Service
-
1.1. Solution
-
2. Application
- 2.1. Smart Logistics
- 2.2. Smart Irrigation
- 2.3. Farming Planning and Management
Connected Agriculture Industry Segmentation By Geography
-
1. North America
- 1.1. United States
- 1.2. Canada
-
2. Europe
- 2.1. Germany
- 2.2. United Kingdom
- 2.3. France
- 2.4. Rest of Europe
-
3. Asia Pacific
- 3.1. China
- 3.2. Japan
- 3.3. India
- 3.4. Rest of Asia Pacific
- 4. Latin America
- 5. Middle East and Africa
Connected Agriculture Industry REPORT HIGHLIGHTS
| Aspects | Details |
|---|---|
| Study Period | 2019-2033 |
| Base Year | 2024 |
| Estimated Year | 2025 |
| Forecast Period | 2025-2033 |
| Historical Period | 2019-2024 |
| Growth Rate | CAGR of 11.10% from 2019-2033 |
| Segmentation |
|
Table of Contents
- 1. Introduction
- 1.1. Research Scope
- 1.2. Market Segmentation
- 1.3. Research Methodology
- 1.4. Definitions and Assumptions
- 2. Executive Summary
- 2.1. Introduction
- 3. Market Dynamics
- 3.1. Introduction
- 3.2. Market Drivers
- 3.2.1. Emergence of BYOD (Bring Your Own Drone) in Connected Agriculture; Upsurge in Demand for Smart Water Management Systems
- 3.3. Market Restrains
- 3.3.1. Steep Learning Curve Regarding Connected Agriculture
- 3.4. Market Trends
- 3.4.1 By Application
- 3.4.2 Smart Irrigation is Analyzed to Witness Substantial Growth
- 4. Market Factor Analysis
- 4.1. Porters Five Forces
- 4.2. Supply/Value Chain
- 4.3. PESTEL analysis
- 4.4. Market Entropy
- 4.5. Patent/Trademark Analysis
- 5. Global Connected Agriculture Industry Analysis, Insights and Forecast, 2019-2031
- 5.1. Market Analysis, Insights and Forecast - by Component
- 5.1.1. Solution
- 5.1.1.1. Network Management
- 5.1.1.2. Agriculture Asset Management
- 5.1.1.3. Supervisory Control
- 5.1.2. Service
- 5.1.1. Solution
- 5.2. Market Analysis, Insights and Forecast - by Application
- 5.2.1. Smart Logistics
- 5.2.2. Smart Irrigation
- 5.2.3. Farming Planning and Management
- 5.3. Market Analysis, Insights and Forecast - by Region
- 5.3.1. North America
- 5.3.2. Europe
- 5.3.3. Asia Pacific
- 5.3.4. Latin America
- 5.3.5. Middle East and Africa
- 5.1. Market Analysis, Insights and Forecast - by Component
- 6. North America Connected Agriculture Industry Analysis, Insights and Forecast, 2019-2031
- 6.1. Market Analysis, Insights and Forecast - by Component
- 6.1.1. Solution
- 6.1.1.1. Network Management
- 6.1.1.2. Agriculture Asset Management
- 6.1.1.3. Supervisory Control
- 6.1.2. Service
- 6.1.1. Solution
- 6.2. Market Analysis, Insights and Forecast - by Application
- 6.2.1. Smart Logistics
- 6.2.2. Smart Irrigation
- 6.2.3. Farming Planning and Management
- 6.1. Market Analysis, Insights and Forecast - by Component
- 7. Europe Connected Agriculture Industry Analysis, Insights and Forecast, 2019-2031
- 7.1. Market Analysis, Insights and Forecast - by Component
- 7.1.1. Solution
- 7.1.1.1. Network Management
- 7.1.1.2. Agriculture Asset Management
- 7.1.1.3. Supervisory Control
- 7.1.2. Service
- 7.1.1. Solution
- 7.2. Market Analysis, Insights and Forecast - by Application
- 7.2.1. Smart Logistics
- 7.2.2. Smart Irrigation
- 7.2.3. Farming Planning and Management
- 7.1. Market Analysis, Insights and Forecast - by Component
- 8. Asia Pacific Connected Agriculture Industry Analysis, Insights and Forecast, 2019-2031
- 8.1. Market Analysis, Insights and Forecast - by Component
- 8.1.1. Solution
- 8.1.1.1. Network Management
- 8.1.1.2. Agriculture Asset Management
- 8.1.1.3. Supervisory Control
- 8.1.2. Service
- 8.1.1. Solution
- 8.2. Market Analysis, Insights and Forecast - by Application
- 8.2.1. Smart Logistics
- 8.2.2. Smart Irrigation
- 8.2.3. Farming Planning and Management
- 8.1. Market Analysis, Insights and Forecast - by Component
- 9. Latin America Connected Agriculture Industry Analysis, Insights and Forecast, 2019-2031
- 9.1. Market Analysis, Insights and Forecast - by Component
- 9.1.1. Solution
- 9.1.1.1. Network Management
- 9.1.1.2. Agriculture Asset Management
- 9.1.1.3. Supervisory Control
- 9.1.2. Service
- 9.1.1. Solution
- 9.2. Market Analysis, Insights and Forecast - by Application
- 9.2.1. Smart Logistics
- 9.2.2. Smart Irrigation
- 9.2.3. Farming Planning and Management
- 9.1. Market Analysis, Insights and Forecast - by Component
- 10. Middle East and Africa Connected Agriculture Industry Analysis, Insights and Forecast, 2019-2031
- 10.1. Market Analysis, Insights and Forecast - by Component
- 10.1.1. Solution
- 10.1.1.1. Network Management
- 10.1.1.2. Agriculture Asset Management
- 10.1.1.3. Supervisory Control
- 10.1.2. Service
- 10.1.1. Solution
- 10.2. Market Analysis, Insights and Forecast - by Application
- 10.2.1. Smart Logistics
- 10.2.2. Smart Irrigation
- 10.2.3. Farming Planning and Management
- 10.1. Market Analysis, Insights and Forecast - by Component
- 11. North America Connected Agriculture Industry Analysis, Insights and Forecast, 2019-2031
- 11.1. Market Analysis, Insights and Forecast - By Country/Sub-region
- 11.1.1 United States
- 11.1.2 Canada
- 11.1.3 Mexico
- 12. Europe Connected Agriculture Industry Analysis, Insights and Forecast, 2019-2031
- 12.1. Market Analysis, Insights and Forecast - By Country/Sub-region
- 12.1.1 Germany
- 12.1.2 United Kingdom
- 12.1.3 France
- 12.1.4 Spain
- 12.1.5 Italy
- 12.1.6 Spain
- 12.1.7 Belgium
- 12.1.8 Netherland
- 12.1.9 Nordics
- 12.1.10 Rest of Europe
- 13. Asia Pacific Connected Agriculture Industry Analysis, Insights and Forecast, 2019-2031
- 13.1. Market Analysis, Insights and Forecast - By Country/Sub-region
- 13.1.1 China
- 13.1.2 Japan
- 13.1.3 India
- 13.1.4 South Korea
- 13.1.5 Southeast Asia
- 13.1.6 Australia
- 13.1.7 Indonesia
- 13.1.8 Phillipes
- 13.1.9 Singapore
- 13.1.10 Thailandc
- 13.1.11 Rest of Asia Pacific
- 14. South America Connected Agriculture Industry Analysis, Insights and Forecast, 2019-2031
- 14.1. Market Analysis, Insights and Forecast - By Country/Sub-region
- 14.1.1 Brazil
- 14.1.2 Argentina
- 14.1.3 Peru
- 14.1.4 Chile
- 14.1.5 Colombia
- 14.1.6 Ecuador
- 14.1.7 Venezuela
- 14.1.8 Rest of South America
- 15. North America Connected Agriculture Industry Analysis, Insights and Forecast, 2019-2031
- 15.1. Market Analysis, Insights and Forecast - By Country/Sub-region
- 15.1.1 United States
- 15.1.2 Canada
- 15.1.3 Mexico
- 16. MEA Connected Agriculture Industry Analysis, Insights and Forecast, 2019-2031
- 16.1. Market Analysis, Insights and Forecast - By Country/Sub-region
- 16.1.1 United Arab Emirates
- 16.1.2 Saudi Arabia
- 16.1.3 South Africa
- 16.1.4 Rest of Middle East and Africa
- 17. Competitive Analysis
- 17.1. Global Market Share Analysis 2024
- 17.2. Company Profiles
- 17.2.1 Accenture PLC
- 17.2.1.1. Overview
- 17.2.1.2. Products
- 17.2.1.3. SWOT Analysis
- 17.2.1.4. Recent Developments
- 17.2.1.5. Financials (Based on Availability)
- 17.2.2 Trimble Navigation Ltd
- 17.2.2.1. Overview
- 17.2.2.2. Products
- 17.2.2.3. SWOT Analysis
- 17.2.2.4. Recent Developments
- 17.2.2.5. Financials (Based on Availability)
- 17.2.3 IBM Corporation
- 17.2.3.1. Overview
- 17.2.3.2. Products
- 17.2.3.3. SWOT Analysis
- 17.2.3.4. Recent Developments
- 17.2.3.5. Financials (Based on Availability)
- 17.2.4 SWIIM System
- 17.2.4.1. Overview
- 17.2.4.2. Products
- 17.2.4.3. SWOT Analysis
- 17.2.4.4. Recent Developments
- 17.2.4.5. Financials (Based on Availability)
- 17.2.5 Link Labs LLC
- 17.2.5.1. Overview
- 17.2.5.2. Products
- 17.2.5.3. SWOT Analysis
- 17.2.5.4. Recent Developments
- 17.2.5.5. Financials (Based on Availability)
- 17.2.6 Cisco Systems Inc
- 17.2.6.1. Overview
- 17.2.6.2. Products
- 17.2.6.3. SWOT Analysis
- 17.2.6.4. Recent Developments
- 17.2.6.5. Financials (Based on Availability)
- 17.2.7 Microsoft Corporation
- 17.2.7.1. Overview
- 17.2.7.2. Products
- 17.2.7.3. SWOT Analysis
- 17.2.7.4. Recent Developments
- 17.2.7.5. Financials (Based on Availability)
- 17.2.8 Orange Business Services
- 17.2.8.1. Overview
- 17.2.8.2. Products
- 17.2.8.3. SWOT Analysis
- 17.2.8.4. Recent Developments
- 17.2.8.5. Financials (Based on Availability)
- 17.2.9 SAP SE
- 17.2.9.1. Overview
- 17.2.9.2. Products
- 17.2.9.3. SWOT Analysis
- 17.2.9.4. Recent Developments
- 17.2.9.5. Financials (Based on Availability)
- 17.2.10 Vodafone Group PLC
- 17.2.10.1. Overview
- 17.2.10.2. Products
- 17.2.10.3. SWOT Analysis
- 17.2.10.4. Recent Developments
- 17.2.10.5. Financials (Based on Availability)
- 17.2.1 Accenture PLC
List of Figures
- Figure 1: Global Connected Agriculture Industry Revenue Breakdown (Million, %) by Region 2024 & 2032
- Figure 2: North America Connected Agriculture Industry Revenue (Million), by Country 2024 & 2032
- Figure 3: North America Connected Agriculture Industry Revenue Share (%), by Country 2024 & 2032
- Figure 4: Europe Connected Agriculture Industry Revenue (Million), by Country 2024 & 2032
- Figure 5: Europe Connected Agriculture Industry Revenue Share (%), by Country 2024 & 2032
- Figure 6: Asia Pacific Connected Agriculture Industry Revenue (Million), by Country 2024 & 2032
- Figure 7: Asia Pacific Connected Agriculture Industry Revenue Share (%), by Country 2024 & 2032
- Figure 8: South America Connected Agriculture Industry Revenue (Million), by Country 2024 & 2032
- Figure 9: South America Connected Agriculture Industry Revenue Share (%), by Country 2024 & 2032
- Figure 10: North America Connected Agriculture Industry Revenue (Million), by Country 2024 & 2032
- Figure 11: North America Connected Agriculture Industry Revenue Share (%), by Country 2024 & 2032
- Figure 12: MEA Connected Agriculture Industry Revenue (Million), by Country 2024 & 2032
- Figure 13: MEA Connected Agriculture Industry Revenue Share (%), by Country 2024 & 2032
- Figure 14: North America Connected Agriculture Industry Revenue (Million), by Component 2024 & 2032
- Figure 15: North America Connected Agriculture Industry Revenue Share (%), by Component 2024 & 2032
- Figure 16: North America Connected Agriculture Industry Revenue (Million), by Application 2024 & 2032
- Figure 17: North America Connected Agriculture Industry Revenue Share (%), by Application 2024 & 2032
- Figure 18: North America Connected Agriculture Industry Revenue (Million), by Country 2024 & 2032
- Figure 19: North America Connected Agriculture Industry Revenue Share (%), by Country 2024 & 2032
- Figure 20: Europe Connected Agriculture Industry Revenue (Million), by Component 2024 & 2032
- Figure 21: Europe Connected Agriculture Industry Revenue Share (%), by Component 2024 & 2032
- Figure 22: Europe Connected Agriculture Industry Revenue (Million), by Application 2024 & 2032
- Figure 23: Europe Connected Agriculture Industry Revenue Share (%), by Application 2024 & 2032
- Figure 24: Europe Connected Agriculture Industry Revenue (Million), by Country 2024 & 2032
- Figure 25: Europe Connected Agriculture Industry Revenue Share (%), by Country 2024 & 2032
- Figure 26: Asia Pacific Connected Agriculture Industry Revenue (Million), by Component 2024 & 2032
- Figure 27: Asia Pacific Connected Agriculture Industry Revenue Share (%), by Component 2024 & 2032
- Figure 28: Asia Pacific Connected Agriculture Industry Revenue (Million), by Application 2024 & 2032
- Figure 29: Asia Pacific Connected Agriculture Industry Revenue Share (%), by Application 2024 & 2032
- Figure 30: Asia Pacific Connected Agriculture Industry Revenue (Million), by Country 2024 & 2032
- Figure 31: Asia Pacific Connected Agriculture Industry Revenue Share (%), by Country 2024 & 2032
- Figure 32: Latin America Connected Agriculture Industry Revenue (Million), by Component 2024 & 2032
- Figure 33: Latin America Connected Agriculture Industry Revenue Share (%), by Component 2024 & 2032
- Figure 34: Latin America Connected Agriculture Industry Revenue (Million), by Application 2024 & 2032
- Figure 35: Latin America Connected Agriculture Industry Revenue Share (%), by Application 2024 & 2032
- Figure 36: Latin America Connected Agriculture Industry Revenue (Million), by Country 2024 & 2032
- Figure 37: Latin America Connected Agriculture Industry Revenue Share (%), by Country 2024 & 2032
- Figure 38: Middle East and Africa Connected Agriculture Industry Revenue (Million), by Component 2024 & 2032
- Figure 39: Middle East and Africa Connected Agriculture Industry Revenue Share (%), by Component 2024 & 2032
- Figure 40: Middle East and Africa Connected Agriculture Industry Revenue (Million), by Application 2024 & 2032
- Figure 41: Middle East and Africa Connected Agriculture Industry Revenue Share (%), by Application 2024 & 2032
- Figure 42: Middle East and Africa Connected Agriculture Industry Revenue (Million), by Country 2024 & 2032
- Figure 43: Middle East and Africa Connected Agriculture Industry Revenue Share (%), by Country 2024 & 2032
List of Tables
- Table 1: Global Connected Agriculture Industry Revenue Million Forecast, by Region 2019 & 2032
- Table 2: Global Connected Agriculture Industry Revenue Million Forecast, by Component 2019 & 2032
- Table 3: Global Connected Agriculture Industry Revenue Million Forecast, by Application 2019 & 2032
- Table 4: Global Connected Agriculture Industry Revenue Million Forecast, by Region 2019 & 2032
- Table 5: Global Connected Agriculture Industry Revenue Million Forecast, by Country 2019 & 2032
- Table 6: United States Connected Agriculture Industry Revenue (Million) Forecast, by Application 2019 & 2032
- Table 7: Canada Connected Agriculture Industry Revenue (Million) Forecast, by Application 2019 & 2032
- Table 8: Mexico Connected Agriculture Industry Revenue (Million) Forecast, by Application 2019 & 2032
- Table 9: Global Connected Agriculture Industry Revenue Million Forecast, by Country 2019 & 2032
- Table 10: Germany Connected Agriculture Industry Revenue (Million) Forecast, by Application 2019 & 2032
- Table 11: United Kingdom Connected Agriculture Industry Revenue (Million) Forecast, by Application 2019 & 2032
- Table 12: France Connected Agriculture Industry Revenue (Million) Forecast, by Application 2019 & 2032
- Table 13: Spain Connected Agriculture Industry Revenue (Million) Forecast, by Application 2019 & 2032
- Table 14: Italy Connected Agriculture Industry Revenue (Million) Forecast, by Application 2019 & 2032
- Table 15: Spain Connected Agriculture Industry Revenue (Million) Forecast, by Application 2019 & 2032
- Table 16: Belgium Connected Agriculture Industry Revenue (Million) Forecast, by Application 2019 & 2032
- Table 17: Netherland Connected Agriculture Industry Revenue (Million) Forecast, by Application 2019 & 2032
- Table 18: Nordics Connected Agriculture Industry Revenue (Million) Forecast, by Application 2019 & 2032
- Table 19: Rest of Europe Connected Agriculture Industry Revenue (Million) Forecast, by Application 2019 & 2032
- Table 20: Global Connected Agriculture Industry Revenue Million Forecast, by Country 2019 & 2032
- Table 21: China Connected Agriculture Industry Revenue (Million) Forecast, by Application 2019 & 2032
- Table 22: Japan Connected Agriculture Industry Revenue (Million) Forecast, by Application 2019 & 2032
- Table 23: India Connected Agriculture Industry Revenue (Million) Forecast, by Application 2019 & 2032
- Table 24: South Korea Connected Agriculture Industry Revenue (Million) Forecast, by Application 2019 & 2032
- Table 25: Southeast Asia Connected Agriculture Industry Revenue (Million) Forecast, by Application 2019 & 2032
- Table 26: Australia Connected Agriculture Industry Revenue (Million) Forecast, by Application 2019 & 2032
- Table 27: Indonesia Connected Agriculture Industry Revenue (Million) Forecast, by Application 2019 & 2032
- Table 28: Phillipes Connected Agriculture Industry Revenue (Million) Forecast, by Application 2019 & 2032
- Table 29: Singapore Connected Agriculture Industry Revenue (Million) Forecast, by Application 2019 & 2032
- Table 30: Thailandc Connected Agriculture Industry Revenue (Million) Forecast, by Application 2019 & 2032
- Table 31: Rest of Asia Pacific Connected Agriculture Industry Revenue (Million) Forecast, by Application 2019 & 2032
- Table 32: Global Connected Agriculture Industry Revenue Million Forecast, by Country 2019 & 2032
- Table 33: Brazil Connected Agriculture Industry Revenue (Million) Forecast, by Application 2019 & 2032
- Table 34: Argentina Connected Agriculture Industry Revenue (Million) Forecast, by Application 2019 & 2032
- Table 35: Peru Connected Agriculture Industry Revenue (Million) Forecast, by Application 2019 & 2032
- Table 36: Chile Connected Agriculture Industry Revenue (Million) Forecast, by Application 2019 & 2032
- Table 37: Colombia Connected Agriculture Industry Revenue (Million) Forecast, by Application 2019 & 2032
- Table 38: Ecuador Connected Agriculture Industry Revenue (Million) Forecast, by Application 2019 & 2032
- Table 39: Venezuela Connected Agriculture Industry Revenue (Million) Forecast, by Application 2019 & 2032
- Table 40: Rest of South America Connected Agriculture Industry Revenue (Million) Forecast, by Application 2019 & 2032
- Table 41: Global Connected Agriculture Industry Revenue Million Forecast, by Country 2019 & 2032
- Table 42: United States Connected Agriculture Industry Revenue (Million) Forecast, by Application 2019 & 2032
- Table 43: Canada Connected Agriculture Industry Revenue (Million) Forecast, by Application 2019 & 2032
- Table 44: Mexico Connected Agriculture Industry Revenue (Million) Forecast, by Application 2019 & 2032
- Table 45: Global Connected Agriculture Industry Revenue Million Forecast, by Country 2019 & 2032
- Table 46: United Arab Emirates Connected Agriculture Industry Revenue (Million) Forecast, by Application 2019 & 2032
- Table 47: Saudi Arabia Connected Agriculture Industry Revenue (Million) Forecast, by Application 2019 & 2032
- Table 48: South Africa Connected Agriculture Industry Revenue (Million) Forecast, by Application 2019 & 2032
- Table 49: Rest of Middle East and Africa Connected Agriculture Industry Revenue (Million) Forecast, by Application 2019 & 2032
- Table 50: Global Connected Agriculture Industry Revenue Million Forecast, by Component 2019 & 2032
- Table 51: Global Connected Agriculture Industry Revenue Million Forecast, by Application 2019 & 2032
- Table 52: Global Connected Agriculture Industry Revenue Million Forecast, by Country 2019 & 2032
- Table 53: United States Connected Agriculture Industry Revenue (Million) Forecast, by Application 2019 & 2032
- Table 54: Canada Connected Agriculture Industry Revenue (Million) Forecast, by Application 2019 & 2032
- Table 55: Global Connected Agriculture Industry Revenue Million Forecast, by Component 2019 & 2032
- Table 56: Global Connected Agriculture Industry Revenue Million Forecast, by Application 2019 & 2032
- Table 57: Global Connected Agriculture Industry Revenue Million Forecast, by Country 2019 & 2032
- Table 58: Germany Connected Agriculture Industry Revenue (Million) Forecast, by Application 2019 & 2032
- Table 59: United Kingdom Connected Agriculture Industry Revenue (Million) Forecast, by Application 2019 & 2032
- Table 60: France Connected Agriculture Industry Revenue (Million) Forecast, by Application 2019 & 2032
- Table 61: Rest of Europe Connected Agriculture Industry Revenue (Million) Forecast, by Application 2019 & 2032
- Table 62: Global Connected Agriculture Industry Revenue Million Forecast, by Component 2019 & 2032
- Table 63: Global Connected Agriculture Industry Revenue Million Forecast, by Application 2019 & 2032
- Table 64: Global Connected Agriculture Industry Revenue Million Forecast, by Country 2019 & 2032
- Table 65: China Connected Agriculture Industry Revenue (Million) Forecast, by Application 2019 & 2032
- Table 66: Japan Connected Agriculture Industry Revenue (Million) Forecast, by Application 2019 & 2032
- Table 67: India Connected Agriculture Industry Revenue (Million) Forecast, by Application 2019 & 2032
- Table 68: Rest of Asia Pacific Connected Agriculture Industry Revenue (Million) Forecast, by Application 2019 & 2032
- Table 69: Global Connected Agriculture Industry Revenue Million Forecast, by Component 2019 & 2032
- Table 70: Global Connected Agriculture Industry Revenue Million Forecast, by Application 2019 & 2032
- Table 71: Global Connected Agriculture Industry Revenue Million Forecast, by Country 2019 & 2032
- Table 72: Global Connected Agriculture Industry Revenue Million Forecast, by Component 2019 & 2032
- Table 73: Global Connected Agriculture Industry Revenue Million Forecast, by Application 2019 & 2032
- Table 74: Global Connected Agriculture Industry Revenue Million Forecast, by Country 2019 & 2032
Frequently Asked Questions
1. What is the projected Compound Annual Growth Rate (CAGR) of the Connected Agriculture Industry?
The projected CAGR is approximately 11.10%.
2. Which companies are prominent players in the Connected Agriculture Industry?
Key companies in the market include Accenture PLC, Trimble Navigation Ltd, IBM Corporation, SWIIM System, Link Labs LLC, Cisco Systems Inc, Microsoft Corporation, Orange Business Services, SAP SE, Vodafone Group PLC.
3. What are the main segments of the Connected Agriculture Industry?
The market segments include Component, Application.
4. Can you provide details about the market size?
The market size is estimated to be USD 5.78 Million as of 2022.
5. What are some drivers contributing to market growth?
Emergence of BYOD (Bring Your Own Drone) in Connected Agriculture; Upsurge in Demand for Smart Water Management Systems.
6. What are the notable trends driving market growth?
By Application. Smart Irrigation is Analyzed to Witness Substantial Growth.
7. Are there any restraints impacting market growth?
Steep Learning Curve Regarding Connected Agriculture.
8. Can you provide examples of recent developments in the market?
November 2023 - AGCO acquired digital assets from FarmFacts GmbH, a Farm Management Information Software (FMIS) firm in Pfarrkirchen, Germany, and BayWa AG group subsidiary. FarmFacts specializes in software for farmers and service providers to generate field action plans from prescription maps to guidance line creation. The acquisition increases AGCO’s FMIS offering and software development capabilities to serve farmers’ data management needs.
9. What pricing options are available for accessing the report?
Pricing options include single-user, multi-user, and enterprise licenses priced at USD 4750, USD 5250, and USD 8750 respectively.
10. Is the market size provided in terms of value or volume?
The market size is provided in terms of value, measured in Million.
11. Are there any specific market keywords associated with the report?
Yes, the market keyword associated with the report is "Connected Agriculture Industry," which aids in identifying and referencing the specific market segment covered.
12. How do I determine which pricing option suits my needs best?
The pricing options vary based on user requirements and access needs. Individual users may opt for single-user licenses, while businesses requiring broader access may choose multi-user or enterprise licenses for cost-effective access to the report.
13. Are there any additional resources or data provided in the Connected Agriculture Industry report?
While the report offers comprehensive insights, it's advisable to review the specific contents or supplementary materials provided to ascertain if additional resources or data are available.
14. How can I stay updated on further developments or reports in the Connected Agriculture Industry?
To stay informed about further developments, trends, and reports in the Connected Agriculture Industry, consider subscribing to industry newsletters, following relevant companies and organizations, or regularly checking reputable industry news sources and publications.
Methodology
Step 1 - Identification of Relevant Samples Size from Population Database


Step 2 - Approaches for Defining Global Market Size (Value, Volume* & Price*)

Note*: In applicable scenarios
Step 3 - Data Sources
Primary Research
- Web Analytics
- Survey Reports
- Research Institute
- Latest Research Reports
- Opinion Leaders
Secondary Research
- Annual Reports
- White Paper
- Latest Press Release
- Industry Association
- Paid Database
- Investor Presentations

Step 4 - Data Triangulation
Involves using different sources of information in order to increase the validity of a study
These sources are likely to be stakeholders in a program - participants, other researchers, program staff, other community members, and so on.
Then we put all data in single framework & apply various statistical tools to find out the dynamic on the market.
During the analysis stage, feedback from the stakeholder groups would be compared to determine areas of agreement as well as areas of divergence
