

Key Insights
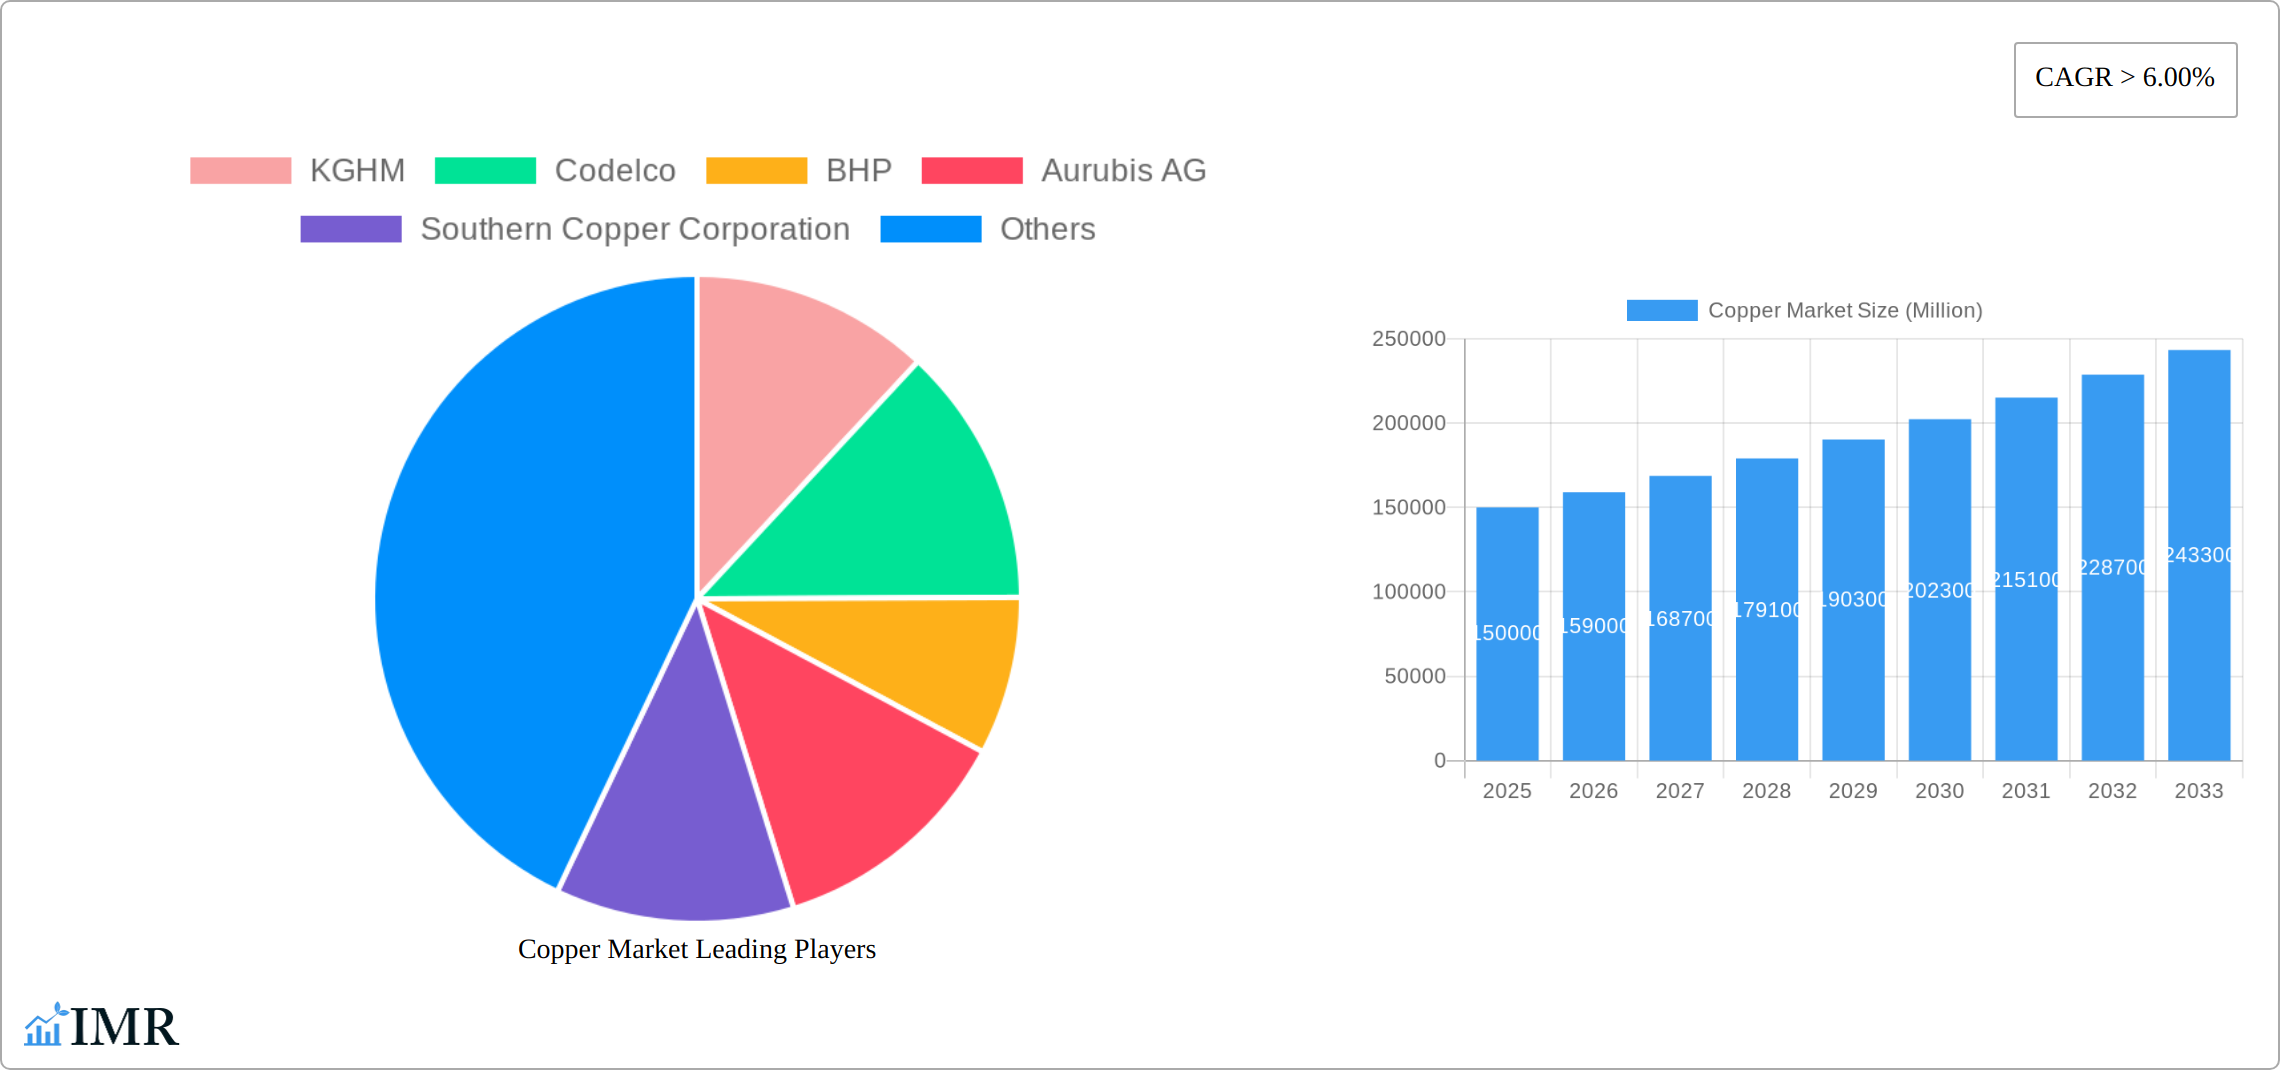
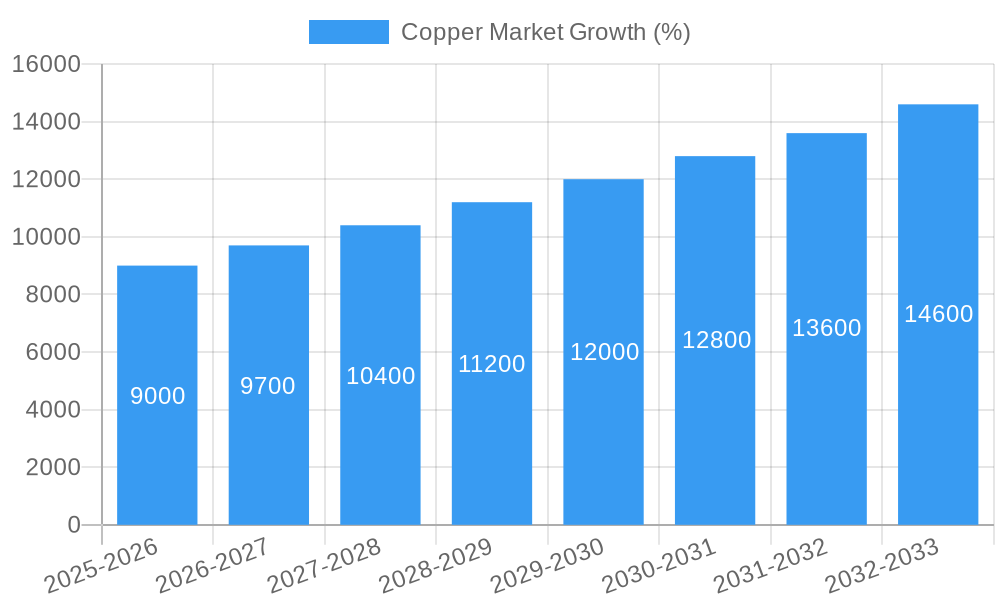
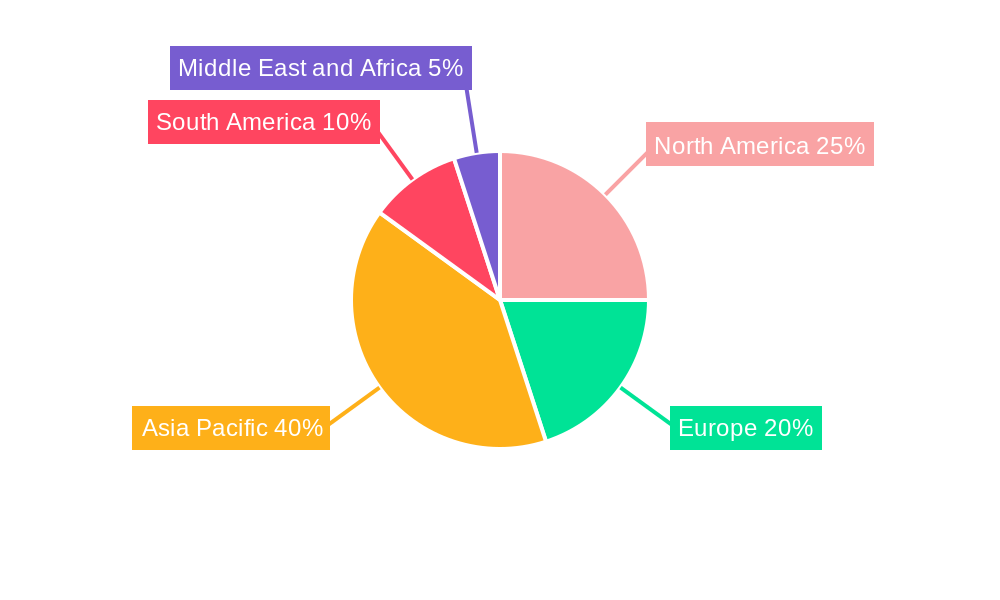
The global copper market, valued at approximately $150 billion in 2025, is projected to experience robust growth, exhibiting a Compound Annual Growth Rate (CAGR) exceeding 6% from 2025 to 2033. This expansion is primarily driven by the burgeoning demand from key end-user industries. The automotive and heavy equipment sector, fueled by the rise of electric vehicles and infrastructure development, is a significant growth catalyst. Construction activities globally, particularly in emerging economies experiencing rapid urbanization, further bolster copper consumption. Additionally, the increasing adoption of renewable energy technologies, including solar panels and wind turbines, significantly contributes to the market's upward trajectory. Technological advancements in electronics and industrial applications also play a pivotal role. While supply chain disruptions and fluctuating metal prices pose potential restraints, ongoing investments in mining and exploration efforts are expected to mitigate these challenges to a large extent. The Asia-Pacific region, specifically China and India, holds a dominant market share due to their substantial infrastructure projects and expanding manufacturing sectors. However, other regions like North America and Europe are also anticipated to experience considerable growth, driven by government initiatives promoting sustainable development and technological innovation. The competitive landscape is marked by major players including KGHM, Codelco, BHP, Aurubis AG, and others, who are constantly striving for operational efficiency and diversification to maintain their market positions.
The market segmentation reveals significant opportunities across various end-user industries. The automotive and heavy equipment sector's continued growth, driven by the global shift towards electric vehicles and the expansion of renewable energy infrastructure, promises substantial demand for copper. The construction sector, particularly in developing nations, offers another significant avenue for growth. Furthermore, the ongoing digital transformation and increasing adoption of advanced technologies in electronics and industrial applications create sustained demand for high-quality copper products. While challenges such as resource scarcity and environmental regulations exist, technological advancements in mining and recycling are expected to help address these issues. Strategic partnerships and mergers and acquisitions are likely to shape the competitive landscape further, driving innovation and efficiency within the industry. This dynamic interplay of factors suggests a positive outlook for the global copper market over the forecast period.
Copper Market: A Comprehensive Analysis (2019-2033)
This in-depth report provides a comprehensive analysis of the global copper market, encompassing market dynamics, growth trends, regional dominance, product landscape, key players, and future outlook. With a study period spanning 2019-2033, a base year of 2025, and a forecast period of 2025-2033, this report is an indispensable resource for industry professionals, investors, and strategic decision-makers. The report analyzes the parent market of metals and mining and the child market of copper.
Copper Market Dynamics & Structure
The copper market is characterized by moderate concentration, with several major players holding significant market share. Technological advancements, particularly in recycling and extraction techniques, are reshaping the industry landscape. Stringent environmental regulations are driving the adoption of sustainable practices, while the availability of substitute materials poses a competitive challenge. Mergers and acquisitions (M&A) activity has been significant, shaping market consolidation and influencing pricing dynamics. The end-user demographics are diverse, with construction, electrical & electronics, and automotive sectors being major consumers.
- Market Concentration: The top 10 players hold approximately xx% of the global market share (2024).
- M&A Activity: A total of xx M&A deals valued at xx Million USD were recorded between 2019 and 2024.
- Technological Innovation: Focus on enhancing extraction efficiency, developing advanced recycling technologies, and improving material properties.
- Regulatory Framework: Stringent environmental regulations are pushing towards sustainable mining and recycling practices.
- Competitive Substitutes: Aluminum and other conductive materials present competition in specific applications.
Copper Market Growth Trends & Insights
The global copper market experienced substantial growth during the historical period (2019-2024), driven by robust demand from key end-use industries. The market size reached xx Million units in 2024, exhibiting a CAGR of xx% during this period. Technological advancements in extraction, recycling, and applications have spurred market adoption. Shifting consumer preferences towards sustainable products are further driving growth. The forecast period (2025-2033) anticipates continued expansion, driven by infrastructure development in emerging economies and increasing electrification across various sectors. Market penetration is expected to reach xx% by 2033.
Dominant Regions, Countries, or Segments in Copper Market
The Electrical and Electronics segment currently dominates the copper market, followed by the Construction and Automotive and Heavy Equipment segments. Asia-Pacific and North America are leading regional markets. The strong growth in these segments is primarily attributed to increasing urbanization, infrastructure development, and the rise of electric vehicles.
- Key Drivers (Electrical & Electronics): Rising demand for electronics, increasing adoption of renewable energy technologies, and expansion of 5G networks.
- Key Drivers (Construction): Infrastructure development projects, including residential and commercial buildings, and rising construction activity in emerging economies.
- Key Drivers (Automotive & Heavy Equipment): Growth of the electric vehicle market and increasing use of copper in advanced automotive technologies.
- Regional Dominance: China remains a significant consumer and producer, while North America and Europe show steady growth.
Copper Market Product Landscape
The copper market offers a range of products, including refined copper, copper alloys, and copper-based composites. Product innovation focuses on enhancing conductivity, improving durability, and developing specialized alloys for specific applications. Key differentiators include high purity levels, specialized alloy compositions, and improved processability. Technological advancements center on improving recycling efficiency and developing sustainable sourcing practices.
Key Drivers, Barriers & Challenges in Copper Market
Key Drivers: Rising urbanization and infrastructure development, the growing electric vehicle market, and increasing demand for renewable energy technologies are key drivers.
Challenges & Restraints: Fluctuations in copper prices, supply chain disruptions, and environmental concerns pose significant challenges. The increasing adoption of substitute materials and geopolitical uncertainties are also potential restraints on market growth.
Emerging Opportunities in Copper Market
Untapped markets in developing countries present significant growth opportunities. The increasing adoption of copper in renewable energy technologies and electric vehicles offers significant potential. Innovative applications in advanced electronics and medical devices also provide lucrative opportunities.
Growth Accelerators in the Copper Market Industry
Technological advancements in extraction and recycling are key growth catalysts. Strategic partnerships between mining companies, manufacturers, and recyclers are enhancing supply chain efficiency. Expansion into new markets and diversification of product offerings are also fostering sustained growth.
Key Players Shaping the Copper Market Market
- KGHM
- Codelco
- BHP
- Aurubis AG
- Southern Copper Corporation
- Grupo Mexico
- Xstrata Plc
- Glencore
- Chinalco Shanghai Copper
- Freeport-McMoRan Copper & Gold
Notable Milestones in Copper Market Sector
- November 2021: Aurubis AG launched a new multi-metal recycling plant in Georgia, USA, with an annual capacity of 35,000 tons of blister copper.
- May 2021: Glencore announced plans to restart its Mutanda copper and cobalt mine in 2022, potentially easing market shortages.
In-Depth Copper Market Market Outlook
The copper market is poised for significant growth, driven by the increasing demand from key end-use sectors and technological advancements. Strategic investments in sustainable mining practices and recycling technologies will be crucial for long-term market sustainability. Companies focusing on innovation and efficient supply chain management are expected to gain a competitive edge in this expanding market.
Copper Market Segmentation
-
1. End-user Industry
- 1.1. Automotive and Heavy Equipment
- 1.2. Construction
- 1.3. Electrical and Electronics
- 1.4. Industrial
- 1.5. Other End-user Industry
Copper Market Segmentation By Geography
-
1. Asia Pacific
- 1.1. China
- 1.2. India
- 1.3. Japan
- 1.4. South Korea
- 1.5. Rest of Asia Pacific
-
2. North America
- 2.1. United States
- 2.2. Canada
- 2.3. Mexico
-
3. Europe
- 3.1. Germany
- 3.2. United Kingdom
- 3.3. France
- 3.4. Italy
- 3.5. Rest of Europe
-
4. South America
- 4.1. Brazil
- 4.2. Argentina
- 4.3. Rest of South America
-
5. Middle East and Africa
- 5.1. South Africa
- 5.2. UAE
- 5.3. Saudi Arabia
- 5.4. Rest of Middle East and Africa
Copper Market REPORT HIGHLIGHTS
| Aspects | Details |
|---|---|
| Study Period | 2019-2033 |
| Base Year | 2024 |
| Estimated Year | 2025 |
| Forecast Period | 2025-2033 |
| Historical Period | 2019-2024 |
| Growth Rate | CAGR of > 6.00% from 2019-2033 |
| Segmentation |
|
Table of Contents
- 1. Introduction
- 1.1. Research Scope
- 1.2. Market Segmentation
- 1.3. Research Methodology
- 1.4. Definitions and Assumptions
- 2. Executive Summary
- 2.1. Introduction
- 3. Market Dynamics
- 3.1. Introduction
- 3.2. Market Drivers
- 3.2.1. Growing Demand from Electronics and Construction Industry; Other Drivers
- 3.3. Market Restrains
- 3.3.1. Stringent Regulations Associated with Mining
- 3.4. Market Trends
- 3.4.1. Growing Demand for Electrical and Electronics Segment
- 4. Market Factor Analysis
- 4.1. Porters Five Forces
- 4.2. Supply/Value Chain
- 4.3. PESTEL analysis
- 4.4. Market Entropy
- 4.5. Patent/Trademark Analysis
- 5. Global Copper Market Analysis, Insights and Forecast, 2019-2031
- 5.1. Market Analysis, Insights and Forecast - by End-user Industry
- 5.1.1. Automotive and Heavy Equipment
- 5.1.2. Construction
- 5.1.3. Electrical and Electronics
- 5.1.4. Industrial
- 5.1.5. Other End-user Industry
- 5.2. Market Analysis, Insights and Forecast - by Region
- 5.2.1. Asia Pacific
- 5.2.2. North America
- 5.2.3. Europe
- 5.2.4. South America
- 5.2.5. Middle East and Africa
- 5.1. Market Analysis, Insights and Forecast - by End-user Industry
- 6. Asia Pacific Copper Market Analysis, Insights and Forecast, 2019-2031
- 6.1. Market Analysis, Insights and Forecast - by End-user Industry
- 6.1.1. Automotive and Heavy Equipment
- 6.1.2. Construction
- 6.1.3. Electrical and Electronics
- 6.1.4. Industrial
- 6.1.5. Other End-user Industry
- 6.1. Market Analysis, Insights and Forecast - by End-user Industry
- 7. North America Copper Market Analysis, Insights and Forecast, 2019-2031
- 7.1. Market Analysis, Insights and Forecast - by End-user Industry
- 7.1.1. Automotive and Heavy Equipment
- 7.1.2. Construction
- 7.1.3. Electrical and Electronics
- 7.1.4. Industrial
- 7.1.5. Other End-user Industry
- 7.1. Market Analysis, Insights and Forecast - by End-user Industry
- 8. Europe Copper Market Analysis, Insights and Forecast, 2019-2031
- 8.1. Market Analysis, Insights and Forecast - by End-user Industry
- 8.1.1. Automotive and Heavy Equipment
- 8.1.2. Construction
- 8.1.3. Electrical and Electronics
- 8.1.4. Industrial
- 8.1.5. Other End-user Industry
- 8.1. Market Analysis, Insights and Forecast - by End-user Industry
- 9. South America Copper Market Analysis, Insights and Forecast, 2019-2031
- 9.1. Market Analysis, Insights and Forecast - by End-user Industry
- 9.1.1. Automotive and Heavy Equipment
- 9.1.2. Construction
- 9.1.3. Electrical and Electronics
- 9.1.4. Industrial
- 9.1.5. Other End-user Industry
- 9.1. Market Analysis, Insights and Forecast - by End-user Industry
- 10. Middle East and Africa Copper Market Analysis, Insights and Forecast, 2019-2031
- 10.1. Market Analysis, Insights and Forecast - by End-user Industry
- 10.1.1. Automotive and Heavy Equipment
- 10.1.2. Construction
- 10.1.3. Electrical and Electronics
- 10.1.4. Industrial
- 10.1.5. Other End-user Industry
- 10.1. Market Analysis, Insights and Forecast - by End-user Industry
- 11. Asia Pacific Copper Market Analysis, Insights and Forecast, 2019-2031
- 11.1. Market Analysis, Insights and Forecast - By Country/Sub-region
- 11.1.1 China
- 11.1.2 India
- 11.1.3 Japan
- 11.1.4 South Korea
- 11.1.5 Rest of Asia Pacific
- 12. North America Copper Market Analysis, Insights and Forecast, 2019-2031
- 12.1. Market Analysis, Insights and Forecast - By Country/Sub-region
- 12.1.1 United States
- 12.1.2 Canada
- 12.1.3 Mexico
- 13. Europe Copper Market Analysis, Insights and Forecast, 2019-2031
- 13.1. Market Analysis, Insights and Forecast - By Country/Sub-region
- 13.1.1 Germany
- 13.1.2 United Kingdom
- 13.1.3 France
- 13.1.4 Italy
- 13.1.5 Rest of Europe
- 14. South America Copper Market Analysis, Insights and Forecast, 2019-2031
- 14.1. Market Analysis, Insights and Forecast - By Country/Sub-region
- 14.1.1 Brazil
- 14.1.2 Argentina
- 14.1.3 Rest of South America
- 15. Middle East and Africa Copper Market Analysis, Insights and Forecast, 2019-2031
- 15.1. Market Analysis, Insights and Forecast - By Country/Sub-region
- 15.1.1 South Africa
- 15.1.2 Rest of Middle East and Africa
- 16. Competitive Analysis
- 16.1. Global Market Share Analysis 2024
- 16.2. Company Profiles
- 16.2.1 KGHM
- 16.2.1.1. Overview
- 16.2.1.2. Products
- 16.2.1.3. SWOT Analysis
- 16.2.1.4. Recent Developments
- 16.2.1.5. Financials (Based on Availability)
- 16.2.2 Codelco
- 16.2.2.1. Overview
- 16.2.2.2. Products
- 16.2.2.3. SWOT Analysis
- 16.2.2.4. Recent Developments
- 16.2.2.5. Financials (Based on Availability)
- 16.2.3 BHP
- 16.2.3.1. Overview
- 16.2.3.2. Products
- 16.2.3.3. SWOT Analysis
- 16.2.3.4. Recent Developments
- 16.2.3.5. Financials (Based on Availability)
- 16.2.4 Aurubis AG
- 16.2.4.1. Overview
- 16.2.4.2. Products
- 16.2.4.3. SWOT Analysis
- 16.2.4.4. Recent Developments
- 16.2.4.5. Financials (Based on Availability)
- 16.2.5 Southern Copper Corporation
- 16.2.5.1. Overview
- 16.2.5.2. Products
- 16.2.5.3. SWOT Analysis
- 16.2.5.4. Recent Developments
- 16.2.5.5. Financials (Based on Availability)
- 16.2.6 Group Mexico
- 16.2.6.1. Overview
- 16.2.6.2. Products
- 16.2.6.3. SWOT Analysis
- 16.2.6.4. Recent Developments
- 16.2.6.5. Financials (Based on Availability)
- 16.2.7 Xstrata Plc
- 16.2.7.1. Overview
- 16.2.7.2. Products
- 16.2.7.3. SWOT Analysis
- 16.2.7.4. Recent Developments
- 16.2.7.5. Financials (Based on Availability)
- 16.2.8 Glencore
- 16.2.8.1. Overview
- 16.2.8.2. Products
- 16.2.8.3. SWOT Analysis
- 16.2.8.4. Recent Developments
- 16.2.8.5. Financials (Based on Availability)
- 16.2.9 Chinalco Shanghai Copper
- 16.2.9.1. Overview
- 16.2.9.2. Products
- 16.2.9.3. SWOT Analysis
- 16.2.9.4. Recent Developments
- 16.2.9.5. Financials (Based on Availability)
- 16.2.10 Freeport-McMoRan Copper & Gold
- 16.2.10.1. Overview
- 16.2.10.2. Products
- 16.2.10.3. SWOT Analysis
- 16.2.10.4. Recent Developments
- 16.2.10.5. Financials (Based on Availability)
- 16.2.1 KGHM
List of Figures
- Figure 1: Global Copper Market Revenue Breakdown (Million, %) by Region 2024 & 2032
- Figure 2: Global Copper Market Volume Breakdown (K Tons, %) by Region 2024 & 2032
- Figure 3: Asia Pacific Copper Market Revenue (Million), by Country 2024 & 2032
- Figure 4: Asia Pacific Copper Market Volume (K Tons), by Country 2024 & 2032
- Figure 5: Asia Pacific Copper Market Revenue Share (%), by Country 2024 & 2032
- Figure 6: Asia Pacific Copper Market Volume Share (%), by Country 2024 & 2032
- Figure 7: North America Copper Market Revenue (Million), by Country 2024 & 2032
- Figure 8: North America Copper Market Volume (K Tons), by Country 2024 & 2032
- Figure 9: North America Copper Market Revenue Share (%), by Country 2024 & 2032
- Figure 10: North America Copper Market Volume Share (%), by Country 2024 & 2032
- Figure 11: Europe Copper Market Revenue (Million), by Country 2024 & 2032
- Figure 12: Europe Copper Market Volume (K Tons), by Country 2024 & 2032
- Figure 13: Europe Copper Market Revenue Share (%), by Country 2024 & 2032
- Figure 14: Europe Copper Market Volume Share (%), by Country 2024 & 2032
- Figure 15: South America Copper Market Revenue (Million), by Country 2024 & 2032
- Figure 16: South America Copper Market Volume (K Tons), by Country 2024 & 2032
- Figure 17: South America Copper Market Revenue Share (%), by Country 2024 & 2032
- Figure 18: South America Copper Market Volume Share (%), by Country 2024 & 2032
- Figure 19: Middle East and Africa Copper Market Revenue (Million), by Country 2024 & 2032
- Figure 20: Middle East and Africa Copper Market Volume (K Tons), by Country 2024 & 2032
- Figure 21: Middle East and Africa Copper Market Revenue Share (%), by Country 2024 & 2032
- Figure 22: Middle East and Africa Copper Market Volume Share (%), by Country 2024 & 2032
- Figure 23: Asia Pacific Copper Market Revenue (Million), by End-user Industry 2024 & 2032
- Figure 24: Asia Pacific Copper Market Volume (K Tons), by End-user Industry 2024 & 2032
- Figure 25: Asia Pacific Copper Market Revenue Share (%), by End-user Industry 2024 & 2032
- Figure 26: Asia Pacific Copper Market Volume Share (%), by End-user Industry 2024 & 2032
- Figure 27: Asia Pacific Copper Market Revenue (Million), by Country 2024 & 2032
- Figure 28: Asia Pacific Copper Market Volume (K Tons), by Country 2024 & 2032
- Figure 29: Asia Pacific Copper Market Revenue Share (%), by Country 2024 & 2032
- Figure 30: Asia Pacific Copper Market Volume Share (%), by Country 2024 & 2032
- Figure 31: North America Copper Market Revenue (Million), by End-user Industry 2024 & 2032
- Figure 32: North America Copper Market Volume (K Tons), by End-user Industry 2024 & 2032
- Figure 33: North America Copper Market Revenue Share (%), by End-user Industry 2024 & 2032
- Figure 34: North America Copper Market Volume Share (%), by End-user Industry 2024 & 2032
- Figure 35: North America Copper Market Revenue (Million), by Country 2024 & 2032
- Figure 36: North America Copper Market Volume (K Tons), by Country 2024 & 2032
- Figure 37: North America Copper Market Revenue Share (%), by Country 2024 & 2032
- Figure 38: North America Copper Market Volume Share (%), by Country 2024 & 2032
- Figure 39: Europe Copper Market Revenue (Million), by End-user Industry 2024 & 2032
- Figure 40: Europe Copper Market Volume (K Tons), by End-user Industry 2024 & 2032
- Figure 41: Europe Copper Market Revenue Share (%), by End-user Industry 2024 & 2032
- Figure 42: Europe Copper Market Volume Share (%), by End-user Industry 2024 & 2032
- Figure 43: Europe Copper Market Revenue (Million), by Country 2024 & 2032
- Figure 44: Europe Copper Market Volume (K Tons), by Country 2024 & 2032
- Figure 45: Europe Copper Market Revenue Share (%), by Country 2024 & 2032
- Figure 46: Europe Copper Market Volume Share (%), by Country 2024 & 2032
- Figure 47: South America Copper Market Revenue (Million), by End-user Industry 2024 & 2032
- Figure 48: South America Copper Market Volume (K Tons), by End-user Industry 2024 & 2032
- Figure 49: South America Copper Market Revenue Share (%), by End-user Industry 2024 & 2032
- Figure 50: South America Copper Market Volume Share (%), by End-user Industry 2024 & 2032
- Figure 51: South America Copper Market Revenue (Million), by Country 2024 & 2032
- Figure 52: South America Copper Market Volume (K Tons), by Country 2024 & 2032
- Figure 53: South America Copper Market Revenue Share (%), by Country 2024 & 2032
- Figure 54: South America Copper Market Volume Share (%), by Country 2024 & 2032
- Figure 55: Middle East and Africa Copper Market Revenue (Million), by End-user Industry 2024 & 2032
- Figure 56: Middle East and Africa Copper Market Volume (K Tons), by End-user Industry 2024 & 2032
- Figure 57: Middle East and Africa Copper Market Revenue Share (%), by End-user Industry 2024 & 2032
- Figure 58: Middle East and Africa Copper Market Volume Share (%), by End-user Industry 2024 & 2032
- Figure 59: Middle East and Africa Copper Market Revenue (Million), by Country 2024 & 2032
- Figure 60: Middle East and Africa Copper Market Volume (K Tons), by Country 2024 & 2032
- Figure 61: Middle East and Africa Copper Market Revenue Share (%), by Country 2024 & 2032
- Figure 62: Middle East and Africa Copper Market Volume Share (%), by Country 2024 & 2032
List of Tables
- Table 1: Global Copper Market Revenue Million Forecast, by Region 2019 & 2032
- Table 2: Global Copper Market Volume K Tons Forecast, by Region 2019 & 2032
- Table 3: Global Copper Market Revenue Million Forecast, by End-user Industry 2019 & 2032
- Table 4: Global Copper Market Volume K Tons Forecast, by End-user Industry 2019 & 2032
- Table 5: Global Copper Market Revenue Million Forecast, by Region 2019 & 2032
- Table 6: Global Copper Market Volume K Tons Forecast, by Region 2019 & 2032
- Table 7: Global Copper Market Revenue Million Forecast, by Country 2019 & 2032
- Table 8: Global Copper Market Volume K Tons Forecast, by Country 2019 & 2032
- Table 9: China Copper Market Revenue (Million) Forecast, by Application 2019 & 2032
- Table 10: China Copper Market Volume (K Tons) Forecast, by Application 2019 & 2032
- Table 11: India Copper Market Revenue (Million) Forecast, by Application 2019 & 2032
- Table 12: India Copper Market Volume (K Tons) Forecast, by Application 2019 & 2032
- Table 13: Japan Copper Market Revenue (Million) Forecast, by Application 2019 & 2032
- Table 14: Japan Copper Market Volume (K Tons) Forecast, by Application 2019 & 2032
- Table 15: South Korea Copper Market Revenue (Million) Forecast, by Application 2019 & 2032
- Table 16: South Korea Copper Market Volume (K Tons) Forecast, by Application 2019 & 2032
- Table 17: Rest of Asia Pacific Copper Market Revenue (Million) Forecast, by Application 2019 & 2032
- Table 18: Rest of Asia Pacific Copper Market Volume (K Tons) Forecast, by Application 2019 & 2032
- Table 19: Global Copper Market Revenue Million Forecast, by Country 2019 & 2032
- Table 20: Global Copper Market Volume K Tons Forecast, by Country 2019 & 2032
- Table 21: United States Copper Market Revenue (Million) Forecast, by Application 2019 & 2032
- Table 22: United States Copper Market Volume (K Tons) Forecast, by Application 2019 & 2032
- Table 23: Canada Copper Market Revenue (Million) Forecast, by Application 2019 & 2032
- Table 24: Canada Copper Market Volume (K Tons) Forecast, by Application 2019 & 2032
- Table 25: Mexico Copper Market Revenue (Million) Forecast, by Application 2019 & 2032
- Table 26: Mexico Copper Market Volume (K Tons) Forecast, by Application 2019 & 2032
- Table 27: Global Copper Market Revenue Million Forecast, by Country 2019 & 2032
- Table 28: Global Copper Market Volume K Tons Forecast, by Country 2019 & 2032
- Table 29: Germany Copper Market Revenue (Million) Forecast, by Application 2019 & 2032
- Table 30: Germany Copper Market Volume (K Tons) Forecast, by Application 2019 & 2032
- Table 31: United Kingdom Copper Market Revenue (Million) Forecast, by Application 2019 & 2032
- Table 32: United Kingdom Copper Market Volume (K Tons) Forecast, by Application 2019 & 2032
- Table 33: France Copper Market Revenue (Million) Forecast, by Application 2019 & 2032
- Table 34: France Copper Market Volume (K Tons) Forecast, by Application 2019 & 2032
- Table 35: Italy Copper Market Revenue (Million) Forecast, by Application 2019 & 2032
- Table 36: Italy Copper Market Volume (K Tons) Forecast, by Application 2019 & 2032
- Table 37: Rest of Europe Copper Market Revenue (Million) Forecast, by Application 2019 & 2032
- Table 38: Rest of Europe Copper Market Volume (K Tons) Forecast, by Application 2019 & 2032
- Table 39: Global Copper Market Revenue Million Forecast, by Country 2019 & 2032
- Table 40: Global Copper Market Volume K Tons Forecast, by Country 2019 & 2032
- Table 41: Brazil Copper Market Revenue (Million) Forecast, by Application 2019 & 2032
- Table 42: Brazil Copper Market Volume (K Tons) Forecast, by Application 2019 & 2032
- Table 43: Argentina Copper Market Revenue (Million) Forecast, by Application 2019 & 2032
- Table 44: Argentina Copper Market Volume (K Tons) Forecast, by Application 2019 & 2032
- Table 45: Rest of South America Copper Market Revenue (Million) Forecast, by Application 2019 & 2032
- Table 46: Rest of South America Copper Market Volume (K Tons) Forecast, by Application 2019 & 2032
- Table 47: Global Copper Market Revenue Million Forecast, by Country 2019 & 2032
- Table 48: Global Copper Market Volume K Tons Forecast, by Country 2019 & 2032
- Table 49: South Africa Copper Market Revenue (Million) Forecast, by Application 2019 & 2032
- Table 50: South Africa Copper Market Volume (K Tons) Forecast, by Application 2019 & 2032
- Table 51: Rest of Middle East and Africa Copper Market Revenue (Million) Forecast, by Application 2019 & 2032
- Table 52: Rest of Middle East and Africa Copper Market Volume (K Tons) Forecast, by Application 2019 & 2032
- Table 53: Global Copper Market Revenue Million Forecast, by End-user Industry 2019 & 2032
- Table 54: Global Copper Market Volume K Tons Forecast, by End-user Industry 2019 & 2032
- Table 55: Global Copper Market Revenue Million Forecast, by Country 2019 & 2032
- Table 56: Global Copper Market Volume K Tons Forecast, by Country 2019 & 2032
- Table 57: China Copper Market Revenue (Million) Forecast, by Application 2019 & 2032
- Table 58: China Copper Market Volume (K Tons) Forecast, by Application 2019 & 2032
- Table 59: India Copper Market Revenue (Million) Forecast, by Application 2019 & 2032
- Table 60: India Copper Market Volume (K Tons) Forecast, by Application 2019 & 2032
- Table 61: Japan Copper Market Revenue (Million) Forecast, by Application 2019 & 2032
- Table 62: Japan Copper Market Volume (K Tons) Forecast, by Application 2019 & 2032
- Table 63: South Korea Copper Market Revenue (Million) Forecast, by Application 2019 & 2032
- Table 64: South Korea Copper Market Volume (K Tons) Forecast, by Application 2019 & 2032
- Table 65: Rest of Asia Pacific Copper Market Revenue (Million) Forecast, by Application 2019 & 2032
- Table 66: Rest of Asia Pacific Copper Market Volume (K Tons) Forecast, by Application 2019 & 2032
- Table 67: Global Copper Market Revenue Million Forecast, by End-user Industry 2019 & 2032
- Table 68: Global Copper Market Volume K Tons Forecast, by End-user Industry 2019 & 2032
- Table 69: Global Copper Market Revenue Million Forecast, by Country 2019 & 2032
- Table 70: Global Copper Market Volume K Tons Forecast, by Country 2019 & 2032
- Table 71: United States Copper Market Revenue (Million) Forecast, by Application 2019 & 2032
- Table 72: United States Copper Market Volume (K Tons) Forecast, by Application 2019 & 2032
- Table 73: Canada Copper Market Revenue (Million) Forecast, by Application 2019 & 2032
- Table 74: Canada Copper Market Volume (K Tons) Forecast, by Application 2019 & 2032
- Table 75: Mexico Copper Market Revenue (Million) Forecast, by Application 2019 & 2032
- Table 76: Mexico Copper Market Volume (K Tons) Forecast, by Application 2019 & 2032
- Table 77: Global Copper Market Revenue Million Forecast, by End-user Industry 2019 & 2032
- Table 78: Global Copper Market Volume K Tons Forecast, by End-user Industry 2019 & 2032
- Table 79: Global Copper Market Revenue Million Forecast, by Country 2019 & 2032
- Table 80: Global Copper Market Volume K Tons Forecast, by Country 2019 & 2032
- Table 81: Germany Copper Market Revenue (Million) Forecast, by Application 2019 & 2032
- Table 82: Germany Copper Market Volume (K Tons) Forecast, by Application 2019 & 2032
- Table 83: United Kingdom Copper Market Revenue (Million) Forecast, by Application 2019 & 2032
- Table 84: United Kingdom Copper Market Volume (K Tons) Forecast, by Application 2019 & 2032
- Table 85: France Copper Market Revenue (Million) Forecast, by Application 2019 & 2032
- Table 86: France Copper Market Volume (K Tons) Forecast, by Application 2019 & 2032
- Table 87: Italy Copper Market Revenue (Million) Forecast, by Application 2019 & 2032
- Table 88: Italy Copper Market Volume (K Tons) Forecast, by Application 2019 & 2032
- Table 89: Rest of Europe Copper Market Revenue (Million) Forecast, by Application 2019 & 2032
- Table 90: Rest of Europe Copper Market Volume (K Tons) Forecast, by Application 2019 & 2032
- Table 91: Global Copper Market Revenue Million Forecast, by End-user Industry 2019 & 2032
- Table 92: Global Copper Market Volume K Tons Forecast, by End-user Industry 2019 & 2032
- Table 93: Global Copper Market Revenue Million Forecast, by Country 2019 & 2032
- Table 94: Global Copper Market Volume K Tons Forecast, by Country 2019 & 2032
- Table 95: Brazil Copper Market Revenue (Million) Forecast, by Application 2019 & 2032
- Table 96: Brazil Copper Market Volume (K Tons) Forecast, by Application 2019 & 2032
- Table 97: Argentina Copper Market Revenue (Million) Forecast, by Application 2019 & 2032
- Table 98: Argentina Copper Market Volume (K Tons) Forecast, by Application 2019 & 2032
- Table 99: Rest of South America Copper Market Revenue (Million) Forecast, by Application 2019 & 2032
- Table 100: Rest of South America Copper Market Volume (K Tons) Forecast, by Application 2019 & 2032
- Table 101: Global Copper Market Revenue Million Forecast, by End-user Industry 2019 & 2032
- Table 102: Global Copper Market Volume K Tons Forecast, by End-user Industry 2019 & 2032
- Table 103: Global Copper Market Revenue Million Forecast, by Country 2019 & 2032
- Table 104: Global Copper Market Volume K Tons Forecast, by Country 2019 & 2032
- Table 105: South Africa Copper Market Revenue (Million) Forecast, by Application 2019 & 2032
- Table 106: South Africa Copper Market Volume (K Tons) Forecast, by Application 2019 & 2032
- Table 107: UAE Copper Market Revenue (Million) Forecast, by Application 2019 & 2032
- Table 108: UAE Copper Market Volume (K Tons) Forecast, by Application 2019 & 2032
- Table 109: Saudi Arabia Copper Market Revenue (Million) Forecast, by Application 2019 & 2032
- Table 110: Saudi Arabia Copper Market Volume (K Tons) Forecast, by Application 2019 & 2032
- Table 111: Rest of Middle East and Africa Copper Market Revenue (Million) Forecast, by Application 2019 & 2032
- Table 112: Rest of Middle East and Africa Copper Market Volume (K Tons) Forecast, by Application 2019 & 2032
Frequently Asked Questions
1. What is the projected Compound Annual Growth Rate (CAGR) of the Copper Market?
The projected CAGR is approximately > 6.00%.
2. Which companies are prominent players in the Copper Market?
Key companies in the market include KGHM, Codelco, BHP, Aurubis AG, Southern Copper Corporation, Group Mexico, Xstrata Plc, Glencore, Chinalco Shanghai Copper, Freeport-McMoRan Copper & Gold.
3. What are the main segments of the Copper Market?
The market segments include End-user Industry.
4. Can you provide details about the market size?
The market size is estimated to be USD XX Million as of 2022.
5. What are some drivers contributing to market growth?
Growing Demand from Electronics and Construction Industry; Other Drivers.
6. What are the notable trends driving market growth?
Growing Demand for Electrical and Electronics Segment.
7. Are there any restraints impacting market growth?
Stringent Regulations Associated with Mining.
8. Can you provide examples of recent developments in the market?
November 2021: Aurubis AG further expanded its activities in recycling metal-bearing materials internationally. It started the construction of a multi metal recycling plant in the US state of Georgia. Circuit boards, copper cable, and other recycling materials containing metals will be processed into 35,000 tons of blister copper annually.
9. What pricing options are available for accessing the report?
Pricing options include single-user, multi-user, and enterprise licenses priced at USD 4750, USD 5250, and USD 8750 respectively.
10. Is the market size provided in terms of value or volume?
The market size is provided in terms of value, measured in Million and volume, measured in K Tons.
11. Are there any specific market keywords associated with the report?
Yes, the market keyword associated with the report is "Copper Market," which aids in identifying and referencing the specific market segment covered.
12. How do I determine which pricing option suits my needs best?
The pricing options vary based on user requirements and access needs. Individual users may opt for single-user licenses, while businesses requiring broader access may choose multi-user or enterprise licenses for cost-effective access to the report.
13. Are there any additional resources or data provided in the Copper Market report?
While the report offers comprehensive insights, it's advisable to review the specific contents or supplementary materials provided to ascertain if additional resources or data are available.
14. How can I stay updated on further developments or reports in the Copper Market?
To stay informed about further developments, trends, and reports in the Copper Market, consider subscribing to industry newsletters, following relevant companies and organizations, or regularly checking reputable industry news sources and publications.
Methodology
Step 1 - Identification of Relevant Samples Size from Population Database


Step 2 - Approaches for Defining Global Market Size (Value, Volume* & Price*)

Note*: In applicable scenarios
Step 3 - Data Sources
Primary Research
- Web Analytics
- Survey Reports
- Research Institute
- Latest Research Reports
- Opinion Leaders
Secondary Research
- Annual Reports
- White Paper
- Latest Press Release
- Industry Association
- Paid Database
- Investor Presentations

Step 4 - Data Triangulation
Involves using different sources of information in order to increase the validity of a study
These sources are likely to be stakeholders in a program - participants, other researchers, program staff, other community members, and so on.
Then we put all data in single framework & apply various statistical tools to find out the dynamic on the market.
During the analysis stage, feedback from the stakeholder groups would be compared to determine areas of agreement as well as areas of divergence
