

Key Insights
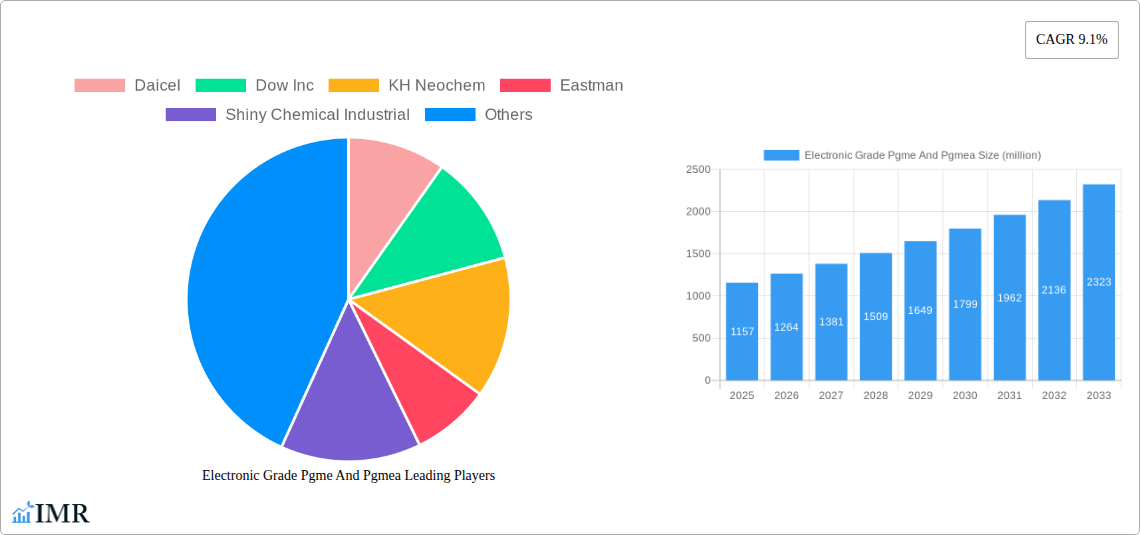
The Electronic Grade PGME (propylene glycol monomethyl ether) and PGMEA (propylene glycol monomethyl ether acetate) market is poised for robust growth, projected to reach a substantial size. The market's Compound Annual Growth Rate (CAGR) of 9.1% from 2019 to 2024 indicates a consistently expanding demand driven primarily by the burgeoning electronics industry, particularly in semiconductor manufacturing and printed circuit board (PCB) production. These solvents are crucial in photolithography, a critical process in chip fabrication, and as cleaning agents in various electronic component manufacturing stages. Increasing adoption of advanced electronic devices, coupled with the rise of 5G technology and the Internet of Things (IoT), further fuels this market expansion. Competition among key players like Daicel, Dow Inc., and Eastman fosters innovation and drives price competitiveness. However, stringent environmental regulations concerning volatile organic compound (VOC) emissions present a key challenge for the industry, pushing manufacturers to explore more eco-friendly alternatives and efficient production methods. Future growth will depend on technological advancements in semiconductor manufacturing, the adoption of sustainable practices, and the overall health of the global electronics market.
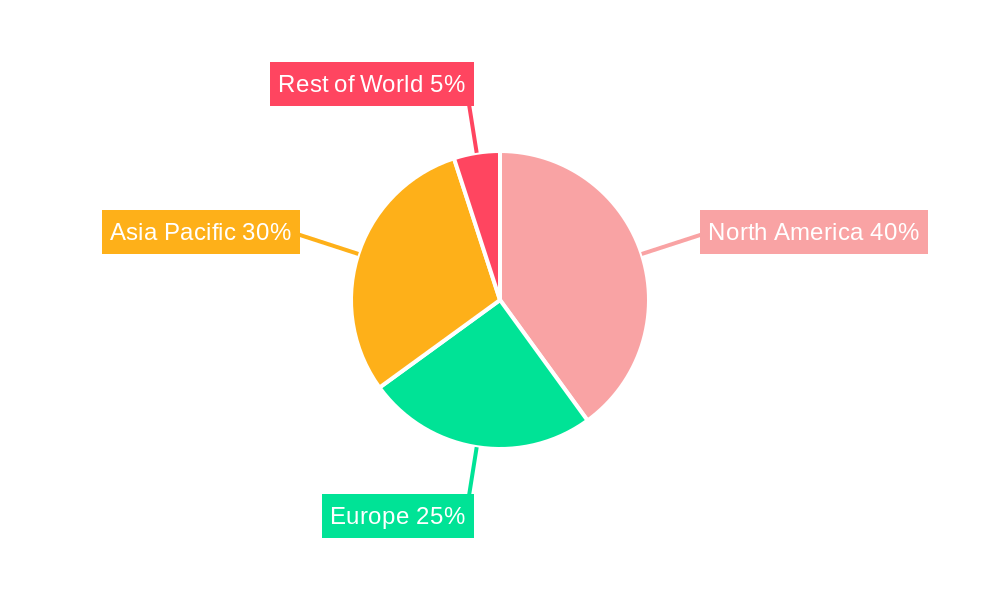
The regional distribution of the market is likely skewed towards regions with high concentrations of electronics manufacturing, notably North America and Asia. Growth in emerging economies, particularly in Asia, is anticipated to be strong, driven by increasing manufacturing capacity and rising consumer demand for electronic devices. While precise regional breakdowns are unavailable, a reasonable estimation based on industry trends suggests North America and Asia Pacific will hold the largest market share, with Europe and other regions contributing significantly, albeit at a smaller scale. The forecast period of 2025-2033 promises continued expansion, contingent on sustained technological advancements within the electronics sector and the successful navigation of environmental regulations. A continued focus on research and development aimed at producing more sustainable solvents is expected to shape market dynamics in the coming years.
Electronic Grade PGME and PGMEA Market Report: 2019-2033
This comprehensive report provides an in-depth analysis of the Electronic Grade PGME (Propylene Glycol Monomethyl Ether) and PGMEA (Propylene Glycol Monomethyl Ether Acetate) market, encompassing market dynamics, growth trends, regional analysis, product landscape, key players, and future outlook. The report covers the period from 2019 to 2033, with a base year of 2025 and a forecast period of 2025-2033. The parent market is the specialty chemicals market, while the child market is the electronic chemicals segment. This report is essential for industry professionals, investors, and stakeholders seeking to understand and capitalize on opportunities within this rapidly evolving market. The total market size in 2025 is estimated at xx million units.
Electronic Grade PGME and PGMEA Market Dynamics & Structure
This section analyzes the market structure, competition, and influencing factors. The market is moderately concentrated, with key players holding significant market share, while several smaller players contribute to a competitive landscape. Technological innovation, particularly in the area of higher purity grades and environmentally friendly formulations, drives significant growth. Stringent regulatory frameworks regarding volatile organic compounds (VOCs) and environmental concerns shape production processes and product development. PGME and PGMEA face competition from alternative solvents, driving innovation in performance and cost-effectiveness. End-users primarily consist of semiconductor manufacturers, electronics assemblers, and printed circuit board (PCB) manufacturers. The market witnesses occasional M&A activity, with larger players consolidating their position through acquisitions.
- Market Concentration: Moderately concentrated, with top 5 players holding xx% market share in 2025.
- Technological Innovation: Focus on higher purity, lower VOC emissions, and improved performance characteristics.
- Regulatory Framework: Stringent VOC emission standards influence production and formulations.
- Competitive Substitutes: Alternative solvents like ethyl lactate and other esters present competitive pressures.
- End-User Demographics: Primarily semiconductor, electronics assembly, and PCB manufacturing industries.
- M&A Trends: Occasional mergers and acquisitions to consolidate market share; xx M&A deals recorded between 2019-2024.
Electronic Grade PGME and PGMEA Growth Trends & Insights
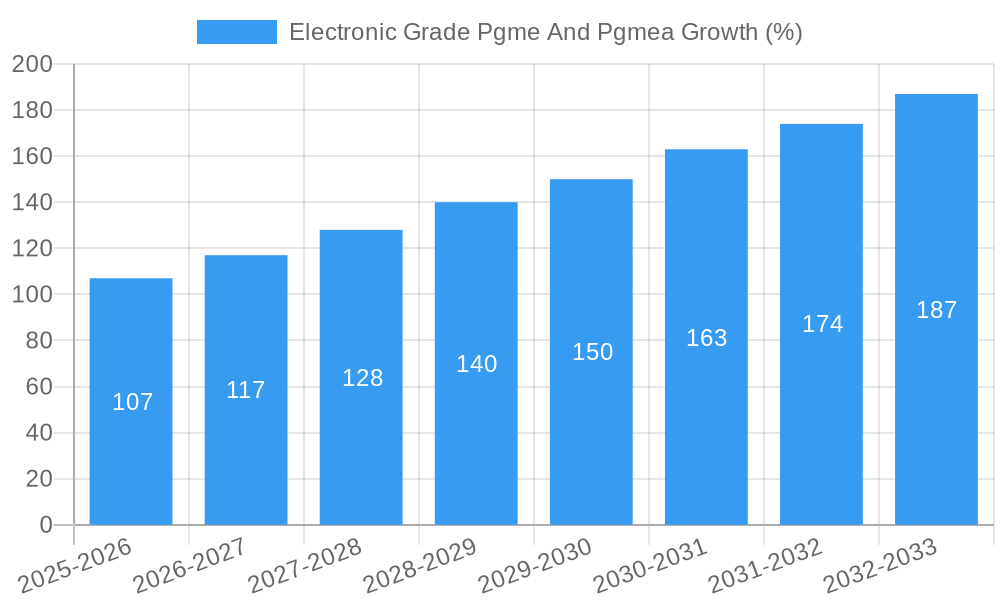
The Electronic Grade PGME and PGMEA market experienced steady growth during the historical period (2019-2024), driven by the increasing demand for electronic devices and the need for high-purity solvents in semiconductor manufacturing. The market size expanded from xx million units in 2019 to xx million units in 2024, exhibiting a CAGR of xx%. This growth trajectory is expected to continue during the forecast period (2025-2033), albeit at a slightly moderated pace. Technological advancements, such as the introduction of more sustainable and efficient manufacturing processes, are influencing market adoption rates and driving changes in consumer behavior. The increasing focus on miniaturization and higher performance in electronic devices fuels demand for advanced cleaning solvents like PGME and PGMEA. The market penetration rate for PGME and PGMEA in the electronics industry is projected to reach xx% by 2033.
Dominant Regions, Countries, or Segments in Electronic Grade PGME and PGMEA
The Asia-Pacific region, particularly China, South Korea, and Taiwan, dominates the Electronic Grade PGME and PGMEA market due to the presence of major semiconductor and electronics manufacturing hubs. The robust growth in these regions is underpinned by favorable government policies promoting technological advancements and investments in infrastructure. North America and Europe follow as significant markets, driven by established electronics industries and a focus on technological innovation.
- Asia-Pacific: Dominant market share due to high concentration of electronics manufacturing. Key drivers include substantial government investment in infrastructure and supportive economic policies. Market share in 2025: xx%.
- North America: Strong growth driven by technological advancements and existing robust electronics industry. Market share in 2025: xx%.
- Europe: Stable growth, influenced by regulatory frameworks and a focus on sustainability. Market share in 2025: xx%.
Electronic Grade PGME and PGMEA Product Landscape
Electronic Grade PGME and PGMEA are high-purity solvents crucial for cleaning and processing in electronics manufacturing. These products are characterized by low levels of impurities, ensuring high performance and minimizing defects in sensitive electronic components. Continuous innovation focuses on improving purity, reducing VOC content, and enhancing efficiency in various applications. The unique selling proposition revolves around the solvents' effectiveness, purity, and compliance with stringent industry standards. Technological advancements are directed at developing more sustainable and environmentally friendly formulations.
Key Drivers, Barriers & Challenges in Electronic Grade PGME and PGMEA
Key Drivers: The burgeoning electronics industry, particularly the semiconductor sector, is the primary driver. Miniaturization and the increasing demand for higher-performance electronic devices necessitate the use of high-purity solvents. Technological advancements, leading to more efficient and sustainable manufacturing processes, also contribute to market growth.
Key Barriers & Challenges: Fluctuations in raw material prices, stringent environmental regulations, and potential supply chain disruptions pose challenges. Competition from alternative solvents and the need for continuous innovation in product formulation also influence market dynamics. The impact of these challenges is estimated to result in xx% reduction in the market growth rate in 2030.
Emerging Opportunities in Electronic Grade PGME and PGMEA
Emerging opportunities lie in expanding into untapped markets, such as developing economies with growing electronics manufacturing sectors. Innovation in applications, like the use of PGME and PGMEA in advanced packaging technologies, offers significant potential. Evolving consumer preferences for sustainable products are pushing the development of more eco-friendly solvent formulations.
Growth Accelerators in the Electronic Grade PGME and PGMEA Industry
Technological breakthroughs in solvent purification and the development of more environmentally friendly formulations are accelerating market growth. Strategic partnerships between chemical manufacturers and electronics companies foster innovation and enhance market penetration. Expansion into new geographic markets and diversification into new applications further propel market expansion.
Key Players Shaping the Electronic Grade PGME and PGMEA Market
- Daicel
- Dow Inc
- KH Neochem
- Eastman
- Shiny Chemical Industrial
- Chemtronics
- Jiangsu Mingfeng Electronic Materials
- Chang Chun Group
- Jiangsu Yida Chemical
Notable Milestones in Electronic Grade PGME and PGMEA Sector
- 2020: Daicel launches a new high-purity PGMEA with reduced VOC content.
- 2021: Dow Inc invests in a new manufacturing facility for PGME and PGMEA.
- 2022: Shiny Chemical Industrial introduces a sustainable PGME formulation.
- 2023: A joint venture is formed between two key players to enhance production capacity.
In-Depth Electronic Grade PGME and PGMEA Market Outlook
The Electronic Grade PGME and PGMEA market is poised for robust growth over the forecast period, driven by the ongoing expansion of the electronics industry, particularly in emerging markets. Technological innovation, the increasing adoption of sustainable manufacturing practices, and strategic partnerships will further fuel market expansion. The market presents significant opportunities for established players and new entrants to capitalize on the rising demand for high-quality, environmentally friendly solvents in electronics manufacturing. Strategic investments in research and development, coupled with a focus on sustainability, will be crucial for success in this dynamic market.
Electronic Grade Pgme And Pgmea Segmentation
-
1. Application
- 1.1. Semiconductor
- 1.2. Panel
- 1.3. Others
-
2. Type
- 2.1. PGME
- 2.2. PGMEA
Electronic Grade Pgme And Pgmea Segmentation By Geography
-
1. North America
- 1.1. United States
- 1.2. Canada
- 1.3. Mexico
-
2. South America
- 2.1. Brazil
- 2.2. Argentina
- 2.3. Rest of South America
-
3. Europe
- 3.1. United Kingdom
- 3.2. Germany
- 3.3. France
- 3.4. Italy
- 3.5. Spain
- 3.6. Russia
- 3.7. Benelux
- 3.8. Nordics
- 3.9. Rest of Europe
-
4. Middle East & Africa
- 4.1. Turkey
- 4.2. Israel
- 4.3. GCC
- 4.4. North Africa
- 4.5. South Africa
- 4.6. Rest of Middle East & Africa
-
5. Asia Pacific
- 5.1. China
- 5.2. India
- 5.3. Japan
- 5.4. South Korea
- 5.5. ASEAN
- 5.6. Oceania
- 5.7. Rest of Asia Pacific
Electronic Grade Pgme And Pgmea REPORT HIGHLIGHTS
| Aspects | Details |
|---|---|
| Study Period | 2019-2033 |
| Base Year | 2024 |
| Estimated Year | 2025 |
| Forecast Period | 2025-2033 |
| Historical Period | 2019-2024 |
| Growth Rate | CAGR of 9.1% from 2019-2033 |
| Segmentation |
|
Table of Contents
- 1. Introduction
- 1.1. Research Scope
- 1.2. Market Segmentation
- 1.3. Research Methodology
- 1.4. Definitions and Assumptions
- 2. Executive Summary
- 2.1. Introduction
- 3. Market Dynamics
- 3.1. Introduction
- 3.2. Market Drivers
- 3.3. Market Restrains
- 3.4. Market Trends
- 4. Market Factor Analysis
- 4.1. Porters Five Forces
- 4.2. Supply/Value Chain
- 4.3. PESTEL analysis
- 4.4. Market Entropy
- 4.5. Patent/Trademark Analysis
- 5. Global Electronic Grade Pgme And Pgmea Analysis, Insights and Forecast, 2019-2031
- 5.1. Market Analysis, Insights and Forecast - by Application
- 5.1.1. Semiconductor
- 5.1.2. Panel
- 5.1.3. Others
- 5.2. Market Analysis, Insights and Forecast - by Type
- 5.2.1. PGME
- 5.2.2. PGMEA
- 5.3. Market Analysis, Insights and Forecast - by Region
- 5.3.1. North America
- 5.3.2. South America
- 5.3.3. Europe
- 5.3.4. Middle East & Africa
- 5.3.5. Asia Pacific
- 5.1. Market Analysis, Insights and Forecast - by Application
- 6. North America Electronic Grade Pgme And Pgmea Analysis, Insights and Forecast, 2019-2031
- 6.1. Market Analysis, Insights and Forecast - by Application
- 6.1.1. Semiconductor
- 6.1.2. Panel
- 6.1.3. Others
- 6.2. Market Analysis, Insights and Forecast - by Type
- 6.2.1. PGME
- 6.2.2. PGMEA
- 6.1. Market Analysis, Insights and Forecast - by Application
- 7. South America Electronic Grade Pgme And Pgmea Analysis, Insights and Forecast, 2019-2031
- 7.1. Market Analysis, Insights and Forecast - by Application
- 7.1.1. Semiconductor
- 7.1.2. Panel
- 7.1.3. Others
- 7.2. Market Analysis, Insights and Forecast - by Type
- 7.2.1. PGME
- 7.2.2. PGMEA
- 7.1. Market Analysis, Insights and Forecast - by Application
- 8. Europe Electronic Grade Pgme And Pgmea Analysis, Insights and Forecast, 2019-2031
- 8.1. Market Analysis, Insights and Forecast - by Application
- 8.1.1. Semiconductor
- 8.1.2. Panel
- 8.1.3. Others
- 8.2. Market Analysis, Insights and Forecast - by Type
- 8.2.1. PGME
- 8.2.2. PGMEA
- 8.1. Market Analysis, Insights and Forecast - by Application
- 9. Middle East & Africa Electronic Grade Pgme And Pgmea Analysis, Insights and Forecast, 2019-2031
- 9.1. Market Analysis, Insights and Forecast - by Application
- 9.1.1. Semiconductor
- 9.1.2. Panel
- 9.1.3. Others
- 9.2. Market Analysis, Insights and Forecast - by Type
- 9.2.1. PGME
- 9.2.2. PGMEA
- 9.1. Market Analysis, Insights and Forecast - by Application
- 10. Asia Pacific Electronic Grade Pgme And Pgmea Analysis, Insights and Forecast, 2019-2031
- 10.1. Market Analysis, Insights and Forecast - by Application
- 10.1.1. Semiconductor
- 10.1.2. Panel
- 10.1.3. Others
- 10.2. Market Analysis, Insights and Forecast - by Type
- 10.2.1. PGME
- 10.2.2. PGMEA
- 10.1. Market Analysis, Insights and Forecast - by Application
- 11. Competitive Analysis
- 11.1. Global Market Share Analysis 2024
- 11.2. Company Profiles
- 11.2.1 Daicel
- 11.2.1.1. Overview
- 11.2.1.2. Products
- 11.2.1.3. SWOT Analysis
- 11.2.1.4. Recent Developments
- 11.2.1.5. Financials (Based on Availability)
- 11.2.2 Dow Inc
- 11.2.2.1. Overview
- 11.2.2.2. Products
- 11.2.2.3. SWOT Analysis
- 11.2.2.4. Recent Developments
- 11.2.2.5. Financials (Based on Availability)
- 11.2.3 KH Neochem
- 11.2.3.1. Overview
- 11.2.3.2. Products
- 11.2.3.3. SWOT Analysis
- 11.2.3.4. Recent Developments
- 11.2.3.5. Financials (Based on Availability)
- 11.2.4 Eastman
- 11.2.4.1. Overview
- 11.2.4.2. Products
- 11.2.4.3. SWOT Analysis
- 11.2.4.4. Recent Developments
- 11.2.4.5. Financials (Based on Availability)
- 11.2.5 Shiny Chemical Industrial
- 11.2.5.1. Overview
- 11.2.5.2. Products
- 11.2.5.3. SWOT Analysis
- 11.2.5.4. Recent Developments
- 11.2.5.5. Financials (Based on Availability)
- 11.2.6 Chemtronics
- 11.2.6.1. Overview
- 11.2.6.2. Products
- 11.2.6.3. SWOT Analysis
- 11.2.6.4. Recent Developments
- 11.2.6.5. Financials (Based on Availability)
- 11.2.7 Jiangsu Mingfeng Electronic Materials
- 11.2.7.1. Overview
- 11.2.7.2. Products
- 11.2.7.3. SWOT Analysis
- 11.2.7.4. Recent Developments
- 11.2.7.5. Financials (Based on Availability)
- 11.2.8 Chang Chun Group
- 11.2.8.1. Overview
- 11.2.8.2. Products
- 11.2.8.3. SWOT Analysis
- 11.2.8.4. Recent Developments
- 11.2.8.5. Financials (Based on Availability)
- 11.2.9 Jiangsu Yida Chemical
- 11.2.9.1. Overview
- 11.2.9.2. Products
- 11.2.9.3. SWOT Analysis
- 11.2.9.4. Recent Developments
- 11.2.9.5. Financials (Based on Availability)
- 11.2.1 Daicel
List of Figures
- Figure 1: Global Electronic Grade Pgme And Pgmea Revenue Breakdown (million, %) by Region 2024 & 2032
- Figure 2: North America Electronic Grade Pgme And Pgmea Revenue (million), by Application 2024 & 2032
- Figure 3: North America Electronic Grade Pgme And Pgmea Revenue Share (%), by Application 2024 & 2032
- Figure 4: North America Electronic Grade Pgme And Pgmea Revenue (million), by Type 2024 & 2032
- Figure 5: North America Electronic Grade Pgme And Pgmea Revenue Share (%), by Type 2024 & 2032
- Figure 6: North America Electronic Grade Pgme And Pgmea Revenue (million), by Country 2024 & 2032
- Figure 7: North America Electronic Grade Pgme And Pgmea Revenue Share (%), by Country 2024 & 2032
- Figure 8: South America Electronic Grade Pgme And Pgmea Revenue (million), by Application 2024 & 2032
- Figure 9: South America Electronic Grade Pgme And Pgmea Revenue Share (%), by Application 2024 & 2032
- Figure 10: South America Electronic Grade Pgme And Pgmea Revenue (million), by Type 2024 & 2032
- Figure 11: South America Electronic Grade Pgme And Pgmea Revenue Share (%), by Type 2024 & 2032
- Figure 12: South America Electronic Grade Pgme And Pgmea Revenue (million), by Country 2024 & 2032
- Figure 13: South America Electronic Grade Pgme And Pgmea Revenue Share (%), by Country 2024 & 2032
- Figure 14: Europe Electronic Grade Pgme And Pgmea Revenue (million), by Application 2024 & 2032
- Figure 15: Europe Electronic Grade Pgme And Pgmea Revenue Share (%), by Application 2024 & 2032
- Figure 16: Europe Electronic Grade Pgme And Pgmea Revenue (million), by Type 2024 & 2032
- Figure 17: Europe Electronic Grade Pgme And Pgmea Revenue Share (%), by Type 2024 & 2032
- Figure 18: Europe Electronic Grade Pgme And Pgmea Revenue (million), by Country 2024 & 2032
- Figure 19: Europe Electronic Grade Pgme And Pgmea Revenue Share (%), by Country 2024 & 2032
- Figure 20: Middle East & Africa Electronic Grade Pgme And Pgmea Revenue (million), by Application 2024 & 2032
- Figure 21: Middle East & Africa Electronic Grade Pgme And Pgmea Revenue Share (%), by Application 2024 & 2032
- Figure 22: Middle East & Africa Electronic Grade Pgme And Pgmea Revenue (million), by Type 2024 & 2032
- Figure 23: Middle East & Africa Electronic Grade Pgme And Pgmea Revenue Share (%), by Type 2024 & 2032
- Figure 24: Middle East & Africa Electronic Grade Pgme And Pgmea Revenue (million), by Country 2024 & 2032
- Figure 25: Middle East & Africa Electronic Grade Pgme And Pgmea Revenue Share (%), by Country 2024 & 2032
- Figure 26: Asia Pacific Electronic Grade Pgme And Pgmea Revenue (million), by Application 2024 & 2032
- Figure 27: Asia Pacific Electronic Grade Pgme And Pgmea Revenue Share (%), by Application 2024 & 2032
- Figure 28: Asia Pacific Electronic Grade Pgme And Pgmea Revenue (million), by Type 2024 & 2032
- Figure 29: Asia Pacific Electronic Grade Pgme And Pgmea Revenue Share (%), by Type 2024 & 2032
- Figure 30: Asia Pacific Electronic Grade Pgme And Pgmea Revenue (million), by Country 2024 & 2032
- Figure 31: Asia Pacific Electronic Grade Pgme And Pgmea Revenue Share (%), by Country 2024 & 2032
List of Tables
- Table 1: Global Electronic Grade Pgme And Pgmea Revenue million Forecast, by Region 2019 & 2032
- Table 2: Global Electronic Grade Pgme And Pgmea Revenue million Forecast, by Application 2019 & 2032
- Table 3: Global Electronic Grade Pgme And Pgmea Revenue million Forecast, by Type 2019 & 2032
- Table 4: Global Electronic Grade Pgme And Pgmea Revenue million Forecast, by Region 2019 & 2032
- Table 5: Global Electronic Grade Pgme And Pgmea Revenue million Forecast, by Application 2019 & 2032
- Table 6: Global Electronic Grade Pgme And Pgmea Revenue million Forecast, by Type 2019 & 2032
- Table 7: Global Electronic Grade Pgme And Pgmea Revenue million Forecast, by Country 2019 & 2032
- Table 8: United States Electronic Grade Pgme And Pgmea Revenue (million) Forecast, by Application 2019 & 2032
- Table 9: Canada Electronic Grade Pgme And Pgmea Revenue (million) Forecast, by Application 2019 & 2032
- Table 10: Mexico Electronic Grade Pgme And Pgmea Revenue (million) Forecast, by Application 2019 & 2032
- Table 11: Global Electronic Grade Pgme And Pgmea Revenue million Forecast, by Application 2019 & 2032
- Table 12: Global Electronic Grade Pgme And Pgmea Revenue million Forecast, by Type 2019 & 2032
- Table 13: Global Electronic Grade Pgme And Pgmea Revenue million Forecast, by Country 2019 & 2032
- Table 14: Brazil Electronic Grade Pgme And Pgmea Revenue (million) Forecast, by Application 2019 & 2032
- Table 15: Argentina Electronic Grade Pgme And Pgmea Revenue (million) Forecast, by Application 2019 & 2032
- Table 16: Rest of South America Electronic Grade Pgme And Pgmea Revenue (million) Forecast, by Application 2019 & 2032
- Table 17: Global Electronic Grade Pgme And Pgmea Revenue million Forecast, by Application 2019 & 2032
- Table 18: Global Electronic Grade Pgme And Pgmea Revenue million Forecast, by Type 2019 & 2032
- Table 19: Global Electronic Grade Pgme And Pgmea Revenue million Forecast, by Country 2019 & 2032
- Table 20: United Kingdom Electronic Grade Pgme And Pgmea Revenue (million) Forecast, by Application 2019 & 2032
- Table 21: Germany Electronic Grade Pgme And Pgmea Revenue (million) Forecast, by Application 2019 & 2032
- Table 22: France Electronic Grade Pgme And Pgmea Revenue (million) Forecast, by Application 2019 & 2032
- Table 23: Italy Electronic Grade Pgme And Pgmea Revenue (million) Forecast, by Application 2019 & 2032
- Table 24: Spain Electronic Grade Pgme And Pgmea Revenue (million) Forecast, by Application 2019 & 2032
- Table 25: Russia Electronic Grade Pgme And Pgmea Revenue (million) Forecast, by Application 2019 & 2032
- Table 26: Benelux Electronic Grade Pgme And Pgmea Revenue (million) Forecast, by Application 2019 & 2032
- Table 27: Nordics Electronic Grade Pgme And Pgmea Revenue (million) Forecast, by Application 2019 & 2032
- Table 28: Rest of Europe Electronic Grade Pgme And Pgmea Revenue (million) Forecast, by Application 2019 & 2032
- Table 29: Global Electronic Grade Pgme And Pgmea Revenue million Forecast, by Application 2019 & 2032
- Table 30: Global Electronic Grade Pgme And Pgmea Revenue million Forecast, by Type 2019 & 2032
- Table 31: Global Electronic Grade Pgme And Pgmea Revenue million Forecast, by Country 2019 & 2032
- Table 32: Turkey Electronic Grade Pgme And Pgmea Revenue (million) Forecast, by Application 2019 & 2032
- Table 33: Israel Electronic Grade Pgme And Pgmea Revenue (million) Forecast, by Application 2019 & 2032
- Table 34: GCC Electronic Grade Pgme And Pgmea Revenue (million) Forecast, by Application 2019 & 2032
- Table 35: North Africa Electronic Grade Pgme And Pgmea Revenue (million) Forecast, by Application 2019 & 2032
- Table 36: South Africa Electronic Grade Pgme And Pgmea Revenue (million) Forecast, by Application 2019 & 2032
- Table 37: Rest of Middle East & Africa Electronic Grade Pgme And Pgmea Revenue (million) Forecast, by Application 2019 & 2032
- Table 38: Global Electronic Grade Pgme And Pgmea Revenue million Forecast, by Application 2019 & 2032
- Table 39: Global Electronic Grade Pgme And Pgmea Revenue million Forecast, by Type 2019 & 2032
- Table 40: Global Electronic Grade Pgme And Pgmea Revenue million Forecast, by Country 2019 & 2032
- Table 41: China Electronic Grade Pgme And Pgmea Revenue (million) Forecast, by Application 2019 & 2032
- Table 42: India Electronic Grade Pgme And Pgmea Revenue (million) Forecast, by Application 2019 & 2032
- Table 43: Japan Electronic Grade Pgme And Pgmea Revenue (million) Forecast, by Application 2019 & 2032
- Table 44: South Korea Electronic Grade Pgme And Pgmea Revenue (million) Forecast, by Application 2019 & 2032
- Table 45: ASEAN Electronic Grade Pgme And Pgmea Revenue (million) Forecast, by Application 2019 & 2032
- Table 46: Oceania Electronic Grade Pgme And Pgmea Revenue (million) Forecast, by Application 2019 & 2032
- Table 47: Rest of Asia Pacific Electronic Grade Pgme And Pgmea Revenue (million) Forecast, by Application 2019 & 2032
Frequently Asked Questions
1. What is the projected Compound Annual Growth Rate (CAGR) of the Electronic Grade Pgme And Pgmea?
The projected CAGR is approximately 9.1%.
2. Which companies are prominent players in the Electronic Grade Pgme And Pgmea?
Key companies in the market include Daicel, Dow Inc, KH Neochem, Eastman, Shiny Chemical Industrial, Chemtronics, Jiangsu Mingfeng Electronic Materials, Chang Chun Group, Jiangsu Yida Chemical.
3. What are the main segments of the Electronic Grade Pgme And Pgmea?
The market segments include Application, Type.
4. Can you provide details about the market size?
The market size is estimated to be USD 1157 million as of 2022.
5. What are some drivers contributing to market growth?
N/A
6. What are the notable trends driving market growth?
N/A
7. Are there any restraints impacting market growth?
N/A
8. Can you provide examples of recent developments in the market?
N/A
9. What pricing options are available for accessing the report?
Pricing options include single-user, multi-user, and enterprise licenses priced at USD 4900.00, USD 7350.00, and USD 9800.00 respectively.
10. Is the market size provided in terms of value or volume?
The market size is provided in terms of value, measured in million.
11. Are there any specific market keywords associated with the report?
Yes, the market keyword associated with the report is "Electronic Grade Pgme And Pgmea," which aids in identifying and referencing the specific market segment covered.
12. How do I determine which pricing option suits my needs best?
The pricing options vary based on user requirements and access needs. Individual users may opt for single-user licenses, while businesses requiring broader access may choose multi-user or enterprise licenses for cost-effective access to the report.
13. Are there any additional resources or data provided in the Electronic Grade Pgme And Pgmea report?
While the report offers comprehensive insights, it's advisable to review the specific contents or supplementary materials provided to ascertain if additional resources or data are available.
14. How can I stay updated on further developments or reports in the Electronic Grade Pgme And Pgmea?
To stay informed about further developments, trends, and reports in the Electronic Grade Pgme And Pgmea, consider subscribing to industry newsletters, following relevant companies and organizations, or regularly checking reputable industry news sources and publications.
Methodology
Step 1 - Identification of Relevant Samples Size from Population Database


Step 2 - Approaches for Defining Global Market Size (Value, Volume* & Price*)

Note*: In applicable scenarios
Step 3 - Data Sources
Primary Research
- Web Analytics
- Survey Reports
- Research Institute
- Latest Research Reports
- Opinion Leaders
Secondary Research
- Annual Reports
- White Paper
- Latest Press Release
- Industry Association
- Paid Database
- Investor Presentations

Step 4 - Data Triangulation
Involves using different sources of information in order to increase the validity of a study
These sources are likely to be stakeholders in a program - participants, other researchers, program staff, other community members, and so on.
Then we put all data in single framework & apply various statistical tools to find out the dynamic on the market.
During the analysis stage, feedback from the stakeholder groups would be compared to determine areas of agreement as well as areas of divergence
