

Key Insights
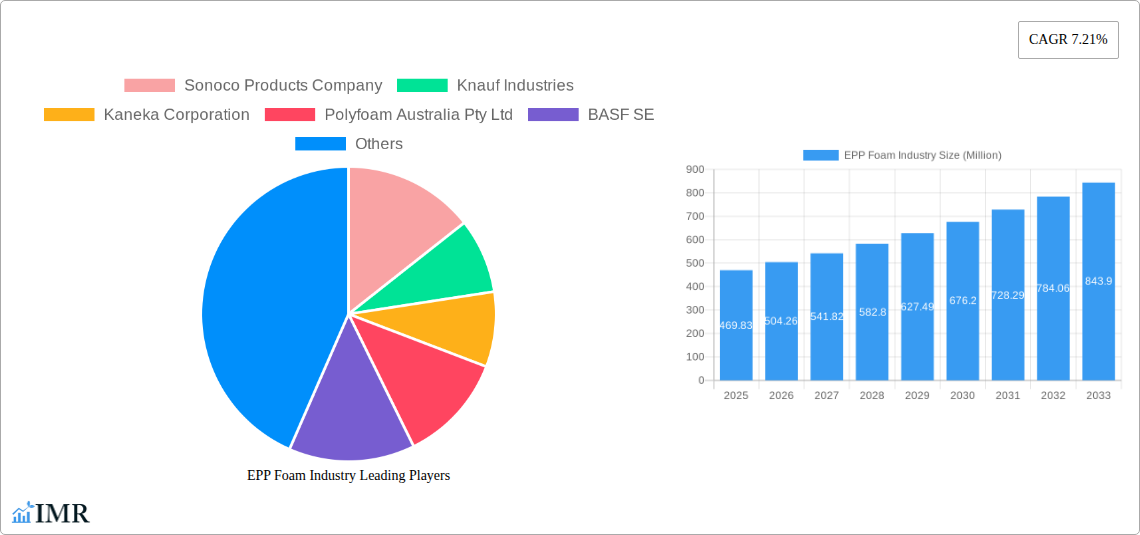
The EPP (Expanded Polypropylene) foam market, valued at $469.83 million in 2025, is projected to experience robust growth, driven by its lightweight yet durable nature, excellent shock absorption properties, and recyclability. This makes it a preferred material across diverse sectors, including automotive (where it's used in bumpers and interior components), packaging (especially for fragile goods), and sports & leisure (in helmets and protective gear). The increasing demand for lightweight and sustainable packaging solutions, particularly within the e-commerce boom and growing consumer awareness of environmental issues, fuels significant market expansion. Furthermore, advancements in EPP foam manufacturing techniques, including the development of bio-based polypropylene alternatives, are contributing to its wider adoption. The automotive industry's push for lighter vehicles to improve fuel efficiency and the increasing need for protective packaging in logistics and supply chains are key drivers. While raw material costs and potential fluctuations in polypropylene prices pose a constraint, the overall market trajectory indicates strong, continued growth.
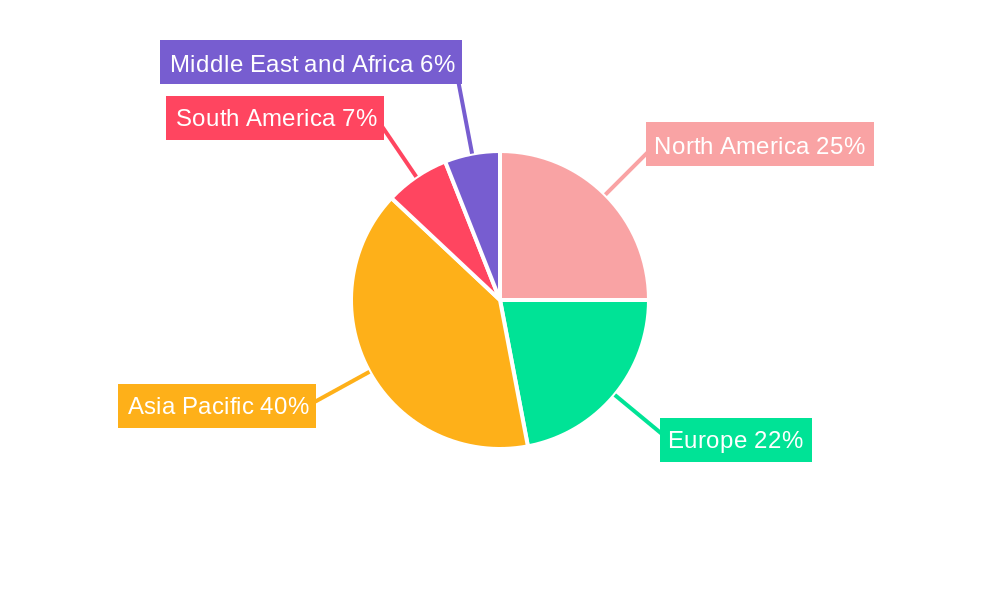
Geographic segmentation reveals a dynamic landscape. The Asia-Pacific region, particularly China and India, is expected to dominate the market due to rapidly expanding manufacturing sectors and increasing disposable incomes. North America and Europe also represent significant markets, driven by strong automotive and packaging industries. However, emerging economies in South America and the Middle East & Africa present lucrative opportunities for future expansion as their industrial sectors develop and consumer demand increases. Competition within the EPP foam market is intense, with both large multinational corporations and regional players vying for market share. Strategic partnerships, mergers and acquisitions, and technological innovations are key competitive strategies in this rapidly evolving market. The forecast period of 2025-2033 anticipates a sustained CAGR, reflecting the continued positive market trends and increasing demand across various applications.
EPP Foam Industry Market Report: 2019-2033
This comprehensive report provides a detailed analysis of the global EPP foam industry, encompassing market dynamics, growth trends, regional landscapes, and key players. Covering the period from 2019 to 2033, with a focus on 2025, this report is an essential resource for industry professionals, investors, and strategic decision-makers seeking to understand and capitalize on the opportunities within this dynamic sector. The report's value is estimated at xx Million USD.
EPP Foam Industry Market Dynamics & Structure
The EPP foam market is characterized by moderate concentration, with several key players holding significant market share. The industry is driven by technological innovations in foam production and applications, particularly in lightweighting and sustainability. Regulatory frameworks, focusing on environmental concerns and safety standards, play a crucial role. Competitive substitutes, such as other foam types (e.g., EPS, PU) and alternative materials, influence market dynamics. End-user demographics, with a focus on automotive, packaging, and sports & leisure sectors, are key to understanding market demand. M&A activity, as seen in recent acquisitions by BEWI (IZOBLOK) and Hanwha Solutions, indicates consolidation and strategic expansion within the industry.
- Market Concentration: Moderately concentrated, with top 5 players holding approximately xx% market share (2024).
- Technological Innovation: Focus on improved material properties, bio-based alternatives, and automated production processes.
- Regulatory Framework: Stringent environmental regulations drive the adoption of sustainable materials and processes.
- Competitive Substitutes: EPS, PU foams and other lightweight materials pose competitive pressure.
- M&A Activity: Significant deals (USD xx Million in total deal value between 2019-2024) indicate industry consolidation and strategic investments.
- End-User Demographics: Automotive, packaging, and sports & leisure remain primary end-use segments.
EPP Foam Industry Growth Trends & Insights
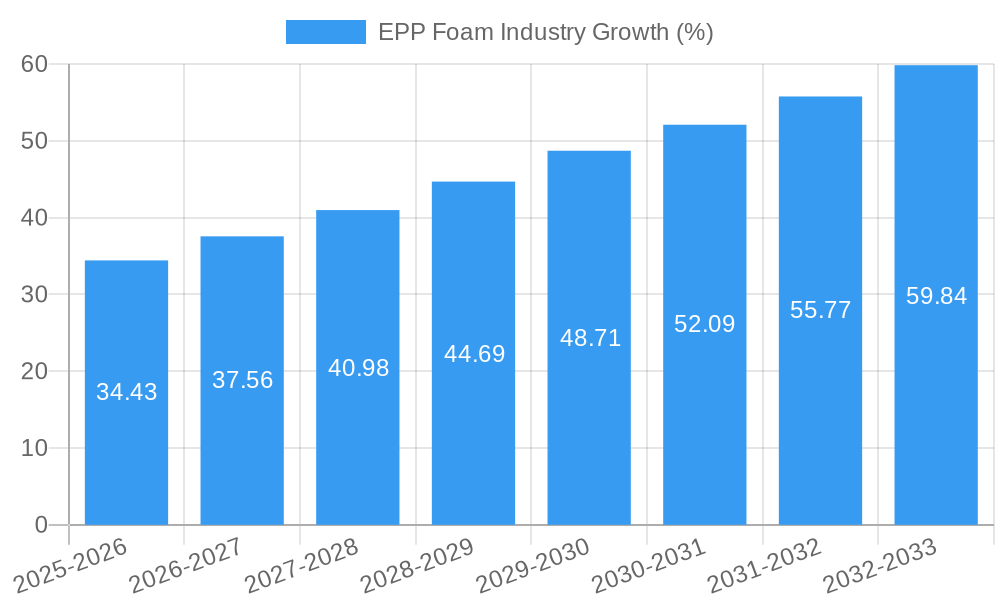
The EPP foam market experienced steady growth during the historical period (2019-2024), driven by increasing demand from key end-use sectors. The automotive industry, particularly lightweighting initiatives, significantly contributed to this growth. Technological advancements, including the development of bio-based polypropylene, propelled market expansion. Consumer preference for sustainable and eco-friendly products further fueled adoption rates. The forecast period (2025-2033) projects continued growth, albeit at a potentially moderated rate compared to the past, with technological disruptions and changing consumer behaviors posing both challenges and opportunities.
- Market Size: Estimated at xx Million units in 2025, projected to reach xx Million units by 2033.
- CAGR (2025-2033): Projected at xx%.
- Market Penetration: High penetration in automotive; growing penetration in other segments.
- Technological Disruptions: Advancements in bio-based materials, additive manufacturing, and recycling technologies are shaping the future market.
- Consumer Behavior Shifts: Increasing awareness of sustainability and eco-friendly products is a key driver.
Dominant Regions, Countries, or Segments in EPP Foam Industry
The automotive sector is currently a dominant application segment, followed by packaging and sports & leisure. North America and Europe currently hold the largest market share, fueled by strong automotive industries and stringent environmental regulations. However, Asia-Pacific is poised for significant growth due to expanding automotive production and rising disposable incomes. Molded EPP is the dominant foam type, due to its versatile applications in various industries. Synthetic polypropylene is the primary raw material, due to its cost-effectiveness and performance characteristics.
- Dominant Region: North America and Europe (approx. xx% of global market share in 2024).
- Fastest-Growing Region: Asia-Pacific (projected CAGR of xx% between 2025-2033).
- Dominant Application: Automotive (approx. xx% of global demand in 2024).
- Dominant Raw Material: Synthetic Polypropylene.
- Dominant Foam Type: Molded EPP.
- Key Growth Drivers: Increasing automotive production in Asia, growing demand for lightweight packaging, and rising investments in renewable energy infrastructure.
EPP Foam Industry Product Landscape
EPP foams are characterized by their lightweight yet robust nature, excellent shock absorption capabilities, and recyclability. Product innovations focus on enhanced material properties, tailored designs for specific applications, and the integration of bio-based components to improve sustainability. Technological advancements involve automated production methods, improved surface finishes, and the development of specialized formulations for unique performance requirements. This has led to a wider range of applications such as automotive interiors, protective packaging, and sporting goods.
Key Drivers, Barriers & Challenges in EPP Foam Industry
Key Drivers: The rising demand for lightweight materials in the automotive industry, the increasing need for durable and protective packaging, and growth in the sporting goods sector are primary drivers of market growth. Government regulations promoting sustainability are also contributing to adoption.
Key Challenges: Fluctuations in raw material prices, competition from alternative materials, and stringent environmental regulations present challenges. Supply chain disruptions, particularly those impacting polypropylene sourcing, can impact production and profitability.
Emerging Opportunities in EPP Foam Industry
Untapped markets in developing economies, particularly in Asia and Latin America, present significant opportunities. The growing demand for sustainable and recyclable packaging is opening new avenues for bio-based EPP foams. Innovation in additive manufacturing and customizable foam designs is unlocking new applications in niche sectors.
Growth Accelerators in the EPP Foam Industry Industry
Technological breakthroughs in material science, improving the properties and reducing the cost of EPP foam, are key growth accelerators. Strategic partnerships between material suppliers and end-users promote innovation and market penetration. Expansion into new applications, such as in renewable energy infrastructure and advanced medical devices, offer significant growth potential.
Key Players Shaping the EPP Foam Industry Market
- Sonoco Products Company
- Knauf Industries
- Kaneka Corporation
- Polyfoam Australia Pty Ltd
- BASF SE
- BEWi (IZOBLOK)
- K K Nag Pvt Ltd
- Clark Foam Products Corporation
- Woodbridge
- Signode Industrial Group Llc
- JSP
- Hanwha Solutions
Notable Milestones in EPP Foam Industry Sector
- March 2022: Hanwha Solutions announces the sale of a stake in its advanced materials business for USD 491 million.
- February 2022: BEWI acquires a controlling stake (63.83%) in Izoblok.
In-Depth EPP Foam Industry Market Outlook
The EPP foam industry is poised for continued growth, driven by technological advancements, sustainability initiatives, and expanding applications. Strategic investments in research and development, coupled with the exploration of new market segments, will shape the future landscape. Companies adopting innovative manufacturing processes and focusing on sustainable solutions are well-positioned to capitalize on the significant opportunities within this dynamic sector.
EPP Foam Industry Segmentation
-
1. Raw Material
- 1.1. Synthetic Polypropylene
- 1.2. Bio-based Polypropylene
-
2. Foam
- 2.1. Fabricated EPP
- 2.2. Molded EPP
- 2.3. Other Foams
-
3. Application
- 3.1. Automotive
- 3.2. Dunnage
- 3.3. Furniture
- 3.4. Food Packaging
- 3.5. HVAC
- 3.6. Sports and Leisure
- 3.7. Other Applications
EPP Foam Industry Segmentation By Geography
-
1. Asia Pacific
- 1.1. China
- 1.2. India
- 1.3. Japan
- 1.4. South Korea
- 1.5. Rest of Asia Pacific
-
2. North America
- 2.1. United States
- 2.2. Canada
- 2.3. Mexico
-
3. Europe
- 3.1. Germany
- 3.2. United Kingdom
- 3.3. France
- 3.4. Italy
- 3.5. Rest of Europe
-
4. South America
- 4.1. Brazil
- 4.2. Argentina
- 4.3. Rest of South America
-
5. Middle East and Africa
- 5.1. Saudi Arabia
- 5.2. South Africa
- 5.3. Rest of Middle East and Africa
EPP Foam Industry REPORT HIGHLIGHTS
| Aspects | Details |
|---|---|
| Study Period | 2019-2033 |
| Base Year | 2024 |
| Estimated Year | 2025 |
| Forecast Period | 2025-2033 |
| Historical Period | 2019-2024 |
| Growth Rate | CAGR of 7.21% from 2019-2033 |
| Segmentation |
|
Table of Contents
- 1. Introduction
- 1.1. Research Scope
- 1.2. Market Segmentation
- 1.3. Research Methodology
- 1.4. Definitions and Assumptions
- 2. Executive Summary
- 2.1. Introduction
- 3. Market Dynamics
- 3.1. Introduction
- 3.2. Market Drivers
- 3.2.1. Non-toxic and Recyclable Nature of the Material; Rising Demand from the Packaging Industry
- 3.3. Market Restrains
- 3.3.1. Declining Automobile Industry Through Previous Years; Higher Price Among Other Structural Foams
- 3.4. Market Trends
- 3.4.1. Increasing Usage in the Automotive Industry
- 4. Market Factor Analysis
- 4.1. Porters Five Forces
- 4.2. Supply/Value Chain
- 4.3. PESTEL analysis
- 4.4. Market Entropy
- 4.5. Patent/Trademark Analysis
- 5. Global EPP Foam Industry Analysis, Insights and Forecast, 2019-2031
- 5.1. Market Analysis, Insights and Forecast - by Raw Material
- 5.1.1. Synthetic Polypropylene
- 5.1.2. Bio-based Polypropylene
- 5.2. Market Analysis, Insights and Forecast - by Foam
- 5.2.1. Fabricated EPP
- 5.2.2. Molded EPP
- 5.2.3. Other Foams
- 5.3. Market Analysis, Insights and Forecast - by Application
- 5.3.1. Automotive
- 5.3.2. Dunnage
- 5.3.3. Furniture
- 5.3.4. Food Packaging
- 5.3.5. HVAC
- 5.3.6. Sports and Leisure
- 5.3.7. Other Applications
- 5.4. Market Analysis, Insights and Forecast - by Region
- 5.4.1. Asia Pacific
- 5.4.2. North America
- 5.4.3. Europe
- 5.4.4. South America
- 5.4.5. Middle East and Africa
- 5.1. Market Analysis, Insights and Forecast - by Raw Material
- 6. Asia Pacific EPP Foam Industry Analysis, Insights and Forecast, 2019-2031
- 6.1. Market Analysis, Insights and Forecast - by Raw Material
- 6.1.1. Synthetic Polypropylene
- 6.1.2. Bio-based Polypropylene
- 6.2. Market Analysis, Insights and Forecast - by Foam
- 6.2.1. Fabricated EPP
- 6.2.2. Molded EPP
- 6.2.3. Other Foams
- 6.3. Market Analysis, Insights and Forecast - by Application
- 6.3.1. Automotive
- 6.3.2. Dunnage
- 6.3.3. Furniture
- 6.3.4. Food Packaging
- 6.3.5. HVAC
- 6.3.6. Sports and Leisure
- 6.3.7. Other Applications
- 6.1. Market Analysis, Insights and Forecast - by Raw Material
- 7. North America EPP Foam Industry Analysis, Insights and Forecast, 2019-2031
- 7.1. Market Analysis, Insights and Forecast - by Raw Material
- 7.1.1. Synthetic Polypropylene
- 7.1.2. Bio-based Polypropylene
- 7.2. Market Analysis, Insights and Forecast - by Foam
- 7.2.1. Fabricated EPP
- 7.2.2. Molded EPP
- 7.2.3. Other Foams
- 7.3. Market Analysis, Insights and Forecast - by Application
- 7.3.1. Automotive
- 7.3.2. Dunnage
- 7.3.3. Furniture
- 7.3.4. Food Packaging
- 7.3.5. HVAC
- 7.3.6. Sports and Leisure
- 7.3.7. Other Applications
- 7.1. Market Analysis, Insights and Forecast - by Raw Material
- 8. Europe EPP Foam Industry Analysis, Insights and Forecast, 2019-2031
- 8.1. Market Analysis, Insights and Forecast - by Raw Material
- 8.1.1. Synthetic Polypropylene
- 8.1.2. Bio-based Polypropylene
- 8.2. Market Analysis, Insights and Forecast - by Foam
- 8.2.1. Fabricated EPP
- 8.2.2. Molded EPP
- 8.2.3. Other Foams
- 8.3. Market Analysis, Insights and Forecast - by Application
- 8.3.1. Automotive
- 8.3.2. Dunnage
- 8.3.3. Furniture
- 8.3.4. Food Packaging
- 8.3.5. HVAC
- 8.3.6. Sports and Leisure
- 8.3.7. Other Applications
- 8.1. Market Analysis, Insights and Forecast - by Raw Material
- 9. South America EPP Foam Industry Analysis, Insights and Forecast, 2019-2031
- 9.1. Market Analysis, Insights and Forecast - by Raw Material
- 9.1.1. Synthetic Polypropylene
- 9.1.2. Bio-based Polypropylene
- 9.2. Market Analysis, Insights and Forecast - by Foam
- 9.2.1. Fabricated EPP
- 9.2.2. Molded EPP
- 9.2.3. Other Foams
- 9.3. Market Analysis, Insights and Forecast - by Application
- 9.3.1. Automotive
- 9.3.2. Dunnage
- 9.3.3. Furniture
- 9.3.4. Food Packaging
- 9.3.5. HVAC
- 9.3.6. Sports and Leisure
- 9.3.7. Other Applications
- 9.1. Market Analysis, Insights and Forecast - by Raw Material
- 10. Middle East and Africa EPP Foam Industry Analysis, Insights and Forecast, 2019-2031
- 10.1. Market Analysis, Insights and Forecast - by Raw Material
- 10.1.1. Synthetic Polypropylene
- 10.1.2. Bio-based Polypropylene
- 10.2. Market Analysis, Insights and Forecast - by Foam
- 10.2.1. Fabricated EPP
- 10.2.2. Molded EPP
- 10.2.3. Other Foams
- 10.3. Market Analysis, Insights and Forecast - by Application
- 10.3.1. Automotive
- 10.3.2. Dunnage
- 10.3.3. Furniture
- 10.3.4. Food Packaging
- 10.3.5. HVAC
- 10.3.6. Sports and Leisure
- 10.3.7. Other Applications
- 10.1. Market Analysis, Insights and Forecast - by Raw Material
- 11. Asia Pacific EPP Foam Industry Analysis, Insights and Forecast, 2019-2031
- 11.1. Market Analysis, Insights and Forecast - By Country/Sub-region
- 11.1.1 China
- 11.1.2 India
- 11.1.3 Japan
- 11.1.4 South Korea
- 11.1.5 Rest of Asia Pacific
- 12. North America EPP Foam Industry Analysis, Insights and Forecast, 2019-2031
- 12.1. Market Analysis, Insights and Forecast - By Country/Sub-region
- 12.1.1 United States
- 12.1.2 Canada
- 12.1.3 Mexico
- 13. Europe EPP Foam Industry Analysis, Insights and Forecast, 2019-2031
- 13.1. Market Analysis, Insights and Forecast - By Country/Sub-region
- 13.1.1 Germany
- 13.1.2 United Kingdom
- 13.1.3 France
- 13.1.4 Italy
- 13.1.5 Rest of Europe
- 14. South America EPP Foam Industry Analysis, Insights and Forecast, 2019-2031
- 14.1. Market Analysis, Insights and Forecast - By Country/Sub-region
- 14.1.1 Brazil
- 14.1.2 Argentina
- 14.1.3 Rest of South America
- 15. Middle East and Africa EPP Foam Industry Analysis, Insights and Forecast, 2019-2031
- 15.1. Market Analysis, Insights and Forecast - By Country/Sub-region
- 15.1.1 Saudi Arabia
- 15.1.2 South Africa
- 15.1.3 Rest of Middle East and Africa
- 16. Competitive Analysis
- 16.1. Global Market Share Analysis 2024
- 16.2. Company Profiles
- 16.2.1 Sonoco Products Company
- 16.2.1.1. Overview
- 16.2.1.2. Products
- 16.2.1.3. SWOT Analysis
- 16.2.1.4. Recent Developments
- 16.2.1.5. Financials (Based on Availability)
- 16.2.2 Knauf Industries
- 16.2.2.1. Overview
- 16.2.2.2. Products
- 16.2.2.3. SWOT Analysis
- 16.2.2.4. Recent Developments
- 16.2.2.5. Financials (Based on Availability)
- 16.2.3 Kaneka Corporation
- 16.2.3.1. Overview
- 16.2.3.2. Products
- 16.2.3.3. SWOT Analysis
- 16.2.3.4. Recent Developments
- 16.2.3.5. Financials (Based on Availability)
- 16.2.4 Polyfoam Australia Pty Ltd
- 16.2.4.1. Overview
- 16.2.4.2. Products
- 16.2.4.3. SWOT Analysis
- 16.2.4.4. Recent Developments
- 16.2.4.5. Financials (Based on Availability)
- 16.2.5 BASF SE
- 16.2.5.1. Overview
- 16.2.5.2. Products
- 16.2.5.3. SWOT Analysis
- 16.2.5.4. Recent Developments
- 16.2.5.5. Financials (Based on Availability)
- 16.2.6 BEWi (IZOBLOK)
- 16.2.6.1. Overview
- 16.2.6.2. Products
- 16.2.6.3. SWOT Analysis
- 16.2.6.4. Recent Developments
- 16.2.6.5. Financials (Based on Availability)
- 16.2.7 K K Nag Pvt Ltd
- 16.2.7.1. Overview
- 16.2.7.2. Products
- 16.2.7.3. SWOT Analysis
- 16.2.7.4. Recent Developments
- 16.2.7.5. Financials (Based on Availability)
- 16.2.8 Clark Foam Products Corporation
- 16.2.8.1. Overview
- 16.2.8.2. Products
- 16.2.8.3. SWOT Analysis
- 16.2.8.4. Recent Developments
- 16.2.8.5. Financials (Based on Availability)
- 16.2.9 Woodbridge*List Not Exhaustive
- 16.2.9.1. Overview
- 16.2.9.2. Products
- 16.2.9.3. SWOT Analysis
- 16.2.9.4. Recent Developments
- 16.2.9.5. Financials (Based on Availability)
- 16.2.10 Signode Industrial Group Llc
- 16.2.10.1. Overview
- 16.2.10.2. Products
- 16.2.10.3. SWOT Analysis
- 16.2.10.4. Recent Developments
- 16.2.10.5. Financials (Based on Availability)
- 16.2.11 JSP
- 16.2.11.1. Overview
- 16.2.11.2. Products
- 16.2.11.3. SWOT Analysis
- 16.2.11.4. Recent Developments
- 16.2.11.5. Financials (Based on Availability)
- 16.2.12 Hanwha Solutions
- 16.2.12.1. Overview
- 16.2.12.2. Products
- 16.2.12.3. SWOT Analysis
- 16.2.12.4. Recent Developments
- 16.2.12.5. Financials (Based on Availability)
- 16.2.1 Sonoco Products Company
List of Figures
- Figure 1: Global EPP Foam Industry Revenue Breakdown (Million, %) by Region 2024 & 2032
- Figure 2: Asia Pacific EPP Foam Industry Revenue (Million), by Country 2024 & 2032
- Figure 3: Asia Pacific EPP Foam Industry Revenue Share (%), by Country 2024 & 2032
- Figure 4: North America EPP Foam Industry Revenue (Million), by Country 2024 & 2032
- Figure 5: North America EPP Foam Industry Revenue Share (%), by Country 2024 & 2032
- Figure 6: Europe EPP Foam Industry Revenue (Million), by Country 2024 & 2032
- Figure 7: Europe EPP Foam Industry Revenue Share (%), by Country 2024 & 2032
- Figure 8: South America EPP Foam Industry Revenue (Million), by Country 2024 & 2032
- Figure 9: South America EPP Foam Industry Revenue Share (%), by Country 2024 & 2032
- Figure 10: Middle East and Africa EPP Foam Industry Revenue (Million), by Country 2024 & 2032
- Figure 11: Middle East and Africa EPP Foam Industry Revenue Share (%), by Country 2024 & 2032
- Figure 12: Asia Pacific EPP Foam Industry Revenue (Million), by Raw Material 2024 & 2032
- Figure 13: Asia Pacific EPP Foam Industry Revenue Share (%), by Raw Material 2024 & 2032
- Figure 14: Asia Pacific EPP Foam Industry Revenue (Million), by Foam 2024 & 2032
- Figure 15: Asia Pacific EPP Foam Industry Revenue Share (%), by Foam 2024 & 2032
- Figure 16: Asia Pacific EPP Foam Industry Revenue (Million), by Application 2024 & 2032
- Figure 17: Asia Pacific EPP Foam Industry Revenue Share (%), by Application 2024 & 2032
- Figure 18: Asia Pacific EPP Foam Industry Revenue (Million), by Country 2024 & 2032
- Figure 19: Asia Pacific EPP Foam Industry Revenue Share (%), by Country 2024 & 2032
- Figure 20: North America EPP Foam Industry Revenue (Million), by Raw Material 2024 & 2032
- Figure 21: North America EPP Foam Industry Revenue Share (%), by Raw Material 2024 & 2032
- Figure 22: North America EPP Foam Industry Revenue (Million), by Foam 2024 & 2032
- Figure 23: North America EPP Foam Industry Revenue Share (%), by Foam 2024 & 2032
- Figure 24: North America EPP Foam Industry Revenue (Million), by Application 2024 & 2032
- Figure 25: North America EPP Foam Industry Revenue Share (%), by Application 2024 & 2032
- Figure 26: North America EPP Foam Industry Revenue (Million), by Country 2024 & 2032
- Figure 27: North America EPP Foam Industry Revenue Share (%), by Country 2024 & 2032
- Figure 28: Europe EPP Foam Industry Revenue (Million), by Raw Material 2024 & 2032
- Figure 29: Europe EPP Foam Industry Revenue Share (%), by Raw Material 2024 & 2032
- Figure 30: Europe EPP Foam Industry Revenue (Million), by Foam 2024 & 2032
- Figure 31: Europe EPP Foam Industry Revenue Share (%), by Foam 2024 & 2032
- Figure 32: Europe EPP Foam Industry Revenue (Million), by Application 2024 & 2032
- Figure 33: Europe EPP Foam Industry Revenue Share (%), by Application 2024 & 2032
- Figure 34: Europe EPP Foam Industry Revenue (Million), by Country 2024 & 2032
- Figure 35: Europe EPP Foam Industry Revenue Share (%), by Country 2024 & 2032
- Figure 36: South America EPP Foam Industry Revenue (Million), by Raw Material 2024 & 2032
- Figure 37: South America EPP Foam Industry Revenue Share (%), by Raw Material 2024 & 2032
- Figure 38: South America EPP Foam Industry Revenue (Million), by Foam 2024 & 2032
- Figure 39: South America EPP Foam Industry Revenue Share (%), by Foam 2024 & 2032
- Figure 40: South America EPP Foam Industry Revenue (Million), by Application 2024 & 2032
- Figure 41: South America EPP Foam Industry Revenue Share (%), by Application 2024 & 2032
- Figure 42: South America EPP Foam Industry Revenue (Million), by Country 2024 & 2032
- Figure 43: South America EPP Foam Industry Revenue Share (%), by Country 2024 & 2032
- Figure 44: Middle East and Africa EPP Foam Industry Revenue (Million), by Raw Material 2024 & 2032
- Figure 45: Middle East and Africa EPP Foam Industry Revenue Share (%), by Raw Material 2024 & 2032
- Figure 46: Middle East and Africa EPP Foam Industry Revenue (Million), by Foam 2024 & 2032
- Figure 47: Middle East and Africa EPP Foam Industry Revenue Share (%), by Foam 2024 & 2032
- Figure 48: Middle East and Africa EPP Foam Industry Revenue (Million), by Application 2024 & 2032
- Figure 49: Middle East and Africa EPP Foam Industry Revenue Share (%), by Application 2024 & 2032
- Figure 50: Middle East and Africa EPP Foam Industry Revenue (Million), by Country 2024 & 2032
- Figure 51: Middle East and Africa EPP Foam Industry Revenue Share (%), by Country 2024 & 2032
List of Tables
- Table 1: Global EPP Foam Industry Revenue Million Forecast, by Region 2019 & 2032
- Table 2: Global EPP Foam Industry Revenue Million Forecast, by Raw Material 2019 & 2032
- Table 3: Global EPP Foam Industry Revenue Million Forecast, by Foam 2019 & 2032
- Table 4: Global EPP Foam Industry Revenue Million Forecast, by Application 2019 & 2032
- Table 5: Global EPP Foam Industry Revenue Million Forecast, by Region 2019 & 2032
- Table 6: Global EPP Foam Industry Revenue Million Forecast, by Country 2019 & 2032
- Table 7: China EPP Foam Industry Revenue (Million) Forecast, by Application 2019 & 2032
- Table 8: India EPP Foam Industry Revenue (Million) Forecast, by Application 2019 & 2032
- Table 9: Japan EPP Foam Industry Revenue (Million) Forecast, by Application 2019 & 2032
- Table 10: South Korea EPP Foam Industry Revenue (Million) Forecast, by Application 2019 & 2032
- Table 11: Rest of Asia Pacific EPP Foam Industry Revenue (Million) Forecast, by Application 2019 & 2032
- Table 12: Global EPP Foam Industry Revenue Million Forecast, by Country 2019 & 2032
- Table 13: United States EPP Foam Industry Revenue (Million) Forecast, by Application 2019 & 2032
- Table 14: Canada EPP Foam Industry Revenue (Million) Forecast, by Application 2019 & 2032
- Table 15: Mexico EPP Foam Industry Revenue (Million) Forecast, by Application 2019 & 2032
- Table 16: Global EPP Foam Industry Revenue Million Forecast, by Country 2019 & 2032
- Table 17: Germany EPP Foam Industry Revenue (Million) Forecast, by Application 2019 & 2032
- Table 18: United Kingdom EPP Foam Industry Revenue (Million) Forecast, by Application 2019 & 2032
- Table 19: France EPP Foam Industry Revenue (Million) Forecast, by Application 2019 & 2032
- Table 20: Italy EPP Foam Industry Revenue (Million) Forecast, by Application 2019 & 2032
- Table 21: Rest of Europe EPP Foam Industry Revenue (Million) Forecast, by Application 2019 & 2032
- Table 22: Global EPP Foam Industry Revenue Million Forecast, by Country 2019 & 2032
- Table 23: Brazil EPP Foam Industry Revenue (Million) Forecast, by Application 2019 & 2032
- Table 24: Argentina EPP Foam Industry Revenue (Million) Forecast, by Application 2019 & 2032
- Table 25: Rest of South America EPP Foam Industry Revenue (Million) Forecast, by Application 2019 & 2032
- Table 26: Global EPP Foam Industry Revenue Million Forecast, by Country 2019 & 2032
- Table 27: Saudi Arabia EPP Foam Industry Revenue (Million) Forecast, by Application 2019 & 2032
- Table 28: South Africa EPP Foam Industry Revenue (Million) Forecast, by Application 2019 & 2032
- Table 29: Rest of Middle East and Africa EPP Foam Industry Revenue (Million) Forecast, by Application 2019 & 2032
- Table 30: Global EPP Foam Industry Revenue Million Forecast, by Raw Material 2019 & 2032
- Table 31: Global EPP Foam Industry Revenue Million Forecast, by Foam 2019 & 2032
- Table 32: Global EPP Foam Industry Revenue Million Forecast, by Application 2019 & 2032
- Table 33: Global EPP Foam Industry Revenue Million Forecast, by Country 2019 & 2032
- Table 34: China EPP Foam Industry Revenue (Million) Forecast, by Application 2019 & 2032
- Table 35: India EPP Foam Industry Revenue (Million) Forecast, by Application 2019 & 2032
- Table 36: Japan EPP Foam Industry Revenue (Million) Forecast, by Application 2019 & 2032
- Table 37: South Korea EPP Foam Industry Revenue (Million) Forecast, by Application 2019 & 2032
- Table 38: Rest of Asia Pacific EPP Foam Industry Revenue (Million) Forecast, by Application 2019 & 2032
- Table 39: Global EPP Foam Industry Revenue Million Forecast, by Raw Material 2019 & 2032
- Table 40: Global EPP Foam Industry Revenue Million Forecast, by Foam 2019 & 2032
- Table 41: Global EPP Foam Industry Revenue Million Forecast, by Application 2019 & 2032
- Table 42: Global EPP Foam Industry Revenue Million Forecast, by Country 2019 & 2032
- Table 43: United States EPP Foam Industry Revenue (Million) Forecast, by Application 2019 & 2032
- Table 44: Canada EPP Foam Industry Revenue (Million) Forecast, by Application 2019 & 2032
- Table 45: Mexico EPP Foam Industry Revenue (Million) Forecast, by Application 2019 & 2032
- Table 46: Global EPP Foam Industry Revenue Million Forecast, by Raw Material 2019 & 2032
- Table 47: Global EPP Foam Industry Revenue Million Forecast, by Foam 2019 & 2032
- Table 48: Global EPP Foam Industry Revenue Million Forecast, by Application 2019 & 2032
- Table 49: Global EPP Foam Industry Revenue Million Forecast, by Country 2019 & 2032
- Table 50: Germany EPP Foam Industry Revenue (Million) Forecast, by Application 2019 & 2032
- Table 51: United Kingdom EPP Foam Industry Revenue (Million) Forecast, by Application 2019 & 2032
- Table 52: France EPP Foam Industry Revenue (Million) Forecast, by Application 2019 & 2032
- Table 53: Italy EPP Foam Industry Revenue (Million) Forecast, by Application 2019 & 2032
- Table 54: Rest of Europe EPP Foam Industry Revenue (Million) Forecast, by Application 2019 & 2032
- Table 55: Global EPP Foam Industry Revenue Million Forecast, by Raw Material 2019 & 2032
- Table 56: Global EPP Foam Industry Revenue Million Forecast, by Foam 2019 & 2032
- Table 57: Global EPP Foam Industry Revenue Million Forecast, by Application 2019 & 2032
- Table 58: Global EPP Foam Industry Revenue Million Forecast, by Country 2019 & 2032
- Table 59: Brazil EPP Foam Industry Revenue (Million) Forecast, by Application 2019 & 2032
- Table 60: Argentina EPP Foam Industry Revenue (Million) Forecast, by Application 2019 & 2032
- Table 61: Rest of South America EPP Foam Industry Revenue (Million) Forecast, by Application 2019 & 2032
- Table 62: Global EPP Foam Industry Revenue Million Forecast, by Raw Material 2019 & 2032
- Table 63: Global EPP Foam Industry Revenue Million Forecast, by Foam 2019 & 2032
- Table 64: Global EPP Foam Industry Revenue Million Forecast, by Application 2019 & 2032
- Table 65: Global EPP Foam Industry Revenue Million Forecast, by Country 2019 & 2032
- Table 66: Saudi Arabia EPP Foam Industry Revenue (Million) Forecast, by Application 2019 & 2032
- Table 67: South Africa EPP Foam Industry Revenue (Million) Forecast, by Application 2019 & 2032
- Table 68: Rest of Middle East and Africa EPP Foam Industry Revenue (Million) Forecast, by Application 2019 & 2032
Frequently Asked Questions
1. What is the projected Compound Annual Growth Rate (CAGR) of the EPP Foam Industry?
The projected CAGR is approximately 7.21%.
2. Which companies are prominent players in the EPP Foam Industry?
Key companies in the market include Sonoco Products Company, Knauf Industries, Kaneka Corporation, Polyfoam Australia Pty Ltd, BASF SE, BEWi (IZOBLOK), K K Nag Pvt Ltd, Clark Foam Products Corporation, Woodbridge*List Not Exhaustive, Signode Industrial Group Llc, JSP, Hanwha Solutions.
3. What are the main segments of the EPP Foam Industry?
The market segments include Raw Material, Foam, Application.
4. Can you provide details about the market size?
The market size is estimated to be USD 469.83 Million as of 2022.
5. What are some drivers contributing to market growth?
Non-toxic and Recyclable Nature of the Material; Rising Demand from the Packaging Industry.
6. What are the notable trends driving market growth?
Increasing Usage in the Automotive Industry.
7. Are there any restraints impacting market growth?
Declining Automobile Industry Through Previous Years; Higher Price Among Other Structural Foams.
8. Can you provide examples of recent developments in the market?
March 2022: Hanwha Solutions has announced that the company is set to split off its advanced materials business and sell a stake in the unit to raise USD 491 million for investments at home and abroad. The sell-off was considered first in November 2021. Private equity firm Glenwood PE has planned to buy a 49% stake in the division for KRW 600 billion (USD 491.4 million), becoming its second-largest shareholder after Hanwha.
9. What pricing options are available for accessing the report?
Pricing options include single-user, multi-user, and enterprise licenses priced at USD 4750, USD 5250, and USD 8750 respectively.
10. Is the market size provided in terms of value or volume?
The market size is provided in terms of value, measured in Million.
11. Are there any specific market keywords associated with the report?
Yes, the market keyword associated with the report is "EPP Foam Industry," which aids in identifying and referencing the specific market segment covered.
12. How do I determine which pricing option suits my needs best?
The pricing options vary based on user requirements and access needs. Individual users may opt for single-user licenses, while businesses requiring broader access may choose multi-user or enterprise licenses for cost-effective access to the report.
13. Are there any additional resources or data provided in the EPP Foam Industry report?
While the report offers comprehensive insights, it's advisable to review the specific contents or supplementary materials provided to ascertain if additional resources or data are available.
14. How can I stay updated on further developments or reports in the EPP Foam Industry?
To stay informed about further developments, trends, and reports in the EPP Foam Industry, consider subscribing to industry newsletters, following relevant companies and organizations, or regularly checking reputable industry news sources and publications.
Methodology
Step 1 - Identification of Relevant Samples Size from Population Database


Step 2 - Approaches for Defining Global Market Size (Value, Volume* & Price*)

Note*: In applicable scenarios
Step 3 - Data Sources
Primary Research
- Web Analytics
- Survey Reports
- Research Institute
- Latest Research Reports
- Opinion Leaders
Secondary Research
- Annual Reports
- White Paper
- Latest Press Release
- Industry Association
- Paid Database
- Investor Presentations

Step 4 - Data Triangulation
Involves using different sources of information in order to increase the validity of a study
These sources are likely to be stakeholders in a program - participants, other researchers, program staff, other community members, and so on.
Then we put all data in single framework & apply various statistical tools to find out the dynamic on the market.
During the analysis stage, feedback from the stakeholder groups would be compared to determine areas of agreement as well as areas of divergence
