

Key Insights
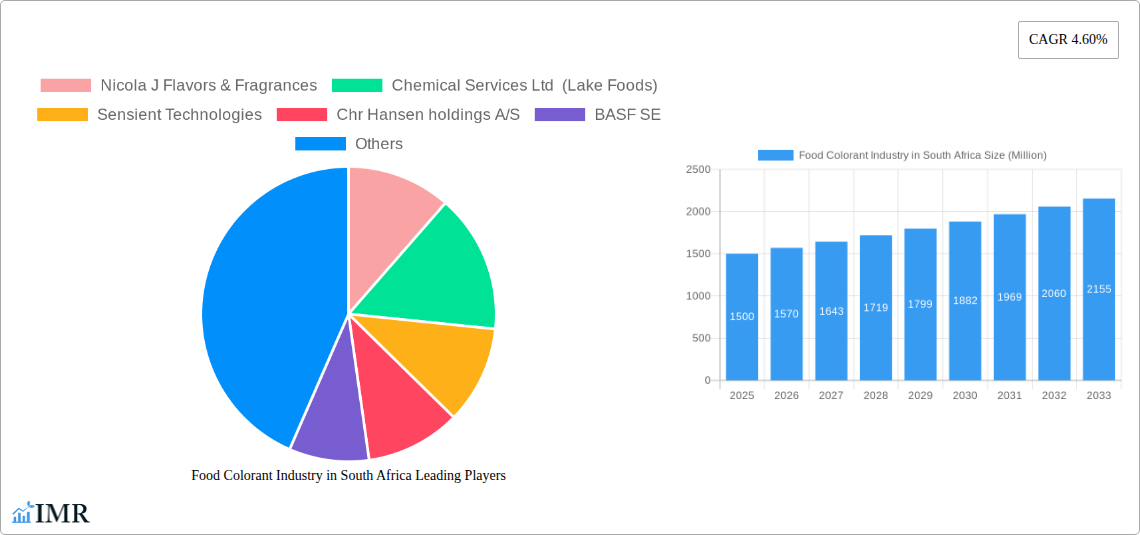
The South African food colorant market, valued at approximately ZAR 1.5 billion (estimated based on global trends and regional economic data) in 2025, is projected to experience robust growth, driven by increasing demand from the food processing industry. This growth is fueled by several key factors: a rising consumer preference for visually appealing food products, particularly in the bakery, confectionery, and beverage sectors; expanding urbanization and a growing middle class with higher disposable incomes; and the increasing adoption of convenient, ready-to-eat meals. The market is segmented by product type (natural and synthetic colorants) and application (bakery, dairy, confectionery, meat, beverages, etc.), with natural food colorants experiencing a faster growth rate due to rising health consciousness among consumers. However, stringent regulatory frameworks regarding the use of synthetic colorants and fluctuating raw material prices pose challenges to market expansion. Major players, including international companies like Sensient Technologies and Chr. Hansen, alongside local players, are investing in research and development to meet evolving consumer demands and introduce innovative products.
The forecast period of 2025-2033 anticipates a continued upward trajectory, with a projected Compound Annual Growth Rate (CAGR) of 4.60%. This growth will likely be driven by strategic partnerships and mergers and acquisitions among key players. The introduction of novel colorants with enhanced stability and natural origins is expected to further fuel the market's expansion. Regional variations within South Africa itself may exist, with larger urban centers likely exhibiting higher consumption rates compared to rural areas. Further research into specific consumption patterns within different regions of South Africa would provide a more granular understanding of market dynamics. The South African market will likely witness increased competition as both domestic and international players vie for market share.
Food Colorant Industry in South Africa: A Comprehensive Market Report (2019-2033)
This in-depth report provides a comprehensive analysis of the South African food colorant industry, covering market dynamics, growth trends, key players, and future outlook. The report utilizes data from the historical period (2019-2024), base year (2025), and forecasts the market's trajectory until 2033. This report is ideal for industry professionals, investors, and anyone seeking a detailed understanding of this dynamic market. Market values are presented in million units.
Food Colorant Industry in South Africa Market Dynamics & Structure
The South African food colorant market is characterized by a moderate level of concentration, with several major players and a number of smaller, niche operators. Technological innovation, primarily driven by the demand for natural colorants and improved color stability, is a key driver. Stringent regulatory frameworks, aligning with international food safety standards, influence product development and market access. Synthetic food colorants face increasing competition from natural alternatives, driven by consumer preference shifts towards healthier options. End-user demographics are diverse, encompassing a wide range of food and beverage manufacturers targeting varied consumer segments. Mergers and acquisitions (M&A) activity has been relatively modest in recent years, though strategic partnerships are becoming increasingly common.
- Market Concentration: Moderately concentrated, with a top 5 market share of approximately 65% in 2025.
- Technological Innovation: Focus on natural colorants, improved color stability, and sustainable production methods.
- Regulatory Framework: Stringent regulations aligned with international standards (e.g., EU, Codex Alimentarius).
- Competitive Substitutes: Natural colorants increasingly compete with synthetic alternatives.
- M&A Activity: Low to moderate, with a projected xx M&A deals in the forecast period.
- Innovation Barriers: High R&D costs for natural colorants, stringent regulatory approvals.
Food Colorant Industry in South Africa Growth Trends & Insights
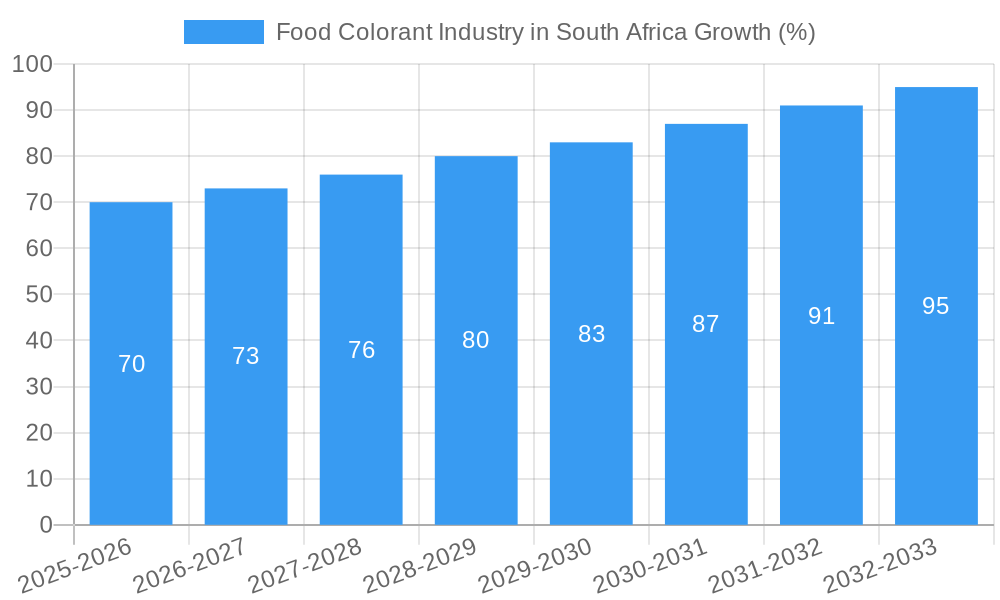
The South African food colorant market experienced steady growth during the historical period (2019-2024). This growth is attributed to factors such as the expanding food and beverage sector, rising disposable incomes, and increasing demand for processed foods. The market is further segmented by product type (synthetic and natural food colorants) and application (bakery, dairy & frozen products, confectionery, meat, poultry & seafood, beverages, and others). The market size in 2025 is estimated at XXX million, with a projected Compound Annual Growth Rate (CAGR) of xx% from 2025 to 2033. This growth is influenced by consumer preference shifts toward natural ingredients, technological advancements, and evolving food processing techniques. Market penetration of natural colorants is expected to increase significantly during this period. The adoption rate for natural colorants is rising rapidly, driven by health-conscious consumers. Technological disruptions are pushing the industry towards more sustainable and efficient production processes.
Dominant Regions, Countries, or Segments in Food Colorant Industry in South Africa
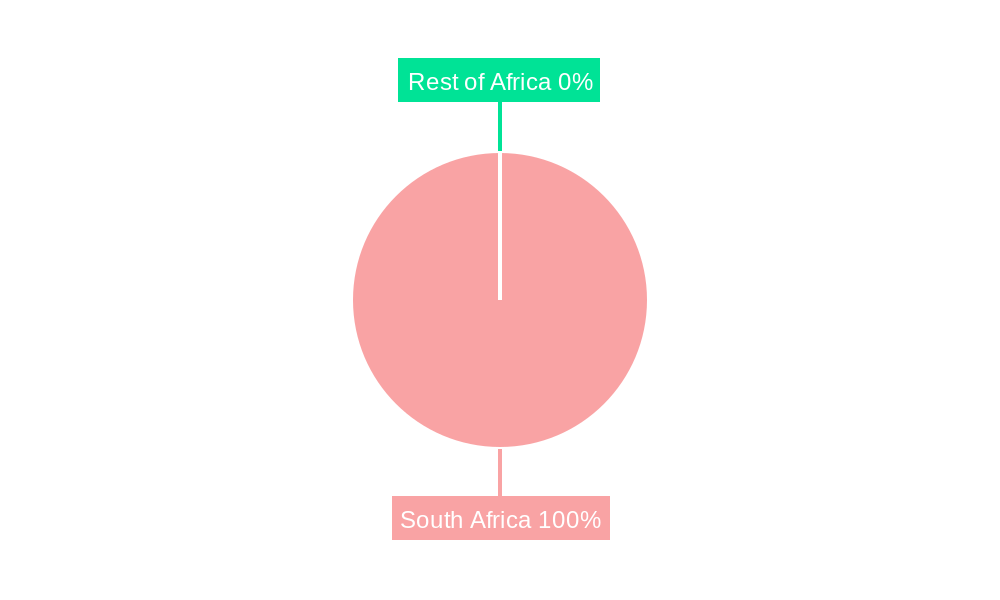
The Gauteng province dominates the South African food colorant market, driven by its high concentration of food processing facilities and a large consumer base. Within the product segments, natural food colorants are experiencing faster growth rates than synthetic alternatives, driven by increasing health consciousness. In terms of applications, the bakery and confectionery sectors represent significant market shares, followed by the beverage and dairy industries.
- Dominant Region: Gauteng.
- Fastest Growing Segment (By Product Type): Natural Food Colorants, with a projected CAGR of xx% during the forecast period.
- Largest Segment (By Application): Bakery, followed by Confectionery.
- Key Drivers: Rising disposable income, growing demand for processed and convenience foods, expanding food manufacturing sector.
Food Colorant Industry in South Africa Product Landscape
The South African food colorant market offers a diverse range of products, including synthetic and natural colorants, catering to different application needs and consumer preferences. Recent innovations focus on enhancing color stability, improving natural colorant extraction techniques, and developing eco-friendly production methods. Unique selling propositions emphasize natural origins, superior color intensity, and extended shelf life. Technological advancements include the use of nanotechnology for controlled color release and the development of water-soluble, oil-soluble, and powder-based formulations.
Key Drivers, Barriers & Challenges in Food Colorant Industry in South Africa
Key Drivers:
- Growing demand for processed foods.
- Increasing consumer preference for appealing food aesthetics.
- Expanding food and beverage manufacturing sector.
Key Challenges and Restraints:
- Fluctuating raw material prices, particularly for natural colorants.
- Stringent regulatory requirements impacting product development and market entry.
- Intense competition from both domestic and international players.
- Supply chain disruptions due to geopolitical factors.
- Estimated impact of these restraints: xx million loss in potential revenue annually.
Emerging Opportunities in Food Colorant Industry in South Africa
- Growing demand for clean-label products.
- Increasing preference for natural and organic colorants.
- Opportunities in functional food applications.
- Expansion into niche markets, such as plant-based foods.
Growth Accelerators in the Food Colorant Industry in South Africa Industry
Long-term growth will be driven by technological advancements in natural colorant production, strategic partnerships between colorant manufacturers and food producers, and expansion into new markets (e.g., the growing health and wellness sector). Investment in R&D and the development of sustainable and cost-effective manufacturing processes will be crucial for sustaining market growth.
Key Players Shaping the Food Colorant Industry in South Africa Market
- Nicola J Flavors & Fragrances
- Chemical Services Ltd (Lake Foods)
- Sensient Technologies
- Chr Hansen holdings A/S
- BASF SE
- Quantum Colors S
- EDCOL
Notable Milestones in Food Colorant Industry in South Africa Sector
- 2021: Introduction of a new range of natural colorants by Sensient Technologies.
- 2022: Implementation of stricter regulatory standards for food colorants.
- 2023: Launch of a sustainable production facility by BASF SE.
- 2024: Acquisition of a smaller colorant manufacturer by Nicola J Flavors & Fragrances.
In-Depth Food Colorant Industry in South Africa Market Outlook
The future of the South African food colorant market appears positive, with continued growth projected throughout the forecast period. Strategic partnerships, technological innovations focused on natural and sustainable options, and a growing demand from the expanding food and beverage sector will be key drivers of future growth. The market offers significant potential for companies that can effectively address consumer preferences for clean-label products and meet the increasingly stringent regulatory requirements.
Food Colorant Industry in South Africa Segmentation
-
1. Product Type
- 1.1. Synthetic Food colorants
- 1.2. Natural Food Colorants
-
2. Application
- 2.1. Bakery
- 2.2. Dairy & Frozen products
- 2.3. Confectionery
- 2.4. Meat poultry & Sea Food products
- 2.5. Beverages
- 2.6. Others
Food Colorant Industry in South Africa Segmentation By Geography
-
1. North America
- 1.1. United States
- 1.2. Canada
- 1.3. Mexico
-
2. South America
- 2.1. Brazil
- 2.2. Argentina
- 2.3. Rest of South America
-
3. Europe
- 3.1. United Kingdom
- 3.2. Germany
- 3.3. France
- 3.4. Italy
- 3.5. Spain
- 3.6. Russia
- 3.7. Benelux
- 3.8. Nordics
- 3.9. Rest of Europe
-
4. Middle East & Africa
- 4.1. Turkey
- 4.2. Israel
- 4.3. GCC
- 4.4. North Africa
- 4.5. South Africa
- 4.6. Rest of Middle East & Africa
-
5. Asia Pacific
- 5.1. China
- 5.2. India
- 5.3. Japan
- 5.4. South Korea
- 5.5. ASEAN
- 5.6. Oceania
- 5.7. Rest of Asia Pacific
Food Colorant Industry in South Africa REPORT HIGHLIGHTS
| Aspects | Details |
|---|---|
| Study Period | 2019-2033 |
| Base Year | 2024 |
| Estimated Year | 2025 |
| Forecast Period | 2025-2033 |
| Historical Period | 2019-2024 |
| Growth Rate | CAGR of 4.60% from 2019-2033 |
| Segmentation |
|
Table of Contents
- 1. Introduction
- 1.1. Research Scope
- 1.2. Market Segmentation
- 1.3. Research Methodology
- 1.4. Definitions and Assumptions
- 2. Executive Summary
- 2.1. Introduction
- 3. Market Dynamics
- 3.1. Introduction
- 3.2. Market Drivers
- 3.2.1. Rising Health Consciousness among consumer
- 3.3. Market Restrains
- 3.3.1. High Cost of natural Ingredients
- 3.4. Market Trends
- 3.4.1. Growing Emergence of Natural Color
- 4. Market Factor Analysis
- 4.1. Porters Five Forces
- 4.2. Supply/Value Chain
- 4.3. PESTEL analysis
- 4.4. Market Entropy
- 4.5. Patent/Trademark Analysis
- 5. Global Food Colorant Industry in South Africa Analysis, Insights and Forecast, 2019-2031
- 5.1. Market Analysis, Insights and Forecast - by Product Type
- 5.1.1. Synthetic Food colorants
- 5.1.2. Natural Food Colorants
- 5.2. Market Analysis, Insights and Forecast - by Application
- 5.2.1. Bakery
- 5.2.2. Dairy & Frozen products
- 5.2.3. Confectionery
- 5.2.4. Meat poultry & Sea Food products
- 5.2.5. Beverages
- 5.2.6. Others
- 5.3. Market Analysis, Insights and Forecast - by Region
- 5.3.1. North America
- 5.3.2. South America
- 5.3.3. Europe
- 5.3.4. Middle East & Africa
- 5.3.5. Asia Pacific
- 5.1. Market Analysis, Insights and Forecast - by Product Type
- 6. North America Food Colorant Industry in South Africa Analysis, Insights and Forecast, 2019-2031
- 6.1. Market Analysis, Insights and Forecast - by Product Type
- 6.1.1. Synthetic Food colorants
- 6.1.2. Natural Food Colorants
- 6.2. Market Analysis, Insights and Forecast - by Application
- 6.2.1. Bakery
- 6.2.2. Dairy & Frozen products
- 6.2.3. Confectionery
- 6.2.4. Meat poultry & Sea Food products
- 6.2.5. Beverages
- 6.2.6. Others
- 6.1. Market Analysis, Insights and Forecast - by Product Type
- 7. South America Food Colorant Industry in South Africa Analysis, Insights and Forecast, 2019-2031
- 7.1. Market Analysis, Insights and Forecast - by Product Type
- 7.1.1. Synthetic Food colorants
- 7.1.2. Natural Food Colorants
- 7.2. Market Analysis, Insights and Forecast - by Application
- 7.2.1. Bakery
- 7.2.2. Dairy & Frozen products
- 7.2.3. Confectionery
- 7.2.4. Meat poultry & Sea Food products
- 7.2.5. Beverages
- 7.2.6. Others
- 7.1. Market Analysis, Insights and Forecast - by Product Type
- 8. Europe Food Colorant Industry in South Africa Analysis, Insights and Forecast, 2019-2031
- 8.1. Market Analysis, Insights and Forecast - by Product Type
- 8.1.1. Synthetic Food colorants
- 8.1.2. Natural Food Colorants
- 8.2. Market Analysis, Insights and Forecast - by Application
- 8.2.1. Bakery
- 8.2.2. Dairy & Frozen products
- 8.2.3. Confectionery
- 8.2.4. Meat poultry & Sea Food products
- 8.2.5. Beverages
- 8.2.6. Others
- 8.1. Market Analysis, Insights and Forecast - by Product Type
- 9. Middle East & Africa Food Colorant Industry in South Africa Analysis, Insights and Forecast, 2019-2031
- 9.1. Market Analysis, Insights and Forecast - by Product Type
- 9.1.1. Synthetic Food colorants
- 9.1.2. Natural Food Colorants
- 9.2. Market Analysis, Insights and Forecast - by Application
- 9.2.1. Bakery
- 9.2.2. Dairy & Frozen products
- 9.2.3. Confectionery
- 9.2.4. Meat poultry & Sea Food products
- 9.2.5. Beverages
- 9.2.6. Others
- 9.1. Market Analysis, Insights and Forecast - by Product Type
- 10. Asia Pacific Food Colorant Industry in South Africa Analysis, Insights and Forecast, 2019-2031
- 10.1. Market Analysis, Insights and Forecast - by Product Type
- 10.1.1. Synthetic Food colorants
- 10.1.2. Natural Food Colorants
- 10.2. Market Analysis, Insights and Forecast - by Application
- 10.2.1. Bakery
- 10.2.2. Dairy & Frozen products
- 10.2.3. Confectionery
- 10.2.4. Meat poultry & Sea Food products
- 10.2.5. Beverages
- 10.2.6. Others
- 10.1. Market Analysis, Insights and Forecast - by Product Type
- 11. South Africa Food Colorant Industry in South Africa Analysis, Insights and Forecast, 2019-2031
- 12. Sudan Food Colorant Industry in South Africa Analysis, Insights and Forecast, 2019-2031
- 13. Uganda Food Colorant Industry in South Africa Analysis, Insights and Forecast, 2019-2031
- 14. Tanzania Food Colorant Industry in South Africa Analysis, Insights and Forecast, 2019-2031
- 15. Kenya Food Colorant Industry in South Africa Analysis, Insights and Forecast, 2019-2031
- 16. Rest of Africa Food Colorant Industry in South Africa Analysis, Insights and Forecast, 2019-2031
- 17. Competitive Analysis
- 17.1. Global Market Share Analysis 2024
- 17.2. Company Profiles
- 17.2.1 Nicola J Flavors & Fragrances
- 17.2.1.1. Overview
- 17.2.1.2. Products
- 17.2.1.3. SWOT Analysis
- 17.2.1.4. Recent Developments
- 17.2.1.5. Financials (Based on Availability)
- 17.2.2 Chemical Services Ltd (Lake Foods)
- 17.2.2.1. Overview
- 17.2.2.2. Products
- 17.2.2.3. SWOT Analysis
- 17.2.2.4. Recent Developments
- 17.2.2.5. Financials (Based on Availability)
- 17.2.3 Sensient Technologies
- 17.2.3.1. Overview
- 17.2.3.2. Products
- 17.2.3.3. SWOT Analysis
- 17.2.3.4. Recent Developments
- 17.2.3.5. Financials (Based on Availability)
- 17.2.4 Chr Hansen holdings A/S
- 17.2.4.1. Overview
- 17.2.4.2. Products
- 17.2.4.3. SWOT Analysis
- 17.2.4.4. Recent Developments
- 17.2.4.5. Financials (Based on Availability)
- 17.2.5 BASF SE
- 17.2.5.1. Overview
- 17.2.5.2. Products
- 17.2.5.3. SWOT Analysis
- 17.2.5.4. Recent Developments
- 17.2.5.5. Financials (Based on Availability)
- 17.2.6 Quantum Colors S
- 17.2.6.1. Overview
- 17.2.6.2. Products
- 17.2.6.3. SWOT Analysis
- 17.2.6.4. Recent Developments
- 17.2.6.5. Financials (Based on Availability)
- 17.2.7 EDCOL
- 17.2.7.1. Overview
- 17.2.7.2. Products
- 17.2.7.3. SWOT Analysis
- 17.2.7.4. Recent Developments
- 17.2.7.5. Financials (Based on Availability)
- 17.2.1 Nicola J Flavors & Fragrances
List of Figures
- Figure 1: Global Food Colorant Industry in South Africa Revenue Breakdown (Million, %) by Region 2024 & 2032
- Figure 2: Africa Food Colorant Industry in South Africa Revenue (Million), by Country 2024 & 2032
- Figure 3: Africa Food Colorant Industry in South Africa Revenue Share (%), by Country 2024 & 2032
- Figure 4: North America Food Colorant Industry in South Africa Revenue (Million), by Product Type 2024 & 2032
- Figure 5: North America Food Colorant Industry in South Africa Revenue Share (%), by Product Type 2024 & 2032
- Figure 6: North America Food Colorant Industry in South Africa Revenue (Million), by Application 2024 & 2032
- Figure 7: North America Food Colorant Industry in South Africa Revenue Share (%), by Application 2024 & 2032
- Figure 8: North America Food Colorant Industry in South Africa Revenue (Million), by Country 2024 & 2032
- Figure 9: North America Food Colorant Industry in South Africa Revenue Share (%), by Country 2024 & 2032
- Figure 10: South America Food Colorant Industry in South Africa Revenue (Million), by Product Type 2024 & 2032
- Figure 11: South America Food Colorant Industry in South Africa Revenue Share (%), by Product Type 2024 & 2032
- Figure 12: South America Food Colorant Industry in South Africa Revenue (Million), by Application 2024 & 2032
- Figure 13: South America Food Colorant Industry in South Africa Revenue Share (%), by Application 2024 & 2032
- Figure 14: South America Food Colorant Industry in South Africa Revenue (Million), by Country 2024 & 2032
- Figure 15: South America Food Colorant Industry in South Africa Revenue Share (%), by Country 2024 & 2032
- Figure 16: Europe Food Colorant Industry in South Africa Revenue (Million), by Product Type 2024 & 2032
- Figure 17: Europe Food Colorant Industry in South Africa Revenue Share (%), by Product Type 2024 & 2032
- Figure 18: Europe Food Colorant Industry in South Africa Revenue (Million), by Application 2024 & 2032
- Figure 19: Europe Food Colorant Industry in South Africa Revenue Share (%), by Application 2024 & 2032
- Figure 20: Europe Food Colorant Industry in South Africa Revenue (Million), by Country 2024 & 2032
- Figure 21: Europe Food Colorant Industry in South Africa Revenue Share (%), by Country 2024 & 2032
- Figure 22: Middle East & Africa Food Colorant Industry in South Africa Revenue (Million), by Product Type 2024 & 2032
- Figure 23: Middle East & Africa Food Colorant Industry in South Africa Revenue Share (%), by Product Type 2024 & 2032
- Figure 24: Middle East & Africa Food Colorant Industry in South Africa Revenue (Million), by Application 2024 & 2032
- Figure 25: Middle East & Africa Food Colorant Industry in South Africa Revenue Share (%), by Application 2024 & 2032
- Figure 26: Middle East & Africa Food Colorant Industry in South Africa Revenue (Million), by Country 2024 & 2032
- Figure 27: Middle East & Africa Food Colorant Industry in South Africa Revenue Share (%), by Country 2024 & 2032
- Figure 28: Asia Pacific Food Colorant Industry in South Africa Revenue (Million), by Product Type 2024 & 2032
- Figure 29: Asia Pacific Food Colorant Industry in South Africa Revenue Share (%), by Product Type 2024 & 2032
- Figure 30: Asia Pacific Food Colorant Industry in South Africa Revenue (Million), by Application 2024 & 2032
- Figure 31: Asia Pacific Food Colorant Industry in South Africa Revenue Share (%), by Application 2024 & 2032
- Figure 32: Asia Pacific Food Colorant Industry in South Africa Revenue (Million), by Country 2024 & 2032
- Figure 33: Asia Pacific Food Colorant Industry in South Africa Revenue Share (%), by Country 2024 & 2032
List of Tables
- Table 1: Global Food Colorant Industry in South Africa Revenue Million Forecast, by Region 2019 & 2032
- Table 2: Global Food Colorant Industry in South Africa Revenue Million Forecast, by Product Type 2019 & 2032
- Table 3: Global Food Colorant Industry in South Africa Revenue Million Forecast, by Application 2019 & 2032
- Table 4: Global Food Colorant Industry in South Africa Revenue Million Forecast, by Region 2019 & 2032
- Table 5: Global Food Colorant Industry in South Africa Revenue Million Forecast, by Country 2019 & 2032
- Table 6: South Africa Food Colorant Industry in South Africa Revenue (Million) Forecast, by Application 2019 & 2032
- Table 7: Sudan Food Colorant Industry in South Africa Revenue (Million) Forecast, by Application 2019 & 2032
- Table 8: Uganda Food Colorant Industry in South Africa Revenue (Million) Forecast, by Application 2019 & 2032
- Table 9: Tanzania Food Colorant Industry in South Africa Revenue (Million) Forecast, by Application 2019 & 2032
- Table 10: Kenya Food Colorant Industry in South Africa Revenue (Million) Forecast, by Application 2019 & 2032
- Table 11: Rest of Africa Food Colorant Industry in South Africa Revenue (Million) Forecast, by Application 2019 & 2032
- Table 12: Global Food Colorant Industry in South Africa Revenue Million Forecast, by Product Type 2019 & 2032
- Table 13: Global Food Colorant Industry in South Africa Revenue Million Forecast, by Application 2019 & 2032
- Table 14: Global Food Colorant Industry in South Africa Revenue Million Forecast, by Country 2019 & 2032
- Table 15: United States Food Colorant Industry in South Africa Revenue (Million) Forecast, by Application 2019 & 2032
- Table 16: Canada Food Colorant Industry in South Africa Revenue (Million) Forecast, by Application 2019 & 2032
- Table 17: Mexico Food Colorant Industry in South Africa Revenue (Million) Forecast, by Application 2019 & 2032
- Table 18: Global Food Colorant Industry in South Africa Revenue Million Forecast, by Product Type 2019 & 2032
- Table 19: Global Food Colorant Industry in South Africa Revenue Million Forecast, by Application 2019 & 2032
- Table 20: Global Food Colorant Industry in South Africa Revenue Million Forecast, by Country 2019 & 2032
- Table 21: Brazil Food Colorant Industry in South Africa Revenue (Million) Forecast, by Application 2019 & 2032
- Table 22: Argentina Food Colorant Industry in South Africa Revenue (Million) Forecast, by Application 2019 & 2032
- Table 23: Rest of South America Food Colorant Industry in South Africa Revenue (Million) Forecast, by Application 2019 & 2032
- Table 24: Global Food Colorant Industry in South Africa Revenue Million Forecast, by Product Type 2019 & 2032
- Table 25: Global Food Colorant Industry in South Africa Revenue Million Forecast, by Application 2019 & 2032
- Table 26: Global Food Colorant Industry in South Africa Revenue Million Forecast, by Country 2019 & 2032
- Table 27: United Kingdom Food Colorant Industry in South Africa Revenue (Million) Forecast, by Application 2019 & 2032
- Table 28: Germany Food Colorant Industry in South Africa Revenue (Million) Forecast, by Application 2019 & 2032
- Table 29: France Food Colorant Industry in South Africa Revenue (Million) Forecast, by Application 2019 & 2032
- Table 30: Italy Food Colorant Industry in South Africa Revenue (Million) Forecast, by Application 2019 & 2032
- Table 31: Spain Food Colorant Industry in South Africa Revenue (Million) Forecast, by Application 2019 & 2032
- Table 32: Russia Food Colorant Industry in South Africa Revenue (Million) Forecast, by Application 2019 & 2032
- Table 33: Benelux Food Colorant Industry in South Africa Revenue (Million) Forecast, by Application 2019 & 2032
- Table 34: Nordics Food Colorant Industry in South Africa Revenue (Million) Forecast, by Application 2019 & 2032
- Table 35: Rest of Europe Food Colorant Industry in South Africa Revenue (Million) Forecast, by Application 2019 & 2032
- Table 36: Global Food Colorant Industry in South Africa Revenue Million Forecast, by Product Type 2019 & 2032
- Table 37: Global Food Colorant Industry in South Africa Revenue Million Forecast, by Application 2019 & 2032
- Table 38: Global Food Colorant Industry in South Africa Revenue Million Forecast, by Country 2019 & 2032
- Table 39: Turkey Food Colorant Industry in South Africa Revenue (Million) Forecast, by Application 2019 & 2032
- Table 40: Israel Food Colorant Industry in South Africa Revenue (Million) Forecast, by Application 2019 & 2032
- Table 41: GCC Food Colorant Industry in South Africa Revenue (Million) Forecast, by Application 2019 & 2032
- Table 42: North Africa Food Colorant Industry in South Africa Revenue (Million) Forecast, by Application 2019 & 2032
- Table 43: South Africa Food Colorant Industry in South Africa Revenue (Million) Forecast, by Application 2019 & 2032
- Table 44: Rest of Middle East & Africa Food Colorant Industry in South Africa Revenue (Million) Forecast, by Application 2019 & 2032
- Table 45: Global Food Colorant Industry in South Africa Revenue Million Forecast, by Product Type 2019 & 2032
- Table 46: Global Food Colorant Industry in South Africa Revenue Million Forecast, by Application 2019 & 2032
- Table 47: Global Food Colorant Industry in South Africa Revenue Million Forecast, by Country 2019 & 2032
- Table 48: China Food Colorant Industry in South Africa Revenue (Million) Forecast, by Application 2019 & 2032
- Table 49: India Food Colorant Industry in South Africa Revenue (Million) Forecast, by Application 2019 & 2032
- Table 50: Japan Food Colorant Industry in South Africa Revenue (Million) Forecast, by Application 2019 & 2032
- Table 51: South Korea Food Colorant Industry in South Africa Revenue (Million) Forecast, by Application 2019 & 2032
- Table 52: ASEAN Food Colorant Industry in South Africa Revenue (Million) Forecast, by Application 2019 & 2032
- Table 53: Oceania Food Colorant Industry in South Africa Revenue (Million) Forecast, by Application 2019 & 2032
- Table 54: Rest of Asia Pacific Food Colorant Industry in South Africa Revenue (Million) Forecast, by Application 2019 & 2032
Frequently Asked Questions
1. What is the projected Compound Annual Growth Rate (CAGR) of the Food Colorant Industry in South Africa?
The projected CAGR is approximately 4.60%.
2. Which companies are prominent players in the Food Colorant Industry in South Africa?
Key companies in the market include Nicola J Flavors & Fragrances, Chemical Services Ltd (Lake Foods), Sensient Technologies, Chr Hansen holdings A/S, BASF SE, Quantum Colors S, EDCOL.
3. What are the main segments of the Food Colorant Industry in South Africa?
The market segments include Product Type, Application.
4. Can you provide details about the market size?
The market size is estimated to be USD XX Million as of 2022.
5. What are some drivers contributing to market growth?
Rising Health Consciousness among consumer.
6. What are the notable trends driving market growth?
Growing Emergence of Natural Color.
7. Are there any restraints impacting market growth?
High Cost of natural Ingredients.
8. Can you provide examples of recent developments in the market?
N/A
9. What pricing options are available for accessing the report?
Pricing options include single-user, multi-user, and enterprise licenses priced at USD 3800, USD 4500, and USD 5800 respectively.
10. Is the market size provided in terms of value or volume?
The market size is provided in terms of value, measured in Million.
11. Are there any specific market keywords associated with the report?
Yes, the market keyword associated with the report is "Food Colorant Industry in South Africa," which aids in identifying and referencing the specific market segment covered.
12. How do I determine which pricing option suits my needs best?
The pricing options vary based on user requirements and access needs. Individual users may opt for single-user licenses, while businesses requiring broader access may choose multi-user or enterprise licenses for cost-effective access to the report.
13. Are there any additional resources or data provided in the Food Colorant Industry in South Africa report?
While the report offers comprehensive insights, it's advisable to review the specific contents or supplementary materials provided to ascertain if additional resources or data are available.
14. How can I stay updated on further developments or reports in the Food Colorant Industry in South Africa?
To stay informed about further developments, trends, and reports in the Food Colorant Industry in South Africa, consider subscribing to industry newsletters, following relevant companies and organizations, or regularly checking reputable industry news sources and publications.
Methodology
Step 1 - Identification of Relevant Samples Size from Population Database


Step 2 - Approaches for Defining Global Market Size (Value, Volume* & Price*)

Note*: In applicable scenarios
Step 3 - Data Sources
Primary Research
- Web Analytics
- Survey Reports
- Research Institute
- Latest Research Reports
- Opinion Leaders
Secondary Research
- Annual Reports
- White Paper
- Latest Press Release
- Industry Association
- Paid Database
- Investor Presentations

Step 4 - Data Triangulation
Involves using different sources of information in order to increase the validity of a study
These sources are likely to be stakeholders in a program - participants, other researchers, program staff, other community members, and so on.
Then we put all data in single framework & apply various statistical tools to find out the dynamic on the market.
During the analysis stage, feedback from the stakeholder groups would be compared to determine areas of agreement as well as areas of divergence
