

Key Insights
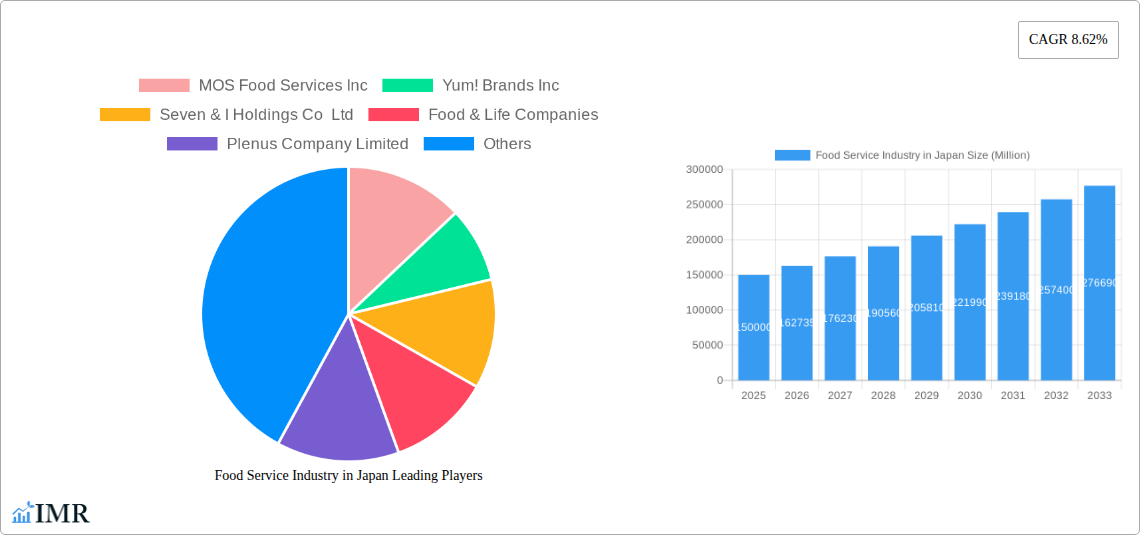
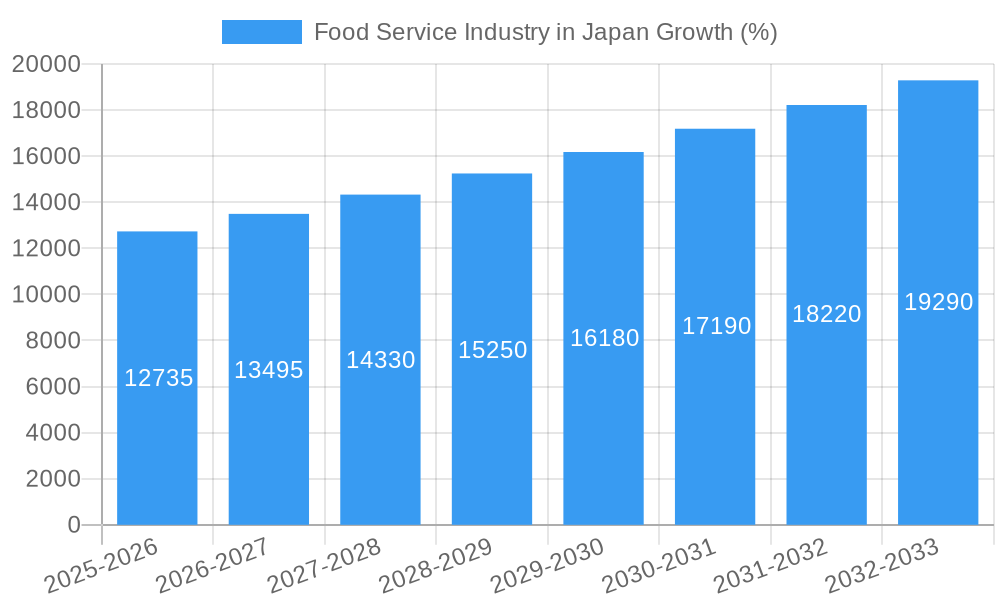
The Japanese food service industry, a dynamic and diverse sector, is experiencing robust growth, projected to maintain a healthy Compound Annual Growth Rate (CAGR) of 8.62% from 2025 to 2033. This expansion is fueled by several key factors. Rising disposable incomes and a burgeoning middle class are driving increased spending on dining out, particularly in urban centers like Tokyo, Osaka, and Nagoya. Changing lifestyles, with more individuals prioritizing convenience and less time spent on meal preparation, are bolstering demand for quick-service restaurants (QSRs) and cafes. Furthermore, the tourism sector's resurgence post-pandemic contributes significantly to the industry's growth, with international visitors contributing to the revenue of both established chains and independent eateries. The market is segmented by food service type (e.g., cafes, bars, other QSR cuisines), outlet type (chained vs. independent), and location (leisure, lodging, retail, standalone, travel), reflecting the industry's multifaceted nature. Competition is fierce, with established players like MOS Food Services, Yum! Brands, and McDonald's vying for market share alongside a multitude of smaller, independent operators. While growth is projected to be strong, potential restraints include increasing labor costs, fluctuating food prices, and evolving consumer preferences demanding greater health-consciousness and sustainability.
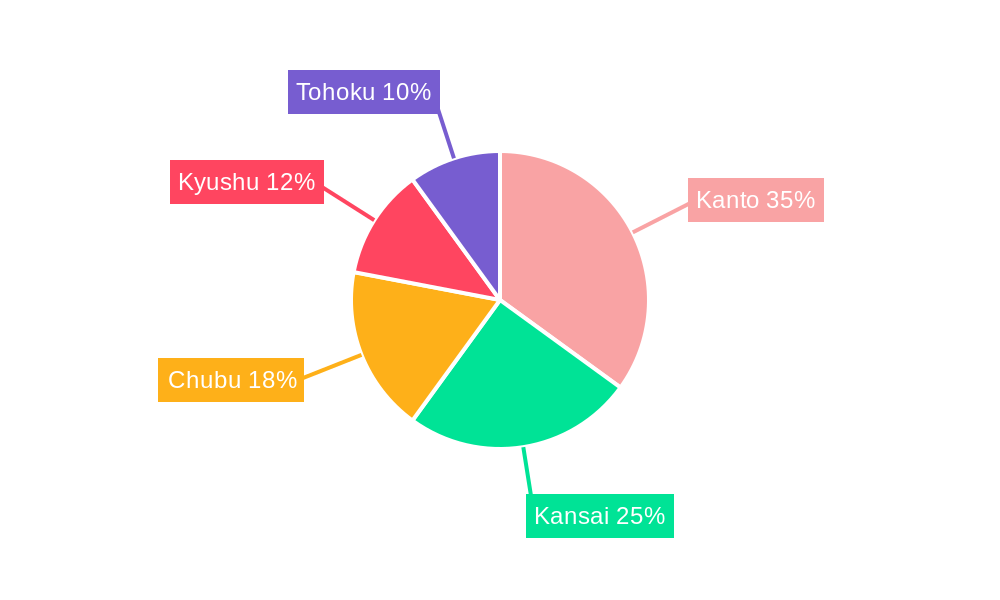
The regional breakdown reveals significant variations in growth rates within Japan. Areas like Kanto (including Tokyo) and Kansai (including Osaka) are expected to lead the market due to their higher population density and economic activity. However, substantial growth is also anticipated in other regions like Chubu and Kyushu, driven by infrastructure development and rising tourism. The success of food service businesses in Japan relies on adapting to consumer trends, offering value for money, and ensuring high-quality service and hygiene standards. Companies are increasingly leveraging technology to enhance customer experiences, improve operational efficiency, and expand their reach. The industry's future trajectory will depend on navigating challenges related to supply chain management, workforce development, and effectively catering to evolving consumer preferences in a dynamic and competitive landscape.
Food Service Industry in Japan: Market Report 2019-2033
This comprehensive report provides an in-depth analysis of Japan's dynamic food service industry, encompassing market size, growth trends, key players, and future opportunities. Covering the period 2019-2033, with a focus on 2025, this report is essential for industry professionals, investors, and anyone seeking a comprehensive understanding of this lucrative market. The study segments the market by foodservice type (Cafes & Bars, Other QSR Cuisines), outlet type (Chained Outlets, Independent Outlets), and location (Leisure, Lodging, Retail, Standalone, Travel), providing granular insights into the various market segments and their growth trajectories. Major players like McDonald's Corporation, Starbucks Corporation, and Seven & I Holdings Co Ltd are analyzed, alongside emerging competitors.
Study Period: 2019–2033 Base Year: 2025 Estimated Year: 2025 Forecast Period: 2025–2033 Historical Period: 2019–2024
Food Service Industry in Japan Market Dynamics & Structure
The Japanese food service industry is a highly competitive landscape characterized by a mix of established giants and nimble newcomers. Market concentration is moderate, with a few dominant players holding significant market share, while numerous smaller players cater to niche segments. Technological innovation, particularly in ordering systems, delivery services, and personalized offerings, is a key driver. Strict regulatory frameworks, particularly regarding food safety and hygiene, impact operations. The industry faces competition from home-cooked meals and meal delivery services. Demographics, with an aging population and changing consumer preferences, significantly influence demand. M&A activity is moderate, with larger players looking to expand their reach and portfolio.
- Market Concentration: Moderate, with the top 5 players holding approximately xx% of the market share in 2024.
- M&A Deal Volume (2019-2024): xx deals, primarily focused on expansion and diversification.
- Technological Innovation Drivers: Digital ordering, online delivery platforms, AI-powered recommendations.
- Regulatory Framework: Stringent food safety standards and labor regulations.
- Competitive Substitutes: Home-cooked meals, meal kit services, grocery stores.
- End-User Demographics: Aging population, rising single-person households, increasing demand for convenience.
Food Service Industry in Japan Growth Trends & Insights
The Japanese food service market exhibits a steady growth trajectory, driven by urbanization, changing lifestyles, and increasing disposable incomes. The market size experienced fluctuations during the historical period (2019-2024), impacted by economic shifts and the COVID-19 pandemic. However, a recovery and subsequent growth are projected. Adoption of digital technologies, such as online ordering and delivery, is accelerating. Consumer behavior is shifting towards more convenient and personalized experiences, influencing the types of offerings and service models gaining popularity.
- Market Size (2024): xx Million Units
- Projected Market Size (2033): xx Million Units
- CAGR (2025-2033): xx%
- Market Penetration of Online Ordering (2024): xx%
- Key Trends: Increasing demand for healthy and sustainable options, growing popularity of delivery services, rising preference for customized meals.
Dominant Regions, Countries, or Segments in Food Service Industry in Japan
The Kanto region (including Tokyo) remains the dominant market, due to its large population and high concentration of businesses. Chained outlets dominate the market in terms of revenue and presence, showcasing the importance of scale and brand recognition. Within foodservice types, QSR (Quick Service Restaurants) generally outperform cafes and bars in overall market share, reflecting consumer preferences for speed and convenience. Standalone locations are most prevalent, followed by retail locations. Growth is projected to be stronger in areas with expanding populations and improving infrastructure.
- Dominant Region: Kanto Region
- Leading Segment (Foodservice Type): Other QSR Cuisines
- Leading Segment (Outlet Type): Chained Outlets
- Leading Segment (Location): Standalone
- Key Growth Drivers: Urbanization, tourism, increasing disposable income, infrastructure development in regional areas.
Food Service Industry in Japan Product Landscape
Product innovation is centered around convenience, health, and personalization. Many establishments offer customizable options, catering to individual dietary preferences and restrictions. Technological advancements, such as automated ordering kiosks and mobile payment systems, are streamlining operations. Unique selling propositions often revolve around locally sourced ingredients, unique recipes, or innovative service models.
Key Drivers, Barriers & Challenges in Food Service Industry in Japan
Key Drivers: Rising disposable incomes, increasing urbanization, changing consumer preferences towards convenience and healthy food, government initiatives promoting tourism.
Key Challenges: Intense competition, rising labor costs, stringent regulations, supply chain disruptions, fluctuating raw material prices (impact on profit margins: xx% in 2024).
Emerging Opportunities in Food Service Industry in Japan
The growing demand for healthy and sustainable food options presents a significant opportunity. The rise of plant-based diets and the focus on reducing food waste are influencing menu development. Furthermore, there is increasing potential in catering to tourists with diverse culinary preferences. The development of specialized services such as meal delivery for specific dietary needs also holds potential.
Growth Accelerators in the Food Service Industry in Japan Industry
Technological advancements in food preparation, delivery, and customer service will continue to drive growth. Strategic partnerships between food service companies and technology providers will enhance efficiency and customer experience. Expansion into new regions and the development of innovative business models will further accelerate market expansion.
Key Players Shaping the Food Service Industry in Japan Market
- MOS Food Services Inc
- Yum! Brands Inc
- Seven & I Holdings Co Ltd
- Food & Life Companies
- Plenus Company Limited
- Kura Sushi Inc
- Toridoll Holdings Corporation
- Skylark Holdings Co Ltd
- Lotteria Co Ltd
- Komeda Holdings Co Ltd
- Domino’s Pizza Enterprises Ltd
- Starbucks Corporation
- Colowide Co Ltd
- Yoshinoya Holdings Co Ltd
- McDonald's Corporation
- Zensho Holding
Notable Milestones in Food Service Industry in Japan Sector
- April 2023: McDonald's Corporation partnered with One Piece, launching a themed Chicken Tatsuta Burger.
- April 2023: KFC launched a range of hash brown burgers nationwide.
- April 2023: Starbucks introduced the Oleato™ coffee drink.
In-Depth Food Service Industry in Japan Market Outlook
The Japanese food service industry is poised for continued growth, driven by technological innovation, changing consumer preferences, and strategic partnerships. Opportunities exist in expanding into underserved markets, developing personalized offerings, and leveraging technology to enhance operational efficiency and customer experience. The market's future potential is significant, offering substantial returns for businesses that can adapt to evolving consumer demands and embrace technological advancements.
Food Service Industry in Japan Segmentation
-
1. Foodservice Type
-
1.1. Cafes & Bars
-
1.1.1. By Cuisine
- 1.1.1.1. Bars & Pubs
- 1.1.1.2. Juice/Smoothie/Desserts Bars
- 1.1.1.3. Specialist Coffee & Tea Shops
-
1.1.1. By Cuisine
- 1.2. Cloud Kitchen
-
1.3. Full Service Restaurants
- 1.3.1. Asian
- 1.3.2. European
- 1.3.3. Latin American
- 1.3.4. Middle Eastern
- 1.3.5. North American
- 1.3.6. Other FSR Cuisines
-
1.4. Quick Service Restaurants
- 1.4.1. Bakeries
- 1.4.2. Burger
- 1.4.3. Ice Cream
- 1.4.4. Meat-based Cuisines
- 1.4.5. Pizza
- 1.4.6. Other QSR Cuisines
-
1.1. Cafes & Bars
-
2. Outlet
- 2.1. Chained Outlets
- 2.2. Independent Outlets
-
3. Location
- 3.1. Leisure
- 3.2. Lodging
- 3.3. Retail
- 3.4. Standalone
- 3.5. Travel
Food Service Industry in Japan Segmentation By Geography
-
1. North America
- 1.1. United States
- 1.2. Canada
- 1.3. Mexico
-
2. South America
- 2.1. Brazil
- 2.2. Argentina
- 2.3. Rest of South America
-
3. Europe
- 3.1. United Kingdom
- 3.2. Germany
- 3.3. France
- 3.4. Italy
- 3.5. Spain
- 3.6. Russia
- 3.7. Benelux
- 3.8. Nordics
- 3.9. Rest of Europe
-
4. Middle East & Africa
- 4.1. Turkey
- 4.2. Israel
- 4.3. GCC
- 4.4. North Africa
- 4.5. South Africa
- 4.6. Rest of Middle East & Africa
-
5. Asia Pacific
- 5.1. China
- 5.2. India
- 5.3. Japan
- 5.4. South Korea
- 5.5. ASEAN
- 5.6. Oceania
- 5.7. Rest of Asia Pacific
Food Service Industry in Japan REPORT HIGHLIGHTS
| Aspects | Details |
|---|---|
| Study Period | 2019-2033 |
| Base Year | 2024 |
| Estimated Year | 2025 |
| Forecast Period | 2025-2033 |
| Historical Period | 2019-2024 |
| Growth Rate | CAGR of 8.62% from 2019-2033 |
| Segmentation |
|
Table of Contents
- 1. Introduction
- 1.1. Research Scope
- 1.2. Market Segmentation
- 1.3. Research Methodology
- 1.4. Definitions and Assumptions
- 2. Executive Summary
- 2.1. Introduction
- 3. Market Dynamics
- 3.1. Introduction
- 3.2. Market Drivers
- 3.2.1. Rising Health Consciousness among consumer
- 3.3. Market Restrains
- 3.3.1. High Cost of natural Ingredients
- 3.4. Market Trends
- 3.4.1. Quick service restaurants held the major share in the market due to the constant launch of new products
- 4. Market Factor Analysis
- 4.1. Porters Five Forces
- 4.2. Supply/Value Chain
- 4.3. PESTEL analysis
- 4.4. Market Entropy
- 4.5. Patent/Trademark Analysis
- 5. Global Food Service Industry in Japan Analysis, Insights and Forecast, 2019-2031
- 5.1. Market Analysis, Insights and Forecast - by Foodservice Type
- 5.1.1. Cafes & Bars
- 5.1.1.1. By Cuisine
- 5.1.1.1.1. Bars & Pubs
- 5.1.1.1.2. Juice/Smoothie/Desserts Bars
- 5.1.1.1.3. Specialist Coffee & Tea Shops
- 5.1.1.1. By Cuisine
- 5.1.2. Cloud Kitchen
- 5.1.3. Full Service Restaurants
- 5.1.3.1. Asian
- 5.1.3.2. European
- 5.1.3.3. Latin American
- 5.1.3.4. Middle Eastern
- 5.1.3.5. North American
- 5.1.3.6. Other FSR Cuisines
- 5.1.4. Quick Service Restaurants
- 5.1.4.1. Bakeries
- 5.1.4.2. Burger
- 5.1.4.3. Ice Cream
- 5.1.4.4. Meat-based Cuisines
- 5.1.4.5. Pizza
- 5.1.4.6. Other QSR Cuisines
- 5.1.1. Cafes & Bars
- 5.2. Market Analysis, Insights and Forecast - by Outlet
- 5.2.1. Chained Outlets
- 5.2.2. Independent Outlets
- 5.3. Market Analysis, Insights and Forecast - by Location
- 5.3.1. Leisure
- 5.3.2. Lodging
- 5.3.3. Retail
- 5.3.4. Standalone
- 5.3.5. Travel
- 5.4. Market Analysis, Insights and Forecast - by Region
- 5.4.1. North America
- 5.4.2. South America
- 5.4.3. Europe
- 5.4.4. Middle East & Africa
- 5.4.5. Asia Pacific
- 5.1. Market Analysis, Insights and Forecast - by Foodservice Type
- 6. North America Food Service Industry in Japan Analysis, Insights and Forecast, 2019-2031
- 6.1. Market Analysis, Insights and Forecast - by Foodservice Type
- 6.1.1. Cafes & Bars
- 6.1.1.1. By Cuisine
- 6.1.1.1.1. Bars & Pubs
- 6.1.1.1.2. Juice/Smoothie/Desserts Bars
- 6.1.1.1.3. Specialist Coffee & Tea Shops
- 6.1.1.1. By Cuisine
- 6.1.2. Cloud Kitchen
- 6.1.3. Full Service Restaurants
- 6.1.3.1. Asian
- 6.1.3.2. European
- 6.1.3.3. Latin American
- 6.1.3.4. Middle Eastern
- 6.1.3.5. North American
- 6.1.3.6. Other FSR Cuisines
- 6.1.4. Quick Service Restaurants
- 6.1.4.1. Bakeries
- 6.1.4.2. Burger
- 6.1.4.3. Ice Cream
- 6.1.4.4. Meat-based Cuisines
- 6.1.4.5. Pizza
- 6.1.4.6. Other QSR Cuisines
- 6.1.1. Cafes & Bars
- 6.2. Market Analysis, Insights and Forecast - by Outlet
- 6.2.1. Chained Outlets
- 6.2.2. Independent Outlets
- 6.3. Market Analysis, Insights and Forecast - by Location
- 6.3.1. Leisure
- 6.3.2. Lodging
- 6.3.3. Retail
- 6.3.4. Standalone
- 6.3.5. Travel
- 6.1. Market Analysis, Insights and Forecast - by Foodservice Type
- 7. South America Food Service Industry in Japan Analysis, Insights and Forecast, 2019-2031
- 7.1. Market Analysis, Insights and Forecast - by Foodservice Type
- 7.1.1. Cafes & Bars
- 7.1.1.1. By Cuisine
- 7.1.1.1.1. Bars & Pubs
- 7.1.1.1.2. Juice/Smoothie/Desserts Bars
- 7.1.1.1.3. Specialist Coffee & Tea Shops
- 7.1.1.1. By Cuisine
- 7.1.2. Cloud Kitchen
- 7.1.3. Full Service Restaurants
- 7.1.3.1. Asian
- 7.1.3.2. European
- 7.1.3.3. Latin American
- 7.1.3.4. Middle Eastern
- 7.1.3.5. North American
- 7.1.3.6. Other FSR Cuisines
- 7.1.4. Quick Service Restaurants
- 7.1.4.1. Bakeries
- 7.1.4.2. Burger
- 7.1.4.3. Ice Cream
- 7.1.4.4. Meat-based Cuisines
- 7.1.4.5. Pizza
- 7.1.4.6. Other QSR Cuisines
- 7.1.1. Cafes & Bars
- 7.2. Market Analysis, Insights and Forecast - by Outlet
- 7.2.1. Chained Outlets
- 7.2.2. Independent Outlets
- 7.3. Market Analysis, Insights and Forecast - by Location
- 7.3.1. Leisure
- 7.3.2. Lodging
- 7.3.3. Retail
- 7.3.4. Standalone
- 7.3.5. Travel
- 7.1. Market Analysis, Insights and Forecast - by Foodservice Type
- 8. Europe Food Service Industry in Japan Analysis, Insights and Forecast, 2019-2031
- 8.1. Market Analysis, Insights and Forecast - by Foodservice Type
- 8.1.1. Cafes & Bars
- 8.1.1.1. By Cuisine
- 8.1.1.1.1. Bars & Pubs
- 8.1.1.1.2. Juice/Smoothie/Desserts Bars
- 8.1.1.1.3. Specialist Coffee & Tea Shops
- 8.1.1.1. By Cuisine
- 8.1.2. Cloud Kitchen
- 8.1.3. Full Service Restaurants
- 8.1.3.1. Asian
- 8.1.3.2. European
- 8.1.3.3. Latin American
- 8.1.3.4. Middle Eastern
- 8.1.3.5. North American
- 8.1.3.6. Other FSR Cuisines
- 8.1.4. Quick Service Restaurants
- 8.1.4.1. Bakeries
- 8.1.4.2. Burger
- 8.1.4.3. Ice Cream
- 8.1.4.4. Meat-based Cuisines
- 8.1.4.5. Pizza
- 8.1.4.6. Other QSR Cuisines
- 8.1.1. Cafes & Bars
- 8.2. Market Analysis, Insights and Forecast - by Outlet
- 8.2.1. Chained Outlets
- 8.2.2. Independent Outlets
- 8.3. Market Analysis, Insights and Forecast - by Location
- 8.3.1. Leisure
- 8.3.2. Lodging
- 8.3.3. Retail
- 8.3.4. Standalone
- 8.3.5. Travel
- 8.1. Market Analysis, Insights and Forecast - by Foodservice Type
- 9. Middle East & Africa Food Service Industry in Japan Analysis, Insights and Forecast, 2019-2031
- 9.1. Market Analysis, Insights and Forecast - by Foodservice Type
- 9.1.1. Cafes & Bars
- 9.1.1.1. By Cuisine
- 9.1.1.1.1. Bars & Pubs
- 9.1.1.1.2. Juice/Smoothie/Desserts Bars
- 9.1.1.1.3. Specialist Coffee & Tea Shops
- 9.1.1.1. By Cuisine
- 9.1.2. Cloud Kitchen
- 9.1.3. Full Service Restaurants
- 9.1.3.1. Asian
- 9.1.3.2. European
- 9.1.3.3. Latin American
- 9.1.3.4. Middle Eastern
- 9.1.3.5. North American
- 9.1.3.6. Other FSR Cuisines
- 9.1.4. Quick Service Restaurants
- 9.1.4.1. Bakeries
- 9.1.4.2. Burger
- 9.1.4.3. Ice Cream
- 9.1.4.4. Meat-based Cuisines
- 9.1.4.5. Pizza
- 9.1.4.6. Other QSR Cuisines
- 9.1.1. Cafes & Bars
- 9.2. Market Analysis, Insights and Forecast - by Outlet
- 9.2.1. Chained Outlets
- 9.2.2. Independent Outlets
- 9.3. Market Analysis, Insights and Forecast - by Location
- 9.3.1. Leisure
- 9.3.2. Lodging
- 9.3.3. Retail
- 9.3.4. Standalone
- 9.3.5. Travel
- 9.1. Market Analysis, Insights and Forecast - by Foodservice Type
- 10. Asia Pacific Food Service Industry in Japan Analysis, Insights and Forecast, 2019-2031
- 10.1. Market Analysis, Insights and Forecast - by Foodservice Type
- 10.1.1. Cafes & Bars
- 10.1.1.1. By Cuisine
- 10.1.1.1.1. Bars & Pubs
- 10.1.1.1.2. Juice/Smoothie/Desserts Bars
- 10.1.1.1.3. Specialist Coffee & Tea Shops
- 10.1.1.1. By Cuisine
- 10.1.2. Cloud Kitchen
- 10.1.3. Full Service Restaurants
- 10.1.3.1. Asian
- 10.1.3.2. European
- 10.1.3.3. Latin American
- 10.1.3.4. Middle Eastern
- 10.1.3.5. North American
- 10.1.3.6. Other FSR Cuisines
- 10.1.4. Quick Service Restaurants
- 10.1.4.1. Bakeries
- 10.1.4.2. Burger
- 10.1.4.3. Ice Cream
- 10.1.4.4. Meat-based Cuisines
- 10.1.4.5. Pizza
- 10.1.4.6. Other QSR Cuisines
- 10.1.1. Cafes & Bars
- 10.2. Market Analysis, Insights and Forecast - by Outlet
- 10.2.1. Chained Outlets
- 10.2.2. Independent Outlets
- 10.3. Market Analysis, Insights and Forecast - by Location
- 10.3.1. Leisure
- 10.3.2. Lodging
- 10.3.3. Retail
- 10.3.4. Standalone
- 10.3.5. Travel
- 10.1. Market Analysis, Insights and Forecast - by Foodservice Type
- 11. Kanto Food Service Industry in Japan Analysis, Insights and Forecast, 2019-2031
- 12. Kansai Food Service Industry in Japan Analysis, Insights and Forecast, 2019-2031
- 13. Chubu Food Service Industry in Japan Analysis, Insights and Forecast, 2019-2031
- 14. Kyushu Food Service Industry in Japan Analysis, Insights and Forecast, 2019-2031
- 15. Tohoku Food Service Industry in Japan Analysis, Insights and Forecast, 2019-2031
- 16. Competitive Analysis
- 16.1. Global Market Share Analysis 2024
- 16.2. Company Profiles
- 16.2.1 MOS Food Services Inc
- 16.2.1.1. Overview
- 16.2.1.2. Products
- 16.2.1.3. SWOT Analysis
- 16.2.1.4. Recent Developments
- 16.2.1.5. Financials (Based on Availability)
- 16.2.2 Yum! Brands Inc
- 16.2.2.1. Overview
- 16.2.2.2. Products
- 16.2.2.3. SWOT Analysis
- 16.2.2.4. Recent Developments
- 16.2.2.5. Financials (Based on Availability)
- 16.2.3 Seven & I Holdings Co Ltd
- 16.2.3.1. Overview
- 16.2.3.2. Products
- 16.2.3.3. SWOT Analysis
- 16.2.3.4. Recent Developments
- 16.2.3.5. Financials (Based on Availability)
- 16.2.4 Food & Life Companies
- 16.2.4.1. Overview
- 16.2.4.2. Products
- 16.2.4.3. SWOT Analysis
- 16.2.4.4. Recent Developments
- 16.2.4.5. Financials (Based on Availability)
- 16.2.5 Plenus Company Limited
- 16.2.5.1. Overview
- 16.2.5.2. Products
- 16.2.5.3. SWOT Analysis
- 16.2.5.4. Recent Developments
- 16.2.5.5. Financials (Based on Availability)
- 16.2.6 Kura Sushi Inc
- 16.2.6.1. Overview
- 16.2.6.2. Products
- 16.2.6.3. SWOT Analysis
- 16.2.6.4. Recent Developments
- 16.2.6.5. Financials (Based on Availability)
- 16.2.7 Toridoll Holdings Corporation
- 16.2.7.1. Overview
- 16.2.7.2. Products
- 16.2.7.3. SWOT Analysis
- 16.2.7.4. Recent Developments
- 16.2.7.5. Financials (Based on Availability)
- 16.2.8 Skylark Holdings Co Ltd
- 16.2.8.1. Overview
- 16.2.8.2. Products
- 16.2.8.3. SWOT Analysis
- 16.2.8.4. Recent Developments
- 16.2.8.5. Financials (Based on Availability)
- 16.2.9 Lotteria Co Ltd
- 16.2.9.1. Overview
- 16.2.9.2. Products
- 16.2.9.3. SWOT Analysis
- 16.2.9.4. Recent Developments
- 16.2.9.5. Financials (Based on Availability)
- 16.2.10 Komeda Holdings Co Ltd
- 16.2.10.1. Overview
- 16.2.10.2. Products
- 16.2.10.3. SWOT Analysis
- 16.2.10.4. Recent Developments
- 16.2.10.5. Financials (Based on Availability)
- 16.2.11 Domino’s Pizza Enterprises Ltd
- 16.2.11.1. Overview
- 16.2.11.2. Products
- 16.2.11.3. SWOT Analysis
- 16.2.11.4. Recent Developments
- 16.2.11.5. Financials (Based on Availability)
- 16.2.12 Starbucks Corporation
- 16.2.12.1. Overview
- 16.2.12.2. Products
- 16.2.12.3. SWOT Analysis
- 16.2.12.4. Recent Developments
- 16.2.12.5. Financials (Based on Availability)
- 16.2.13 Colowide Co Ltd
- 16.2.13.1. Overview
- 16.2.13.2. Products
- 16.2.13.3. SWOT Analysis
- 16.2.13.4. Recent Developments
- 16.2.13.5. Financials (Based on Availability)
- 16.2.14 Yoshinoya Holdings Co Ltd
- 16.2.14.1. Overview
- 16.2.14.2. Products
- 16.2.14.3. SWOT Analysis
- 16.2.14.4. Recent Developments
- 16.2.14.5. Financials (Based on Availability)
- 16.2.15 McDonald's Corporation
- 16.2.15.1. Overview
- 16.2.15.2. Products
- 16.2.15.3. SWOT Analysis
- 16.2.15.4. Recent Developments
- 16.2.15.5. Financials (Based on Availability)
- 16.2.16 Zensho Holding
- 16.2.16.1. Overview
- 16.2.16.2. Products
- 16.2.16.3. SWOT Analysis
- 16.2.16.4. Recent Developments
- 16.2.16.5. Financials (Based on Availability)
- 16.2.1 MOS Food Services Inc
List of Figures
- Figure 1: Global Food Service Industry in Japan Revenue Breakdown (Million, %) by Region 2024 & 2032
- Figure 2: Japan Food Service Industry in Japan Revenue (Million), by Country 2024 & 2032
- Figure 3: Japan Food Service Industry in Japan Revenue Share (%), by Country 2024 & 2032
- Figure 4: North America Food Service Industry in Japan Revenue (Million), by Foodservice Type 2024 & 2032
- Figure 5: North America Food Service Industry in Japan Revenue Share (%), by Foodservice Type 2024 & 2032
- Figure 6: North America Food Service Industry in Japan Revenue (Million), by Outlet 2024 & 2032
- Figure 7: North America Food Service Industry in Japan Revenue Share (%), by Outlet 2024 & 2032
- Figure 8: North America Food Service Industry in Japan Revenue (Million), by Location 2024 & 2032
- Figure 9: North America Food Service Industry in Japan Revenue Share (%), by Location 2024 & 2032
- Figure 10: North America Food Service Industry in Japan Revenue (Million), by Country 2024 & 2032
- Figure 11: North America Food Service Industry in Japan Revenue Share (%), by Country 2024 & 2032
- Figure 12: South America Food Service Industry in Japan Revenue (Million), by Foodservice Type 2024 & 2032
- Figure 13: South America Food Service Industry in Japan Revenue Share (%), by Foodservice Type 2024 & 2032
- Figure 14: South America Food Service Industry in Japan Revenue (Million), by Outlet 2024 & 2032
- Figure 15: South America Food Service Industry in Japan Revenue Share (%), by Outlet 2024 & 2032
- Figure 16: South America Food Service Industry in Japan Revenue (Million), by Location 2024 & 2032
- Figure 17: South America Food Service Industry in Japan Revenue Share (%), by Location 2024 & 2032
- Figure 18: South America Food Service Industry in Japan Revenue (Million), by Country 2024 & 2032
- Figure 19: South America Food Service Industry in Japan Revenue Share (%), by Country 2024 & 2032
- Figure 20: Europe Food Service Industry in Japan Revenue (Million), by Foodservice Type 2024 & 2032
- Figure 21: Europe Food Service Industry in Japan Revenue Share (%), by Foodservice Type 2024 & 2032
- Figure 22: Europe Food Service Industry in Japan Revenue (Million), by Outlet 2024 & 2032
- Figure 23: Europe Food Service Industry in Japan Revenue Share (%), by Outlet 2024 & 2032
- Figure 24: Europe Food Service Industry in Japan Revenue (Million), by Location 2024 & 2032
- Figure 25: Europe Food Service Industry in Japan Revenue Share (%), by Location 2024 & 2032
- Figure 26: Europe Food Service Industry in Japan Revenue (Million), by Country 2024 & 2032
- Figure 27: Europe Food Service Industry in Japan Revenue Share (%), by Country 2024 & 2032
- Figure 28: Middle East & Africa Food Service Industry in Japan Revenue (Million), by Foodservice Type 2024 & 2032
- Figure 29: Middle East & Africa Food Service Industry in Japan Revenue Share (%), by Foodservice Type 2024 & 2032
- Figure 30: Middle East & Africa Food Service Industry in Japan Revenue (Million), by Outlet 2024 & 2032
- Figure 31: Middle East & Africa Food Service Industry in Japan Revenue Share (%), by Outlet 2024 & 2032
- Figure 32: Middle East & Africa Food Service Industry in Japan Revenue (Million), by Location 2024 & 2032
- Figure 33: Middle East & Africa Food Service Industry in Japan Revenue Share (%), by Location 2024 & 2032
- Figure 34: Middle East & Africa Food Service Industry in Japan Revenue (Million), by Country 2024 & 2032
- Figure 35: Middle East & Africa Food Service Industry in Japan Revenue Share (%), by Country 2024 & 2032
- Figure 36: Asia Pacific Food Service Industry in Japan Revenue (Million), by Foodservice Type 2024 & 2032
- Figure 37: Asia Pacific Food Service Industry in Japan Revenue Share (%), by Foodservice Type 2024 & 2032
- Figure 38: Asia Pacific Food Service Industry in Japan Revenue (Million), by Outlet 2024 & 2032
- Figure 39: Asia Pacific Food Service Industry in Japan Revenue Share (%), by Outlet 2024 & 2032
- Figure 40: Asia Pacific Food Service Industry in Japan Revenue (Million), by Location 2024 & 2032
- Figure 41: Asia Pacific Food Service Industry in Japan Revenue Share (%), by Location 2024 & 2032
- Figure 42: Asia Pacific Food Service Industry in Japan Revenue (Million), by Country 2024 & 2032
- Figure 43: Asia Pacific Food Service Industry in Japan Revenue Share (%), by Country 2024 & 2032
List of Tables
- Table 1: Global Food Service Industry in Japan Revenue Million Forecast, by Region 2019 & 2032
- Table 2: Global Food Service Industry in Japan Revenue Million Forecast, by Foodservice Type 2019 & 2032
- Table 3: Global Food Service Industry in Japan Revenue Million Forecast, by Outlet 2019 & 2032
- Table 4: Global Food Service Industry in Japan Revenue Million Forecast, by Location 2019 & 2032
- Table 5: Global Food Service Industry in Japan Revenue Million Forecast, by Region 2019 & 2032
- Table 6: Global Food Service Industry in Japan Revenue Million Forecast, by Country 2019 & 2032
- Table 7: Kanto Food Service Industry in Japan Revenue (Million) Forecast, by Application 2019 & 2032
- Table 8: Kansai Food Service Industry in Japan Revenue (Million) Forecast, by Application 2019 & 2032
- Table 9: Chubu Food Service Industry in Japan Revenue (Million) Forecast, by Application 2019 & 2032
- Table 10: Kyushu Food Service Industry in Japan Revenue (Million) Forecast, by Application 2019 & 2032
- Table 11: Tohoku Food Service Industry in Japan Revenue (Million) Forecast, by Application 2019 & 2032
- Table 12: Global Food Service Industry in Japan Revenue Million Forecast, by Foodservice Type 2019 & 2032
- Table 13: Global Food Service Industry in Japan Revenue Million Forecast, by Outlet 2019 & 2032
- Table 14: Global Food Service Industry in Japan Revenue Million Forecast, by Location 2019 & 2032
- Table 15: Global Food Service Industry in Japan Revenue Million Forecast, by Country 2019 & 2032
- Table 16: United States Food Service Industry in Japan Revenue (Million) Forecast, by Application 2019 & 2032
- Table 17: Canada Food Service Industry in Japan Revenue (Million) Forecast, by Application 2019 & 2032
- Table 18: Mexico Food Service Industry in Japan Revenue (Million) Forecast, by Application 2019 & 2032
- Table 19: Global Food Service Industry in Japan Revenue Million Forecast, by Foodservice Type 2019 & 2032
- Table 20: Global Food Service Industry in Japan Revenue Million Forecast, by Outlet 2019 & 2032
- Table 21: Global Food Service Industry in Japan Revenue Million Forecast, by Location 2019 & 2032
- Table 22: Global Food Service Industry in Japan Revenue Million Forecast, by Country 2019 & 2032
- Table 23: Brazil Food Service Industry in Japan Revenue (Million) Forecast, by Application 2019 & 2032
- Table 24: Argentina Food Service Industry in Japan Revenue (Million) Forecast, by Application 2019 & 2032
- Table 25: Rest of South America Food Service Industry in Japan Revenue (Million) Forecast, by Application 2019 & 2032
- Table 26: Global Food Service Industry in Japan Revenue Million Forecast, by Foodservice Type 2019 & 2032
- Table 27: Global Food Service Industry in Japan Revenue Million Forecast, by Outlet 2019 & 2032
- Table 28: Global Food Service Industry in Japan Revenue Million Forecast, by Location 2019 & 2032
- Table 29: Global Food Service Industry in Japan Revenue Million Forecast, by Country 2019 & 2032
- Table 30: United Kingdom Food Service Industry in Japan Revenue (Million) Forecast, by Application 2019 & 2032
- Table 31: Germany Food Service Industry in Japan Revenue (Million) Forecast, by Application 2019 & 2032
- Table 32: France Food Service Industry in Japan Revenue (Million) Forecast, by Application 2019 & 2032
- Table 33: Italy Food Service Industry in Japan Revenue (Million) Forecast, by Application 2019 & 2032
- Table 34: Spain Food Service Industry in Japan Revenue (Million) Forecast, by Application 2019 & 2032
- Table 35: Russia Food Service Industry in Japan Revenue (Million) Forecast, by Application 2019 & 2032
- Table 36: Benelux Food Service Industry in Japan Revenue (Million) Forecast, by Application 2019 & 2032
- Table 37: Nordics Food Service Industry in Japan Revenue (Million) Forecast, by Application 2019 & 2032
- Table 38: Rest of Europe Food Service Industry in Japan Revenue (Million) Forecast, by Application 2019 & 2032
- Table 39: Global Food Service Industry in Japan Revenue Million Forecast, by Foodservice Type 2019 & 2032
- Table 40: Global Food Service Industry in Japan Revenue Million Forecast, by Outlet 2019 & 2032
- Table 41: Global Food Service Industry in Japan Revenue Million Forecast, by Location 2019 & 2032
- Table 42: Global Food Service Industry in Japan Revenue Million Forecast, by Country 2019 & 2032
- Table 43: Turkey Food Service Industry in Japan Revenue (Million) Forecast, by Application 2019 & 2032
- Table 44: Israel Food Service Industry in Japan Revenue (Million) Forecast, by Application 2019 & 2032
- Table 45: GCC Food Service Industry in Japan Revenue (Million) Forecast, by Application 2019 & 2032
- Table 46: North Africa Food Service Industry in Japan Revenue (Million) Forecast, by Application 2019 & 2032
- Table 47: South Africa Food Service Industry in Japan Revenue (Million) Forecast, by Application 2019 & 2032
- Table 48: Rest of Middle East & Africa Food Service Industry in Japan Revenue (Million) Forecast, by Application 2019 & 2032
- Table 49: Global Food Service Industry in Japan Revenue Million Forecast, by Foodservice Type 2019 & 2032
- Table 50: Global Food Service Industry in Japan Revenue Million Forecast, by Outlet 2019 & 2032
- Table 51: Global Food Service Industry in Japan Revenue Million Forecast, by Location 2019 & 2032
- Table 52: Global Food Service Industry in Japan Revenue Million Forecast, by Country 2019 & 2032
- Table 53: China Food Service Industry in Japan Revenue (Million) Forecast, by Application 2019 & 2032
- Table 54: India Food Service Industry in Japan Revenue (Million) Forecast, by Application 2019 & 2032
- Table 55: Japan Food Service Industry in Japan Revenue (Million) Forecast, by Application 2019 & 2032
- Table 56: South Korea Food Service Industry in Japan Revenue (Million) Forecast, by Application 2019 & 2032
- Table 57: ASEAN Food Service Industry in Japan Revenue (Million) Forecast, by Application 2019 & 2032
- Table 58: Oceania Food Service Industry in Japan Revenue (Million) Forecast, by Application 2019 & 2032
- Table 59: Rest of Asia Pacific Food Service Industry in Japan Revenue (Million) Forecast, by Application 2019 & 2032
Frequently Asked Questions
1. What is the projected Compound Annual Growth Rate (CAGR) of the Food Service Industry in Japan?
The projected CAGR is approximately 8.62%.
2. Which companies are prominent players in the Food Service Industry in Japan?
Key companies in the market include MOS Food Services Inc, Yum! Brands Inc, Seven & I Holdings Co Ltd, Food & Life Companies, Plenus Company Limited, Kura Sushi Inc, Toridoll Holdings Corporation, Skylark Holdings Co Ltd, Lotteria Co Ltd, Komeda Holdings Co Ltd, Domino’s Pizza Enterprises Ltd, Starbucks Corporation, Colowide Co Ltd, Yoshinoya Holdings Co Ltd, McDonald's Corporation, Zensho Holding.
3. What are the main segments of the Food Service Industry in Japan?
The market segments include Foodservice Type, Outlet, Location.
4. Can you provide details about the market size?
The market size is estimated to be USD XX Million as of 2022.
5. What are some drivers contributing to market growth?
Rising Health Consciousness among consumer.
6. What are the notable trends driving market growth?
Quick service restaurants held the major share in the market due to the constant launch of new products.
7. Are there any restraints impacting market growth?
High Cost of natural Ingredients.
8. Can you provide examples of recent developments in the market?
April 2023: McDonald's Corporation partnered with One Piece, a Japanese anime franchise, to launch a newer version of the burger, i.e., the Chicken Tatsuta Burger. The packaging has been themed with One Piece imagery.April 2023: KFC launched a range of hash brown burgers available nationwide, including Karihoku Hash Filet Burger, Karihoku Hash Filet BBQ Burger, and Karihoku Hash Filet Spicy Burger.April 2023: In Japan, Starbucks introduced a new type of coffee drink called Oleato™, consisting of arabica coffee and Partanna® extra virgin olive oil.
9. What pricing options are available for accessing the report?
Pricing options include single-user, multi-user, and enterprise licenses priced at USD 3800, USD 4500, and USD 5800 respectively.
10. Is the market size provided in terms of value or volume?
The market size is provided in terms of value, measured in Million.
11. Are there any specific market keywords associated with the report?
Yes, the market keyword associated with the report is "Food Service Industry in Japan," which aids in identifying and referencing the specific market segment covered.
12. How do I determine which pricing option suits my needs best?
The pricing options vary based on user requirements and access needs. Individual users may opt for single-user licenses, while businesses requiring broader access may choose multi-user or enterprise licenses for cost-effective access to the report.
13. Are there any additional resources or data provided in the Food Service Industry in Japan report?
While the report offers comprehensive insights, it's advisable to review the specific contents or supplementary materials provided to ascertain if additional resources or data are available.
14. How can I stay updated on further developments or reports in the Food Service Industry in Japan?
To stay informed about further developments, trends, and reports in the Food Service Industry in Japan, consider subscribing to industry newsletters, following relevant companies and organizations, or regularly checking reputable industry news sources and publications.
Methodology
Step 1 - Identification of Relevant Samples Size from Population Database


Step 2 - Approaches for Defining Global Market Size (Value, Volume* & Price*)

Note*: In applicable scenarios
Step 3 - Data Sources
Primary Research
- Web Analytics
- Survey Reports
- Research Institute
- Latest Research Reports
- Opinion Leaders
Secondary Research
- Annual Reports
- White Paper
- Latest Press Release
- Industry Association
- Paid Database
- Investor Presentations

Step 4 - Data Triangulation
Involves using different sources of information in order to increase the validity of a study
These sources are likely to be stakeholders in a program - participants, other researchers, program staff, other community members, and so on.
Then we put all data in single framework & apply various statistical tools to find out the dynamic on the market.
During the analysis stage, feedback from the stakeholder groups would be compared to determine areas of agreement as well as areas of divergence
