

Key Insights
The New Zealand food service market is projected for robust growth, with an estimated market size of 15.95 billion in the base year 2025. Anticipated to expand at a Compound Annual Growth Rate (CAGR) of 4.59% from 2025 to 2033, this expansion is driven by a growing population, increased disposable incomes, and a heightened consumer demand for convenience and diverse culinary experiences. The proliferation of Quick-Service Restaurants (QSRs) and the surge in home delivery services are significant contributors. Evolving consumer lifestyles, marked by a preference for healthier options and personalized dining, are also shaping market dynamics. Key challenges include rising food costs, labor shortages, and intensifying competition. The market is segmented by type (Full-Service Restaurants, QSRs, Street Stalls & Kiosks, Cafes/Bars, 100% Home Delivery Restaurants) and structure (Independent and Chained Consumer Foodservice), with distinct growth trajectories influenced by consumer preferences and operational models. Leading players like McDonald's, Starbucks, and Domino's are capitalizing on brand strength and operational efficiency, while independent businesses focus on niche offerings and personalized service.
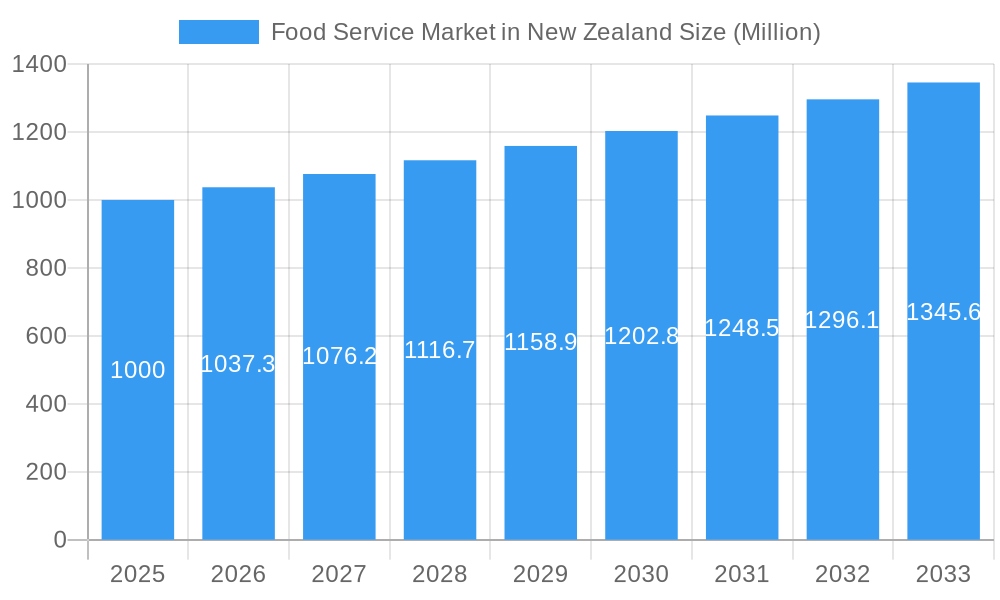
Food Service Market in New Zealand Market Size (In Billion)
Segmentation analysis highlights rapid growth in QSRs and home delivery services, driven by convenience and affordability. Cafes and bars are gaining popularity, reflecting changing consumer preferences for social engagement and varied food and beverage options. Full-service restaurants are expected to see moderate growth. The independent sector thrives on adaptability to local tastes and emerging trends, though scaling and brand visibility remain competitive challenges against larger chains. Future market development will be influenced by innovative food and beverage offerings, advancements in ordering and delivery technology, and effective strategies for managing operational costs and workforce.
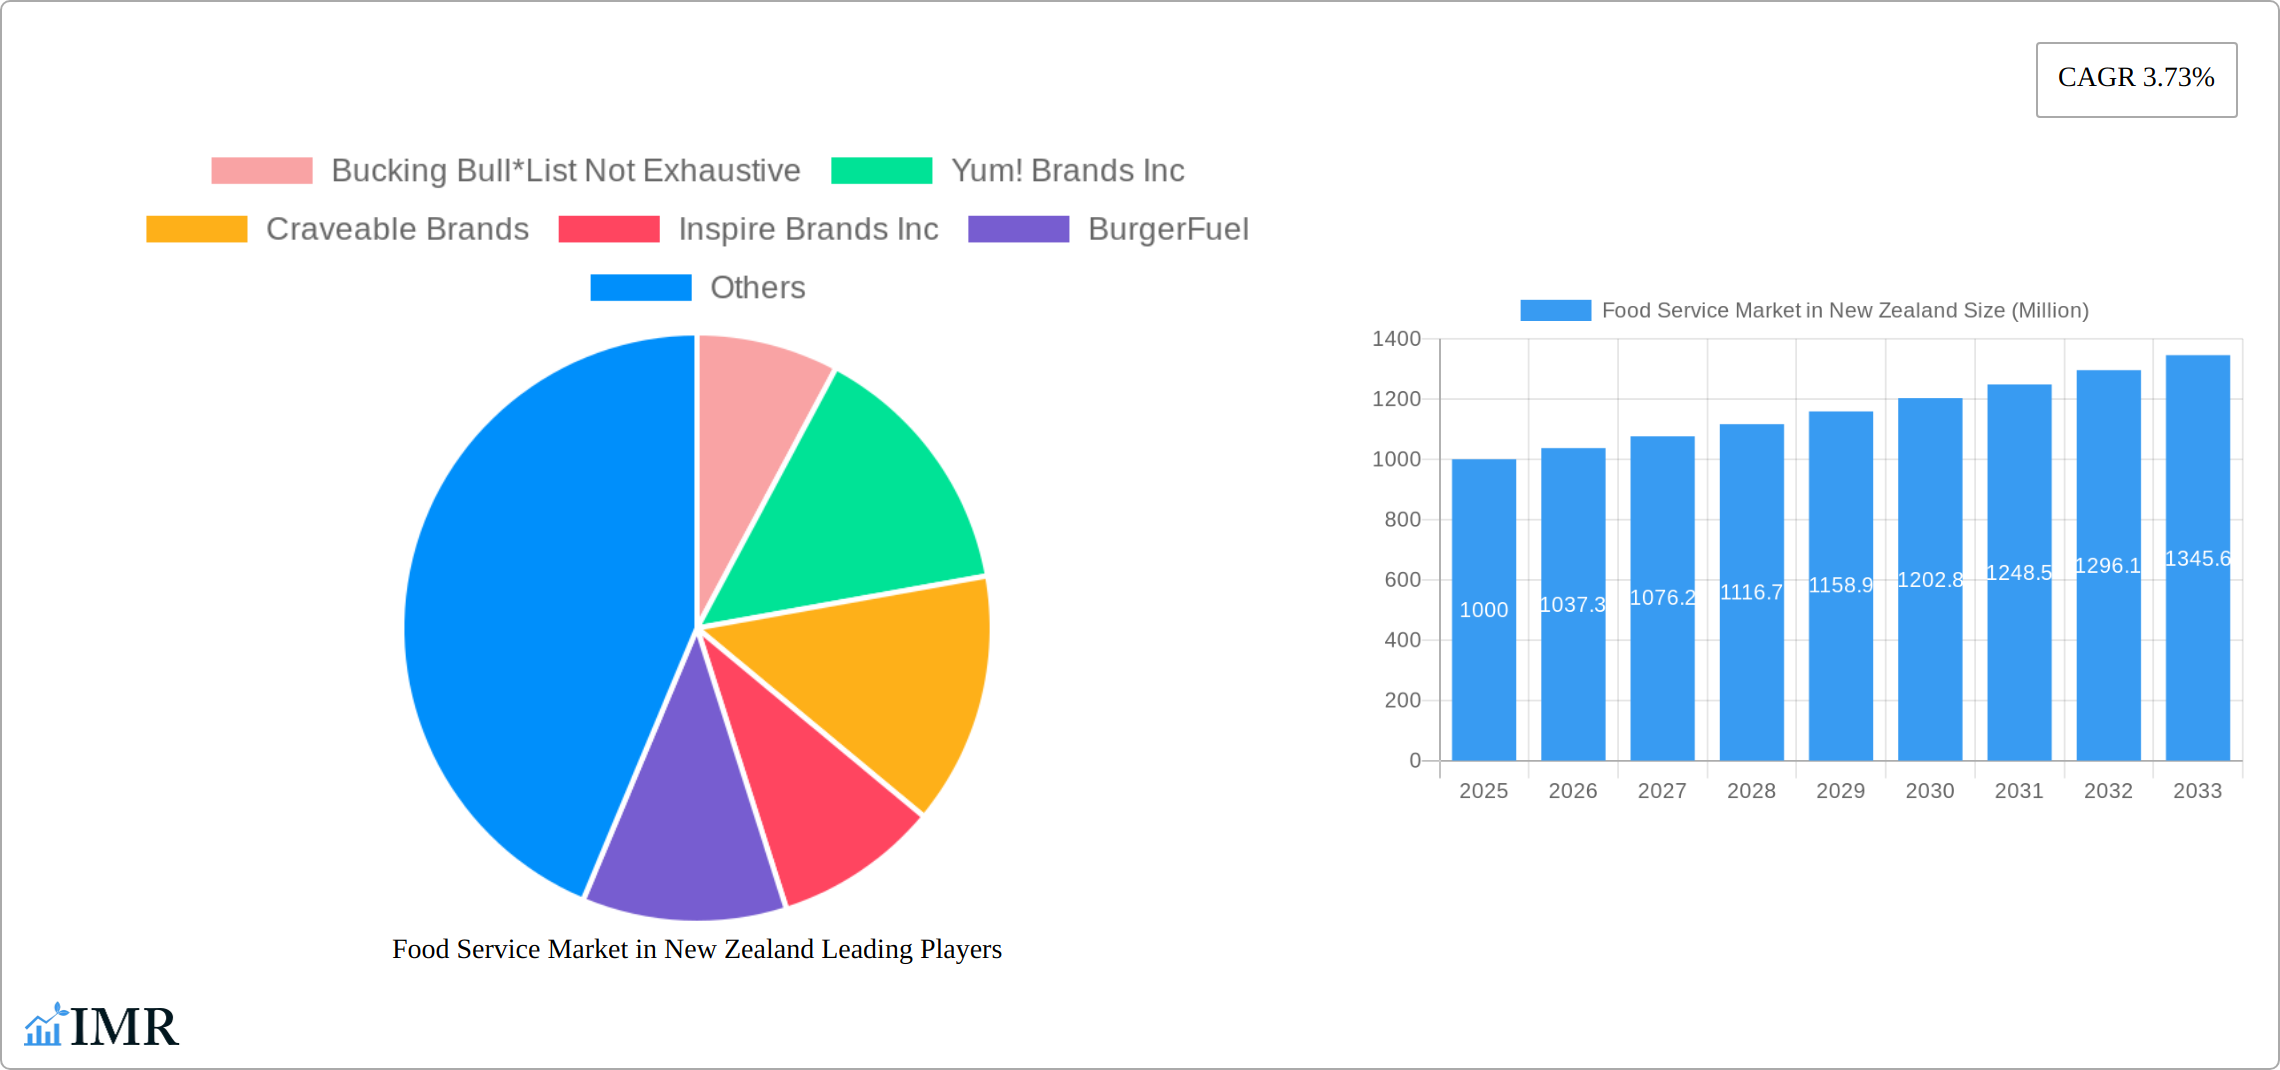
Food Service Market in New Zealand Company Market Share
Food Service Market in New Zealand: A Comprehensive Market Report (2019-2033)
This in-depth report provides a comprehensive analysis of the New Zealand food service market, encompassing market dynamics, growth trends, key players, and future outlook. The study covers the period from 2019 to 2033, with 2025 serving as the base and estimated year. The report is invaluable for industry professionals, investors, and anyone seeking to understand this dynamic sector.
Food Service Market in New Zealand Market Dynamics & Structure
The New Zealand food service market is a diverse landscape shaped by a combination of factors. Market concentration is moderate, with both large international chains and numerous independent operators coexisting. Technological innovation, particularly in online ordering and delivery platforms, is a key driver, while regulatory frameworks concerning food safety and hygiene significantly impact operations. The market faces competition from home-cooked meals and grocery delivery services, acting as product substitutes. End-user demographics, including age, income, and lifestyle preferences, significantly influence demand across different segments. M&A activity has been relatively modest in recent years, with xx deals recorded between 2019 and 2024, representing a xx% market share shift.
- Market Concentration: Moderate, with a mix of large chains and independent businesses.
- Technological Innovation: Strong influence from online ordering, delivery apps, and kitchen automation.
- Regulatory Framework: Stringent food safety and hygiene regulations.
- Competitive Substitutes: Home-cooked meals and grocery delivery services.
- End-User Demographics: Significant influence from age, income, and lifestyle trends.
- M&A Activity: xx deals (2019-2024), resulting in a xx% shift in market share. Innovation barriers include high initial investment costs and integration challenges.
Food Service Market in New Zealand Growth Trends & Insights
The New Zealand food service market experienced steady growth throughout the historical period (2019-2024), with a CAGR of xx%. This growth is attributable to several factors, including rising disposable incomes, increasing urbanization, and changing consumer preferences towards convenience and diverse culinary experiences. The market size in 2024 was estimated at NZD xx million, and is projected to reach NZD xx million by 2033, exhibiting a CAGR of xx% during the forecast period (2025-2033). Technological disruptions, such as the rise of online food delivery platforms, have significantly accelerated market growth and altered consumer behavior, favoring convenience and speed. Market penetration of online ordering has increased from xx% in 2019 to xx% in 2024.
Dominant Regions, Countries, or Segments in Food Service Market in New Zealand
The New Zealand food service market is a dynamic landscape, with the Quick-Service Restaurant (QSR) segment currently holding the largest market share in 2024, accounting for approximately [Insert Percentage]% of the total. This dominance stems from factors including affordability, convenience, and widespread accessibility. Auckland and other major urban areas demonstrate significantly higher market concentration and faster growth rates than their rural counterparts. The QSR segment's dominance is further amplified by the explosive growth of 100% home delivery restaurants, a trend accelerated by the pandemic. Analyzing the market "By Structure," Chained Consumer Foodservice exhibits considerably higher growth than Independent Consumer Foodservice, illustrating a clear trend of industry consolidation.
- Key Drivers of QSR Dominance:
- Unbeatable affordability and unparalleled convenience.
- Extensive geographical reach and accessibility.
- Highly effective marketing and branding strategies.
- Rapid expansion and optimization of delivery services.
- Adaptability to changing consumer preferences and trends.
- Growth Potential: Continued expansion within urban centers, fueled by rising popularity of home delivery and the increasing demand for diverse food options. Opportunities also exist in catering to evolving consumer preferences for healthier choices and sustainable practices.
Food Service Market in New Zealand Product Landscape
Innovation in the New Zealand food service market is being driven by the evolution of consumer preferences and rapid technological advancements. This translates to a growing demand for healthier menu options, personalized dining experiences, and the integration of technology to enhance customer service and operational efficiency. Successful businesses are focusing on unique selling propositions such as locally sourced ingredients, customizable meal options, and seamless online ordering experiences. Larger chains are increasingly adopting technologies like AI-powered recommendation systems and robotic kitchen automation to streamline operations, reduce costs, and improve overall efficiency.
Key Drivers, Barriers & Challenges in Food Service Market in New Zealand
Key Drivers: Rising disposable incomes, increasing urbanization, changing lifestyles favoring convenience, and technological advancements driving online ordering and delivery systems.
Key Challenges: Rising labor costs, increasing competition, regulatory compliance costs, and supply chain disruptions causing fluctuating ingredient prices (a xx% increase in 2024 compared to 2019). These challenges create operational pressure, potentially impacting profitability and market expansion.
Emerging Opportunities in Food Service Market in New Zealand
Emerging opportunities lie in the growing demand for healthier food options, sustainable practices, and personalized dining experiences. Untapped markets include catering to specific dietary needs (vegan, vegetarian, gluten-free) and expanding into niche segments like ghost kitchens and cloud kitchens. Evolving consumer preferences towards experiential dining and unique culinary concepts also represent significant opportunities.
Growth Accelerators in the Food Service Market in New Zealand Industry
Technological advancements, encompassing online ordering systems, sophisticated delivery platforms, and automated kitchen solutions, are proving to be pivotal catalysts for sustained market growth. Strategic partnerships between food service providers and technology companies further accelerate market expansion. Robust marketing campaigns that effectively highlight value propositions, coupled with customer loyalty programs, significantly enhance brand recognition and attract new customer bases. Furthermore, a focus on sustainability and ethical sourcing practices is increasingly important for attracting environmentally conscious consumers.
Key Players Shaping the Food Service Market in New Zealand Market
- Bucking Bull
- Yum! Brands Inc
- Craveable Brands
- Inspire Brands Inc
- BurgerFuel
- Domino's Pizza Inc
- Columbus Coffee
- Starbucks Corporation
- Hungry Jack's Pty Ltd
- McDonald's Corporation
Notable Milestones in Food Service Market in New Zealand Sector
- October 2021: Domino's launched Halloween Pizza Roulettes in Australia and New Zealand for a limited time, showcasing innovative marketing strategies.
- January 2021: Starbucks revamped its global coffee brand, starting with its flagship Auckland cafe. Tahua Capital announced three new cafe openings, demonstrating confidence in market growth.
In-Depth Food Service Market in New Zealand Market Outlook
The New Zealand food service market presents a promising outlook for continued growth, driven by technological innovation, evolving consumer preferences, and strategic investments. Businesses that successfully adapt to shifting consumer demands, leverage technology to enhance efficiency and the customer experience, and prioritize sustainability and ethical practices are well-positioned to capitalize on significant opportunities. The long-term outlook remains positive, with considerable potential for substantial market expansion and increased profitability. The market will continue to see competition and innovation as businesses strive to meet the evolving needs of New Zealand consumers.
Food Service Market in New Zealand Segmentation
-
1. Type
- 1.1. Full-Service Restaurants
- 1.2. Quick-Service Restaurants
- 1.3. Street Stalls and Kiosks
- 1.4. Cafes/Bar
- 1.5. 100% Home Delivery Restaurant
-
2. Structure
- 2.1. Independent Consumer Foodservice
- 2.2. Chained Consumer Foodservice
Food Service Market in New Zealand Segmentation By Geography
-
1. North America
- 1.1. United States
- 1.2. Canada
- 1.3. Mexico
-
2. South America
- 2.1. Brazil
- 2.2. Argentina
- 2.3. Rest of South America
-
3. Europe
- 3.1. United Kingdom
- 3.2. Germany
- 3.3. France
- 3.4. Italy
- 3.5. Spain
- 3.6. Russia
- 3.7. Benelux
- 3.8. Nordics
- 3.9. Rest of Europe
-
4. Middle East & Africa
- 4.1. Turkey
- 4.2. Israel
- 4.3. GCC
- 4.4. North Africa
- 4.5. South Africa
- 4.6. Rest of Middle East & Africa
-
5. Asia Pacific
- 5.1. China
- 5.2. India
- 5.3. Japan
- 5.4. South Korea
- 5.5. ASEAN
- 5.6. Oceania
- 5.7. Rest of Asia Pacific
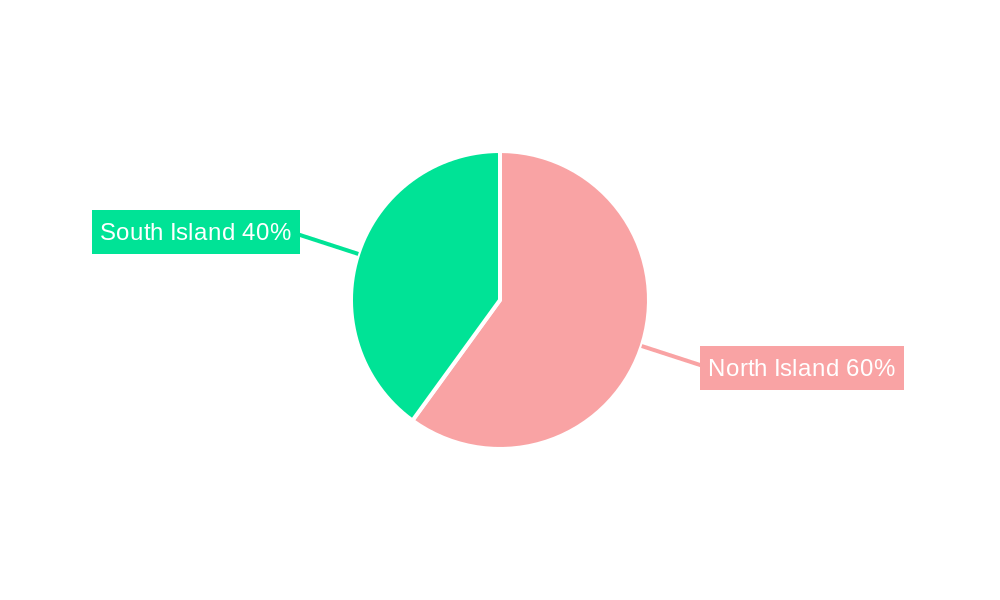
Food Service Market in New Zealand Regional Market Share
Geographic Coverage of Food Service Market in New Zealand
Food Service Market in New Zealand REPORT HIGHLIGHTS
| Aspects | Details |
|---|---|
| Study Period | 2020-2034 |
| Base Year | 2025 |
| Estimated Year | 2026 |
| Forecast Period | 2026-2034 |
| Historical Period | 2020-2025 |
| Growth Rate | CAGR of 4.59% from 2020-2034 |
| Segmentation |
|
Table of Contents
- 1. Introduction
- 1.1. Research Scope
- 1.2. Market Segmentation
- 1.3. Research Methodology
- 1.4. Definitions and Assumptions
- 2. Executive Summary
- 2.1. Introduction
- 3. Market Dynamics
- 3.1. Introduction
- 3.2. Market Drivers
- 3.2.1. Increasing Demand for Protein-Rich Food; Increasing Demand for Plant-Based and Organic Ingredients
- 3.3. Market Restrains
- 3.3.1. Presence of Alternative Proteins
- 3.4. Market Trends
- 3.4.1. Full-Service Restaurants Segment Fueling Market Growth
- 4. Market Factor Analysis
- 4.1. Porters Five Forces
- 4.2. Supply/Value Chain
- 4.3. PESTEL analysis
- 4.4. Market Entropy
- 4.5. Patent/Trademark Analysis
- 5. Global Food Service Market in New Zealand Analysis, Insights and Forecast, 2020-2032
- 5.1. Market Analysis, Insights and Forecast - by Type
- 5.1.1. Full-Service Restaurants
- 5.1.2. Quick-Service Restaurants
- 5.1.3. Street Stalls and Kiosks
- 5.1.4. Cafes/Bar
- 5.1.5. 100% Home Delivery Restaurant
- 5.2. Market Analysis, Insights and Forecast - by Structure
- 5.2.1. Independent Consumer Foodservice
- 5.2.2. Chained Consumer Foodservice
- 5.3. Market Analysis, Insights and Forecast - by Region
- 5.3.1. North America
- 5.3.2. South America
- 5.3.3. Europe
- 5.3.4. Middle East & Africa
- 5.3.5. Asia Pacific
- 5.1. Market Analysis, Insights and Forecast - by Type
- 6. North America Food Service Market in New Zealand Analysis, Insights and Forecast, 2020-2032
- 6.1. Market Analysis, Insights and Forecast - by Type
- 6.1.1. Full-Service Restaurants
- 6.1.2. Quick-Service Restaurants
- 6.1.3. Street Stalls and Kiosks
- 6.1.4. Cafes/Bar
- 6.1.5. 100% Home Delivery Restaurant
- 6.2. Market Analysis, Insights and Forecast - by Structure
- 6.2.1. Independent Consumer Foodservice
- 6.2.2. Chained Consumer Foodservice
- 6.1. Market Analysis, Insights and Forecast - by Type
- 7. South America Food Service Market in New Zealand Analysis, Insights and Forecast, 2020-2032
- 7.1. Market Analysis, Insights and Forecast - by Type
- 7.1.1. Full-Service Restaurants
- 7.1.2. Quick-Service Restaurants
- 7.1.3. Street Stalls and Kiosks
- 7.1.4. Cafes/Bar
- 7.1.5. 100% Home Delivery Restaurant
- 7.2. Market Analysis, Insights and Forecast - by Structure
- 7.2.1. Independent Consumer Foodservice
- 7.2.2. Chained Consumer Foodservice
- 7.1. Market Analysis, Insights and Forecast - by Type
- 8. Europe Food Service Market in New Zealand Analysis, Insights and Forecast, 2020-2032
- 8.1. Market Analysis, Insights and Forecast - by Type
- 8.1.1. Full-Service Restaurants
- 8.1.2. Quick-Service Restaurants
- 8.1.3. Street Stalls and Kiosks
- 8.1.4. Cafes/Bar
- 8.1.5. 100% Home Delivery Restaurant
- 8.2. Market Analysis, Insights and Forecast - by Structure
- 8.2.1. Independent Consumer Foodservice
- 8.2.2. Chained Consumer Foodservice
- 8.1. Market Analysis, Insights and Forecast - by Type
- 9. Middle East & Africa Food Service Market in New Zealand Analysis, Insights and Forecast, 2020-2032
- 9.1. Market Analysis, Insights and Forecast - by Type
- 9.1.1. Full-Service Restaurants
- 9.1.2. Quick-Service Restaurants
- 9.1.3. Street Stalls and Kiosks
- 9.1.4. Cafes/Bar
- 9.1.5. 100% Home Delivery Restaurant
- 9.2. Market Analysis, Insights and Forecast - by Structure
- 9.2.1. Independent Consumer Foodservice
- 9.2.2. Chained Consumer Foodservice
- 9.1. Market Analysis, Insights and Forecast - by Type
- 10. Asia Pacific Food Service Market in New Zealand Analysis, Insights and Forecast, 2020-2032
- 10.1. Market Analysis, Insights and Forecast - by Type
- 10.1.1. Full-Service Restaurants
- 10.1.2. Quick-Service Restaurants
- 10.1.3. Street Stalls and Kiosks
- 10.1.4. Cafes/Bar
- 10.1.5. 100% Home Delivery Restaurant
- 10.2. Market Analysis, Insights and Forecast - by Structure
- 10.2.1. Independent Consumer Foodservice
- 10.2.2. Chained Consumer Foodservice
- 10.1. Market Analysis, Insights and Forecast - by Type
- 11. Competitive Analysis
- 11.1. Global Market Share Analysis 2025
- 11.2. Company Profiles
- 11.2.1 Bucking Bull*List Not Exhaustive
- 11.2.1.1. Overview
- 11.2.1.2. Products
- 11.2.1.3. SWOT Analysis
- 11.2.1.4. Recent Developments
- 11.2.1.5. Financials (Based on Availability)
- 11.2.2 Yum! Brands Inc
- 11.2.2.1. Overview
- 11.2.2.2. Products
- 11.2.2.3. SWOT Analysis
- 11.2.2.4. Recent Developments
- 11.2.2.5. Financials (Based on Availability)
- 11.2.3 Craveable Brands
- 11.2.3.1. Overview
- 11.2.3.2. Products
- 11.2.3.3. SWOT Analysis
- 11.2.3.4. Recent Developments
- 11.2.3.5. Financials (Based on Availability)
- 11.2.4 Inspire Brands Inc
- 11.2.4.1. Overview
- 11.2.4.2. Products
- 11.2.4.3. SWOT Analysis
- 11.2.4.4. Recent Developments
- 11.2.4.5. Financials (Based on Availability)
- 11.2.5 BurgerFuel
- 11.2.5.1. Overview
- 11.2.5.2. Products
- 11.2.5.3. SWOT Analysis
- 11.2.5.4. Recent Developments
- 11.2.5.5. Financials (Based on Availability)
- 11.2.6 Domino's Pizza Inc
- 11.2.6.1. Overview
- 11.2.6.2. Products
- 11.2.6.3. SWOT Analysis
- 11.2.6.4. Recent Developments
- 11.2.6.5. Financials (Based on Availability)
- 11.2.7 Columbus Coffee
- 11.2.7.1. Overview
- 11.2.7.2. Products
- 11.2.7.3. SWOT Analysis
- 11.2.7.4. Recent Developments
- 11.2.7.5. Financials (Based on Availability)
- 11.2.8 Starbucks Corporation
- 11.2.8.1. Overview
- 11.2.8.2. Products
- 11.2.8.3. SWOT Analysis
- 11.2.8.4. Recent Developments
- 11.2.8.5. Financials (Based on Availability)
- 11.2.9 Hungry Jack's Pty Ltd
- 11.2.9.1. Overview
- 11.2.9.2. Products
- 11.2.9.3. SWOT Analysis
- 11.2.9.4. Recent Developments
- 11.2.9.5. Financials (Based on Availability)
- 11.2.10 McDonald's Corporation
- 11.2.10.1. Overview
- 11.2.10.2. Products
- 11.2.10.3. SWOT Analysis
- 11.2.10.4. Recent Developments
- 11.2.10.5. Financials (Based on Availability)
- 11.2.1 Bucking Bull*List Not Exhaustive
List of Figures
- Figure 1: Global Food Service Market in New Zealand Revenue Breakdown (billion, %) by Region 2025 & 2033
- Figure 2: North America Food Service Market in New Zealand Revenue (billion), by Type 2025 & 2033
- Figure 3: North America Food Service Market in New Zealand Revenue Share (%), by Type 2025 & 2033
- Figure 4: North America Food Service Market in New Zealand Revenue (billion), by Structure 2025 & 2033
- Figure 5: North America Food Service Market in New Zealand Revenue Share (%), by Structure 2025 & 2033
- Figure 6: North America Food Service Market in New Zealand Revenue (billion), by Country 2025 & 2033
- Figure 7: North America Food Service Market in New Zealand Revenue Share (%), by Country 2025 & 2033
- Figure 8: South America Food Service Market in New Zealand Revenue (billion), by Type 2025 & 2033
- Figure 9: South America Food Service Market in New Zealand Revenue Share (%), by Type 2025 & 2033
- Figure 10: South America Food Service Market in New Zealand Revenue (billion), by Structure 2025 & 2033
- Figure 11: South America Food Service Market in New Zealand Revenue Share (%), by Structure 2025 & 2033
- Figure 12: South America Food Service Market in New Zealand Revenue (billion), by Country 2025 & 2033
- Figure 13: South America Food Service Market in New Zealand Revenue Share (%), by Country 2025 & 2033
- Figure 14: Europe Food Service Market in New Zealand Revenue (billion), by Type 2025 & 2033
- Figure 15: Europe Food Service Market in New Zealand Revenue Share (%), by Type 2025 & 2033
- Figure 16: Europe Food Service Market in New Zealand Revenue (billion), by Structure 2025 & 2033
- Figure 17: Europe Food Service Market in New Zealand Revenue Share (%), by Structure 2025 & 2033
- Figure 18: Europe Food Service Market in New Zealand Revenue (billion), by Country 2025 & 2033
- Figure 19: Europe Food Service Market in New Zealand Revenue Share (%), by Country 2025 & 2033
- Figure 20: Middle East & Africa Food Service Market in New Zealand Revenue (billion), by Type 2025 & 2033
- Figure 21: Middle East & Africa Food Service Market in New Zealand Revenue Share (%), by Type 2025 & 2033
- Figure 22: Middle East & Africa Food Service Market in New Zealand Revenue (billion), by Structure 2025 & 2033
- Figure 23: Middle East & Africa Food Service Market in New Zealand Revenue Share (%), by Structure 2025 & 2033
- Figure 24: Middle East & Africa Food Service Market in New Zealand Revenue (billion), by Country 2025 & 2033
- Figure 25: Middle East & Africa Food Service Market in New Zealand Revenue Share (%), by Country 2025 & 2033
- Figure 26: Asia Pacific Food Service Market in New Zealand Revenue (billion), by Type 2025 & 2033
- Figure 27: Asia Pacific Food Service Market in New Zealand Revenue Share (%), by Type 2025 & 2033
- Figure 28: Asia Pacific Food Service Market in New Zealand Revenue (billion), by Structure 2025 & 2033
- Figure 29: Asia Pacific Food Service Market in New Zealand Revenue Share (%), by Structure 2025 & 2033
- Figure 30: Asia Pacific Food Service Market in New Zealand Revenue (billion), by Country 2025 & 2033
- Figure 31: Asia Pacific Food Service Market in New Zealand Revenue Share (%), by Country 2025 & 2033
List of Tables
- Table 1: Global Food Service Market in New Zealand Revenue billion Forecast, by Type 2020 & 2033
- Table 2: Global Food Service Market in New Zealand Revenue billion Forecast, by Structure 2020 & 2033
- Table 3: Global Food Service Market in New Zealand Revenue billion Forecast, by Region 2020 & 2033
- Table 4: Global Food Service Market in New Zealand Revenue billion Forecast, by Type 2020 & 2033
- Table 5: Global Food Service Market in New Zealand Revenue billion Forecast, by Structure 2020 & 2033
- Table 6: Global Food Service Market in New Zealand Revenue billion Forecast, by Country 2020 & 2033
- Table 7: United States Food Service Market in New Zealand Revenue (billion) Forecast, by Application 2020 & 2033
- Table 8: Canada Food Service Market in New Zealand Revenue (billion) Forecast, by Application 2020 & 2033
- Table 9: Mexico Food Service Market in New Zealand Revenue (billion) Forecast, by Application 2020 & 2033
- Table 10: Global Food Service Market in New Zealand Revenue billion Forecast, by Type 2020 & 2033
- Table 11: Global Food Service Market in New Zealand Revenue billion Forecast, by Structure 2020 & 2033
- Table 12: Global Food Service Market in New Zealand Revenue billion Forecast, by Country 2020 & 2033
- Table 13: Brazil Food Service Market in New Zealand Revenue (billion) Forecast, by Application 2020 & 2033
- Table 14: Argentina Food Service Market in New Zealand Revenue (billion) Forecast, by Application 2020 & 2033
- Table 15: Rest of South America Food Service Market in New Zealand Revenue (billion) Forecast, by Application 2020 & 2033
- Table 16: Global Food Service Market in New Zealand Revenue billion Forecast, by Type 2020 & 2033
- Table 17: Global Food Service Market in New Zealand Revenue billion Forecast, by Structure 2020 & 2033
- Table 18: Global Food Service Market in New Zealand Revenue billion Forecast, by Country 2020 & 2033
- Table 19: United Kingdom Food Service Market in New Zealand Revenue (billion) Forecast, by Application 2020 & 2033
- Table 20: Germany Food Service Market in New Zealand Revenue (billion) Forecast, by Application 2020 & 2033
- Table 21: France Food Service Market in New Zealand Revenue (billion) Forecast, by Application 2020 & 2033
- Table 22: Italy Food Service Market in New Zealand Revenue (billion) Forecast, by Application 2020 & 2033
- Table 23: Spain Food Service Market in New Zealand Revenue (billion) Forecast, by Application 2020 & 2033
- Table 24: Russia Food Service Market in New Zealand Revenue (billion) Forecast, by Application 2020 & 2033
- Table 25: Benelux Food Service Market in New Zealand Revenue (billion) Forecast, by Application 2020 & 2033
- Table 26: Nordics Food Service Market in New Zealand Revenue (billion) Forecast, by Application 2020 & 2033
- Table 27: Rest of Europe Food Service Market in New Zealand Revenue (billion) Forecast, by Application 2020 & 2033
- Table 28: Global Food Service Market in New Zealand Revenue billion Forecast, by Type 2020 & 2033
- Table 29: Global Food Service Market in New Zealand Revenue billion Forecast, by Structure 2020 & 2033
- Table 30: Global Food Service Market in New Zealand Revenue billion Forecast, by Country 2020 & 2033
- Table 31: Turkey Food Service Market in New Zealand Revenue (billion) Forecast, by Application 2020 & 2033
- Table 32: Israel Food Service Market in New Zealand Revenue (billion) Forecast, by Application 2020 & 2033
- Table 33: GCC Food Service Market in New Zealand Revenue (billion) Forecast, by Application 2020 & 2033
- Table 34: North Africa Food Service Market in New Zealand Revenue (billion) Forecast, by Application 2020 & 2033
- Table 35: South Africa Food Service Market in New Zealand Revenue (billion) Forecast, by Application 2020 & 2033
- Table 36: Rest of Middle East & Africa Food Service Market in New Zealand Revenue (billion) Forecast, by Application 2020 & 2033
- Table 37: Global Food Service Market in New Zealand Revenue billion Forecast, by Type 2020 & 2033
- Table 38: Global Food Service Market in New Zealand Revenue billion Forecast, by Structure 2020 & 2033
- Table 39: Global Food Service Market in New Zealand Revenue billion Forecast, by Country 2020 & 2033
- Table 40: China Food Service Market in New Zealand Revenue (billion) Forecast, by Application 2020 & 2033
- Table 41: India Food Service Market in New Zealand Revenue (billion) Forecast, by Application 2020 & 2033
- Table 42: Japan Food Service Market in New Zealand Revenue (billion) Forecast, by Application 2020 & 2033
- Table 43: South Korea Food Service Market in New Zealand Revenue (billion) Forecast, by Application 2020 & 2033
- Table 44: ASEAN Food Service Market in New Zealand Revenue (billion) Forecast, by Application 2020 & 2033
- Table 45: Oceania Food Service Market in New Zealand Revenue (billion) Forecast, by Application 2020 & 2033
- Table 46: Rest of Asia Pacific Food Service Market in New Zealand Revenue (billion) Forecast, by Application 2020 & 2033
Frequently Asked Questions
1. What is the projected Compound Annual Growth Rate (CAGR) of the Food Service Market in New Zealand?
The projected CAGR is approximately 4.59%.
2. Which companies are prominent players in the Food Service Market in New Zealand?
Key companies in the market include Bucking Bull*List Not Exhaustive, Yum! Brands Inc, Craveable Brands, Inspire Brands Inc, BurgerFuel, Domino's Pizza Inc, Columbus Coffee, Starbucks Corporation, Hungry Jack's Pty Ltd, McDonald's Corporation.
3. What are the main segments of the Food Service Market in New Zealand?
The market segments include Type, Structure.
4. Can you provide details about the market size?
The market size is estimated to be USD 15.95 billion as of 2022.
5. What are some drivers contributing to market growth?
Increasing Demand for Protein-Rich Food; Increasing Demand for Plant-Based and Organic Ingredients.
6. What are the notable trends driving market growth?
Full-Service Restaurants Segment Fueling Market Growth.
7. Are there any restraints impacting market growth?
Presence of Alternative Proteins.
8. Can you provide examples of recent developments in the market?
October 2021: Domino's launched Halloween Pizza Roulettes in Australia and New Zealand for a week only.
9. What pricing options are available for accessing the report?
Pricing options include single-user, multi-user, and enterprise licenses priced at USD 3800, USD 4500, and USD 5800 respectively.
10. Is the market size provided in terms of value or volume?
The market size is provided in terms of value, measured in billion.
11. Are there any specific market keywords associated with the report?
Yes, the market keyword associated with the report is "Food Service Market in New Zealand," which aids in identifying and referencing the specific market segment covered.
12. How do I determine which pricing option suits my needs best?
The pricing options vary based on user requirements and access needs. Individual users may opt for single-user licenses, while businesses requiring broader access may choose multi-user or enterprise licenses for cost-effective access to the report.
13. Are there any additional resources or data provided in the Food Service Market in New Zealand report?
While the report offers comprehensive insights, it's advisable to review the specific contents or supplementary materials provided to ascertain if additional resources or data are available.
14. How can I stay updated on further developments or reports in the Food Service Market in New Zealand?
To stay informed about further developments, trends, and reports in the Food Service Market in New Zealand, consider subscribing to industry newsletters, following relevant companies and organizations, or regularly checking reputable industry news sources and publications.
Methodology
Step 1 - Identification of Relevant Samples Size from Population Database


Step 2 - Approaches for Defining Global Market Size (Value, Volume* & Price*)

Note*: In applicable scenarios
Step 3 - Data Sources
Primary Research
- Web Analytics
- Survey Reports
- Research Institute
- Latest Research Reports
- Opinion Leaders
Secondary Research
- Annual Reports
- White Paper
- Latest Press Release
- Industry Association
- Paid Database
- Investor Presentations

Step 4 - Data Triangulation
Involves using different sources of information in order to increase the validity of a study
These sources are likely to be stakeholders in a program - participants, other researchers, program staff, other community members, and so on.
Then we put all data in single framework & apply various statistical tools to find out the dynamic on the market.
During the analysis stage, feedback from the stakeholder groups would be compared to determine areas of agreement as well as areas of divergence