

Key Insights
The global fracking chemicals fluid market is experiencing robust growth, driven by the increasing demand for oil and gas extraction, particularly from unconventional sources like shale gas and tight oil. The market's Compound Annual Growth Rate (CAGR) exceeding 9% signifies significant expansion projected through 2033. This growth is fueled by several key factors: the continuous exploration and development of unconventional oil and gas reserves worldwide, the rising adoption of horizontal drilling and hydraulic fracturing techniques, and the increasing need for efficient and environmentally-friendly fracking fluid solutions. The market is segmented by fluid type (water-based, foam-based, oil-based, etc.), product type (linear gels, cross-linked fluids, etc.), function (surfactant, scale inhibitor, etc.), and application (oil & gas, mining). The water-based segment currently holds a significant market share due to its cost-effectiveness and relatively lower environmental impact compared to oil-based alternatives. However, the demand for high-performance, environmentally conscious synthetic-based fluids is rapidly increasing, driving innovation and technological advancements in the sector. Major players like Baker Hughes, Clariant, Halliburton, and Schlumberger are actively engaged in research and development to enhance the efficiency and sustainability of their offerings. Geographic regions such as North America and Asia-Pacific are leading the market growth due to significant shale gas exploration and production activities.
The market faces certain restraints, primarily related to environmental concerns and regulatory scrutiny surrounding the potential impacts of fracking fluids on groundwater and ecosystems. Stringent environmental regulations in several regions are influencing the development and adoption of eco-friendly fracking chemicals. Despite these challenges, the overall market outlook remains positive, with the continuous exploration and exploitation of unconventional resources driving demand for advanced and sustainable fracking fluid technologies. The ongoing technological advancements and the emergence of innovative solutions are expected to address the environmental concerns, paving the way for continued market expansion in the coming years. The increasing adoption of advanced fracturing techniques and the growth in the mining sector are also contributing to the overall positive trajectory of the market.
Fracking Chemicals Fluid Market: A Comprehensive Report (2019-2033)
This comprehensive report provides an in-depth analysis of the global Fracking Chemicals Fluid market, encompassing its dynamics, growth trends, regional segmentation, product landscape, key players, and future outlook. The study period covers 2019-2033, with 2025 as the base and estimated year. The forecast period spans 2025-2033, while the historical period is 2019-2024. This report is crucial for industry professionals, investors, and researchers seeking a detailed understanding of this vital segment within the broader Oil & Gas and Mining industries (parent markets).
Fracking Chemicals Fluid Market Market Dynamics & Structure
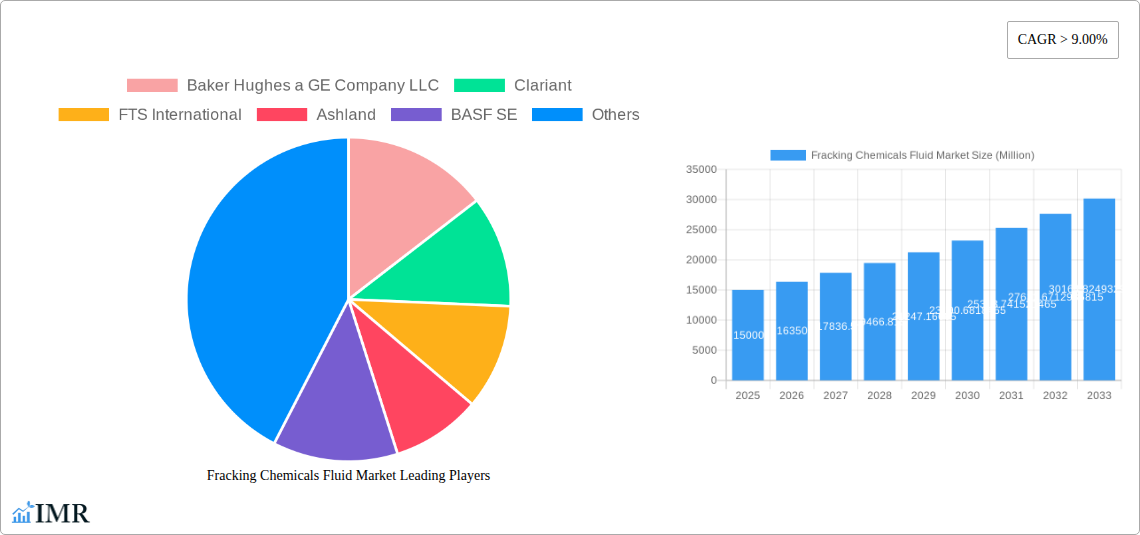
The global Fracking Chemicals Fluid market, valued at xx Million in 2025, exhibits a moderately concentrated structure with key players such as Baker Hughes a GE Company LLC, Clariant, FTS International, Ashland, BASF SE, Weatherford, DuPont, Dow, SNP Inc, Halliburton, Schlumberger Limited, Chevron Phillips Chemical Company, Albemarle Corporation, and Calfrac Well Services Ltd. holding significant market share. However, the market is dynamic, influenced by several factors:
- Technological Innovation: Constant advancements in fluid formulations (e.g., environmentally friendly alternatives) drive market growth, though high R&D costs pose a barrier to entry for smaller players.
- Regulatory Landscape: Stringent environmental regulations regarding fluid disposal and chemical composition significantly impact market dynamics, necessitating compliance and potentially increasing production costs.
- Competitive Landscape: Intense competition amongst established players fosters innovation and price pressures, while the emergence of new players with specialized products adds further complexity.
- Substitutes: Alternative fracturing techniques and less chemically-intensive methods pose a potential threat, although their efficacy and cost-effectiveness are still being evaluated.
- M&A Activity: Consolidation through mergers and acquisitions is observed, with xx major deals recorded in the past five years, aiming to enhance market share and technological capabilities. Market share distribution among top 5 players is approximately 55%.
Fracking Chemicals Fluid Market Growth Trends & Insights
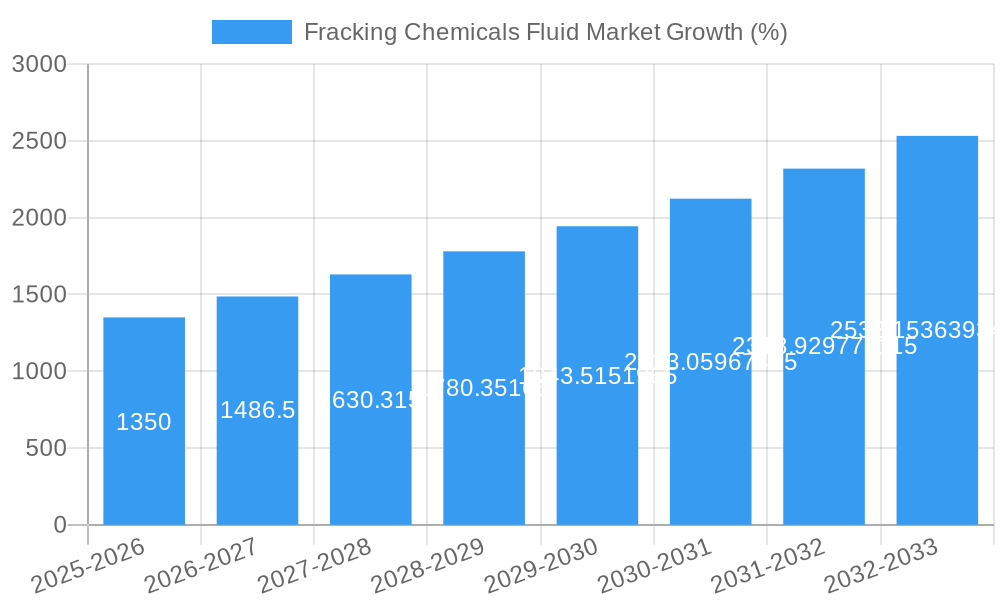
The Fracking Chemicals Fluid market is projected to witness robust growth, with a CAGR of xx% during the forecast period (2025-2033), driven by increasing oil and gas exploration and production activities globally, particularly in North America and the Middle East. The adoption rate of advanced fluid technologies, such as slick water-based fluids and synthetic-based fluids, is increasing due to their enhanced efficiency and environmental benefits. Technological disruptions, such as the development of biodegradable and less toxic fracturing fluids, are reshaping consumer behavior, pushing demand towards sustainable alternatives. Shifting consumer preferences toward eco-friendly solutions are creating new market opportunities. The market size is expected to reach xx Million by 2033.
Dominant Regions, Countries, or Segments in Fracking Chemicals Fluid Market
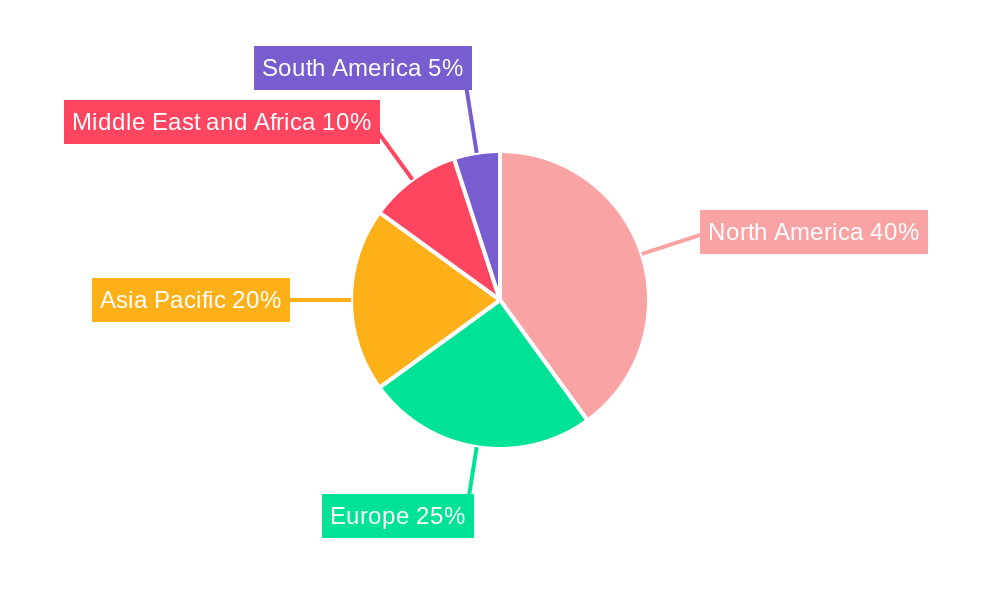
North America currently dominates the Fracking Chemicals Fluid market, holding approximately xx% market share in 2025, followed by the Middle East and Asia-Pacific. This dominance stems from:
- High Oil and Gas Production: Extensive shale gas reserves and ongoing exploration activities fuel high demand for fracturing fluids.
- Developed Infrastructure: Well-established oil and gas infrastructure supports efficient fluid supply chains.
- Favorable Regulatory Environment: Relatively less stringent regulations (compared to some regions) encourage market growth, though this is evolving.
Within the segment breakdown, the Slick Water-Based fluid type holds the largest market share due to its cost-effectiveness and widespread adoption. In terms of product type, Conventional Linear Gels currently dominate due to established usage and familiarity, while Borate Cross-Linked Fluids are experiencing significant growth due to their superior performance characteristics. The Oil and Gas application sector represents the dominant market share, while the Horizontal Well segment exhibits high growth potential.
Fracking Chemicals Fluid Market Product Landscape
The Fracking Chemicals Fluid market offers a diverse range of products, categorized by fluid type (water-based, oil-based, synthetic-based, etc.), function (surfactant, gelling agent, etc.), and application. Recent innovations focus on developing environmentally friendly, high-performance fluids with improved viscosity control, reduced friction, and enhanced proppant transport capabilities. These advancements aim to optimize well stimulation, increase hydrocarbon recovery, and minimize environmental impact. Unique selling propositions often revolve around superior performance characteristics, reduced environmental footprint, and cost-effectiveness.
Key Drivers, Barriers & Challenges in Fracking Chemicals Fluid Market
Key Drivers:
- Increasing global energy demand fuels higher oil and gas production, boosting demand for fracturing fluids.
- Technological advancements improve fluid efficiency and reduce environmental impact, driving adoption.
- Government incentives for oil and gas exploration in some regions stimulate market growth.
Key Challenges:
- Stringent environmental regulations increase production costs and restrict the use of certain chemicals. This leads to an estimated xx% increase in production costs for compliant formulations.
- Fluctuations in oil and gas prices impact market demand and profitability, causing uncertainty for producers.
- Intense competition amongst established players creates price pressure and limits profit margins.
Emerging Opportunities in Fracking Chemicals Fluid Market
- Growing demand for environmentally friendly fracturing fluids presents significant opportunities for bio-based and biodegradable alternatives.
- Expanding unconventional oil and gas exploration in emerging markets offers new avenues for market expansion.
- Development of specialized fluids for specific geological formations presents a niche market opportunity.
Growth Accelerators in the Fracking Chemicals Fluid Market Industry
Strategic partnerships between chemical manufacturers and oil and gas companies are accelerating innovation and market penetration. Technological breakthroughs in fluid formulation, such as nanotechnology-based additives, are improving performance and efficiency. The expansion of unconventional oil and gas resources in new geographical regions presents promising opportunities for market growth.
Key Players Shaping the Fracking Chemicals Fluid Market Market
- Baker Hughes a GE Company LLC
- Clariant
- FTS International
- Ashland
- BASF SE
- Weatherford
- DuPont
- Dow
- SNP Inc
- Halliburton
- Schlumberger Limited
- Chevron Phillips Chemical Company
- Albemarle Corporation
- Calfrac Well Services Ltd
Notable Milestones in Fracking Chemicals Fluid Market Sector
- 2021: Introduction of a new biodegradable fracturing fluid by Company X.
- 2022: Merger between Company Y and Company Z, creating a larger market player.
- 2023: Implementation of stricter environmental regulations in Region A, impacting fluid composition. (Further milestones can be added here as data becomes available.)
In-Depth Fracking Chemicals Fluid Market Market Outlook
The Fracking Chemicals Fluid market is poised for continued growth, driven by several factors including increasing energy demand, technological innovations, and strategic partnerships. The focus on environmentally friendly and cost-effective solutions will shape future market dynamics. Significant opportunities exist in emerging markets and in the development of specialized fluids tailored to specific geological formations. Strategic acquisitions and technological advancements will continue to reshape the competitive landscape.
Fracking Chemicals Fluid Market Segmentation
-
1. Fluid Type
- 1.1. Water Based
- 1.2. Foam Based
- 1.3. Gelled Oil-Based
- 1.4. Slick Water-Based
- 1.5. Synthetic Based
- 1.6. Others
-
2. Product Type
- 2.1. Conventional Linear Gels
- 2.2. Borate Cross-Linked Fluids
- 2.3. Organometallic Cross-Linked Fluids
- 2.4. Aluminium Phosphate Ester Oil Gels
-
3. Function
- 3.1. Surfactant
- 3.2. Scale Inhibitor
- 3.3. Friction Reducer
- 3.4. Corrosion Inhibitor
- 3.5. Biocide
- 3.6. Crosslinker
- 3.7. Gelling Agent
- 3.8. Others
-
4. Application
-
4.1. Oil and Gas
- 4.1.1. Oil Well
- 4.1.2. Shale Gas Well
- 4.1.3. Horizontal Well
- 4.2. Mining
- 4.3. Others
-
4.1. Oil and Gas
Fracking Chemicals Fluid Market Segmentation By Geography
-
1. Asia Pacific
- 1.1. China
- 1.2. India
- 1.3. Japan
- 1.4. South Korea
- 1.5. Rest of Asia Pacific
-
2. North America
- 2.1. United States
- 2.2. Canada
- 2.3. Mexico
-
3. Europe
- 3.1. Germany
- 3.2. United Kingdom
- 3.3. France
- 3.4. Italy
- 3.5. Rest of Europe
-
4. South America
- 4.1. Brazil
- 4.2. Argentina
- 4.3. Rest of South America
-
5. Middle East and Africa
- 5.1. Saudi Arabia
- 5.2. South Africa
- 5.3. Rest of Middle East and Africa
Fracking Chemicals Fluid Market REPORT HIGHLIGHTS
| Aspects | Details |
|---|---|
| Study Period | 2019-2033 |
| Base Year | 2024 |
| Estimated Year | 2025 |
| Forecast Period | 2025-2033 |
| Historical Period | 2019-2024 |
| Growth Rate | CAGR of > 9.00% from 2019-2033 |
| Segmentation |
|
Table of Contents
- 1. Introduction
- 1.1. Research Scope
- 1.2. Market Segmentation
- 1.3. Research Methodology
- 1.4. Definitions and Assumptions
- 2. Executive Summary
- 2.1. Introduction
- 3. Market Dynamics
- 3.1. Introduction
- 3.2. Market Drivers
- 3.2.1. ; Growing Demand of Fracking Chemicals Fluid from Oil and Gas Industry; Other Drivers
- 3.3. Market Restrains
- 3.3.1. ; Stringent Environmental and Governmental Regulations towards Fracking Fluids; Impact of COVID - 19
- 3.4. Market Trends
- 3.4.1. Growing Demand of Fracking Chemicals Fluid from Oil and Gas Industry
- 4. Market Factor Analysis
- 4.1. Porters Five Forces
- 4.2. Supply/Value Chain
- 4.3. PESTEL analysis
- 4.4. Market Entropy
- 4.5. Patent/Trademark Analysis
- 5. Global Fracking Chemicals Fluid Market Analysis, Insights and Forecast, 2019-2031
- 5.1. Market Analysis, Insights and Forecast - by Fluid Type
- 5.1.1. Water Based
- 5.1.2. Foam Based
- 5.1.3. Gelled Oil-Based
- 5.1.4. Slick Water-Based
- 5.1.5. Synthetic Based
- 5.1.6. Others
- 5.2. Market Analysis, Insights and Forecast - by Product Type
- 5.2.1. Conventional Linear Gels
- 5.2.2. Borate Cross-Linked Fluids
- 5.2.3. Organometallic Cross-Linked Fluids
- 5.2.4. Aluminium Phosphate Ester Oil Gels
- 5.3. Market Analysis, Insights and Forecast - by Function
- 5.3.1. Surfactant
- 5.3.2. Scale Inhibitor
- 5.3.3. Friction Reducer
- 5.3.4. Corrosion Inhibitor
- 5.3.5. Biocide
- 5.3.6. Crosslinker
- 5.3.7. Gelling Agent
- 5.3.8. Others
- 5.4. Market Analysis, Insights and Forecast - by Application
- 5.4.1. Oil and Gas
- 5.4.1.1. Oil Well
- 5.4.1.2. Shale Gas Well
- 5.4.1.3. Horizontal Well
- 5.4.2. Mining
- 5.4.3. Others
- 5.4.1. Oil and Gas
- 5.5. Market Analysis, Insights and Forecast - by Region
- 5.5.1. Asia Pacific
- 5.5.2. North America
- 5.5.3. Europe
- 5.5.4. South America
- 5.5.5. Middle East and Africa
- 5.1. Market Analysis, Insights and Forecast - by Fluid Type
- 6. Asia Pacific Fracking Chemicals Fluid Market Analysis, Insights and Forecast, 2019-2031
- 6.1. Market Analysis, Insights and Forecast - by Fluid Type
- 6.1.1. Water Based
- 6.1.2. Foam Based
- 6.1.3. Gelled Oil-Based
- 6.1.4. Slick Water-Based
- 6.1.5. Synthetic Based
- 6.1.6. Others
- 6.2. Market Analysis, Insights and Forecast - by Product Type
- 6.2.1. Conventional Linear Gels
- 6.2.2. Borate Cross-Linked Fluids
- 6.2.3. Organometallic Cross-Linked Fluids
- 6.2.4. Aluminium Phosphate Ester Oil Gels
- 6.3. Market Analysis, Insights and Forecast - by Function
- 6.3.1. Surfactant
- 6.3.2. Scale Inhibitor
- 6.3.3. Friction Reducer
- 6.3.4. Corrosion Inhibitor
- 6.3.5. Biocide
- 6.3.6. Crosslinker
- 6.3.7. Gelling Agent
- 6.3.8. Others
- 6.4. Market Analysis, Insights and Forecast - by Application
- 6.4.1. Oil and Gas
- 6.4.1.1. Oil Well
- 6.4.1.2. Shale Gas Well
- 6.4.1.3. Horizontal Well
- 6.4.2. Mining
- 6.4.3. Others
- 6.4.1. Oil and Gas
- 6.1. Market Analysis, Insights and Forecast - by Fluid Type
- 7. North America Fracking Chemicals Fluid Market Analysis, Insights and Forecast, 2019-2031
- 7.1. Market Analysis, Insights and Forecast - by Fluid Type
- 7.1.1. Water Based
- 7.1.2. Foam Based
- 7.1.3. Gelled Oil-Based
- 7.1.4. Slick Water-Based
- 7.1.5. Synthetic Based
- 7.1.6. Others
- 7.2. Market Analysis, Insights and Forecast - by Product Type
- 7.2.1. Conventional Linear Gels
- 7.2.2. Borate Cross-Linked Fluids
- 7.2.3. Organometallic Cross-Linked Fluids
- 7.2.4. Aluminium Phosphate Ester Oil Gels
- 7.3. Market Analysis, Insights and Forecast - by Function
- 7.3.1. Surfactant
- 7.3.2. Scale Inhibitor
- 7.3.3. Friction Reducer
- 7.3.4. Corrosion Inhibitor
- 7.3.5. Biocide
- 7.3.6. Crosslinker
- 7.3.7. Gelling Agent
- 7.3.8. Others
- 7.4. Market Analysis, Insights and Forecast - by Application
- 7.4.1. Oil and Gas
- 7.4.1.1. Oil Well
- 7.4.1.2. Shale Gas Well
- 7.4.1.3. Horizontal Well
- 7.4.2. Mining
- 7.4.3. Others
- 7.4.1. Oil and Gas
- 7.1. Market Analysis, Insights and Forecast - by Fluid Type
- 8. Europe Fracking Chemicals Fluid Market Analysis, Insights and Forecast, 2019-2031
- 8.1. Market Analysis, Insights and Forecast - by Fluid Type
- 8.1.1. Water Based
- 8.1.2. Foam Based
- 8.1.3. Gelled Oil-Based
- 8.1.4. Slick Water-Based
- 8.1.5. Synthetic Based
- 8.1.6. Others
- 8.2. Market Analysis, Insights and Forecast - by Product Type
- 8.2.1. Conventional Linear Gels
- 8.2.2. Borate Cross-Linked Fluids
- 8.2.3. Organometallic Cross-Linked Fluids
- 8.2.4. Aluminium Phosphate Ester Oil Gels
- 8.3. Market Analysis, Insights and Forecast - by Function
- 8.3.1. Surfactant
- 8.3.2. Scale Inhibitor
- 8.3.3. Friction Reducer
- 8.3.4. Corrosion Inhibitor
- 8.3.5. Biocide
- 8.3.6. Crosslinker
- 8.3.7. Gelling Agent
- 8.3.8. Others
- 8.4. Market Analysis, Insights and Forecast - by Application
- 8.4.1. Oil and Gas
- 8.4.1.1. Oil Well
- 8.4.1.2. Shale Gas Well
- 8.4.1.3. Horizontal Well
- 8.4.2. Mining
- 8.4.3. Others
- 8.4.1. Oil and Gas
- 8.1. Market Analysis, Insights and Forecast - by Fluid Type
- 9. South America Fracking Chemicals Fluid Market Analysis, Insights and Forecast, 2019-2031
- 9.1. Market Analysis, Insights and Forecast - by Fluid Type
- 9.1.1. Water Based
- 9.1.2. Foam Based
- 9.1.3. Gelled Oil-Based
- 9.1.4. Slick Water-Based
- 9.1.5. Synthetic Based
- 9.1.6. Others
- 9.2. Market Analysis, Insights and Forecast - by Product Type
- 9.2.1. Conventional Linear Gels
- 9.2.2. Borate Cross-Linked Fluids
- 9.2.3. Organometallic Cross-Linked Fluids
- 9.2.4. Aluminium Phosphate Ester Oil Gels
- 9.3. Market Analysis, Insights and Forecast - by Function
- 9.3.1. Surfactant
- 9.3.2. Scale Inhibitor
- 9.3.3. Friction Reducer
- 9.3.4. Corrosion Inhibitor
- 9.3.5. Biocide
- 9.3.6. Crosslinker
- 9.3.7. Gelling Agent
- 9.3.8. Others
- 9.4. Market Analysis, Insights and Forecast - by Application
- 9.4.1. Oil and Gas
- 9.4.1.1. Oil Well
- 9.4.1.2. Shale Gas Well
- 9.4.1.3. Horizontal Well
- 9.4.2. Mining
- 9.4.3. Others
- 9.4.1. Oil and Gas
- 9.1. Market Analysis, Insights and Forecast - by Fluid Type
- 10. Middle East and Africa Fracking Chemicals Fluid Market Analysis, Insights and Forecast, 2019-2031
- 10.1. Market Analysis, Insights and Forecast - by Fluid Type
- 10.1.1. Water Based
- 10.1.2. Foam Based
- 10.1.3. Gelled Oil-Based
- 10.1.4. Slick Water-Based
- 10.1.5. Synthetic Based
- 10.1.6. Others
- 10.2. Market Analysis, Insights and Forecast - by Product Type
- 10.2.1. Conventional Linear Gels
- 10.2.2. Borate Cross-Linked Fluids
- 10.2.3. Organometallic Cross-Linked Fluids
- 10.2.4. Aluminium Phosphate Ester Oil Gels
- 10.3. Market Analysis, Insights and Forecast - by Function
- 10.3.1. Surfactant
- 10.3.2. Scale Inhibitor
- 10.3.3. Friction Reducer
- 10.3.4. Corrosion Inhibitor
- 10.3.5. Biocide
- 10.3.6. Crosslinker
- 10.3.7. Gelling Agent
- 10.3.8. Others
- 10.4. Market Analysis, Insights and Forecast - by Application
- 10.4.1. Oil and Gas
- 10.4.1.1. Oil Well
- 10.4.1.2. Shale Gas Well
- 10.4.1.3. Horizontal Well
- 10.4.2. Mining
- 10.4.3. Others
- 10.4.1. Oil and Gas
- 10.1. Market Analysis, Insights and Forecast - by Fluid Type
- 11. Asia Pacific Fracking Chemicals Fluid Market Analysis, Insights and Forecast, 2019-2031
- 11.1. Market Analysis, Insights and Forecast - By Country/Sub-region
- 11.1.1 China
- 11.1.2 India
- 11.1.3 Japan
- 11.1.4 South Korea
- 11.1.5 Rest of Asia Pacific
- 12. North America Fracking Chemicals Fluid Market Analysis, Insights and Forecast, 2019-2031
- 12.1. Market Analysis, Insights and Forecast - By Country/Sub-region
- 12.1.1 United States
- 12.1.2 Canada
- 12.1.3 Mexico
- 13. Europe Fracking Chemicals Fluid Market Analysis, Insights and Forecast, 2019-2031
- 13.1. Market Analysis, Insights and Forecast - By Country/Sub-region
- 13.1.1 Germany
- 13.1.2 United Kingdom
- 13.1.3 France
- 13.1.4 Italy
- 13.1.5 Rest of Europe
- 14. South America Fracking Chemicals Fluid Market Analysis, Insights and Forecast, 2019-2031
- 14.1. Market Analysis, Insights and Forecast - By Country/Sub-region
- 14.1.1 Brazil
- 14.1.2 Argentina
- 14.1.3 Rest of South America
- 15. Middle East and Africa Fracking Chemicals Fluid Market Analysis, Insights and Forecast, 2019-2031
- 15.1. Market Analysis, Insights and Forecast - By Country/Sub-region
- 15.1.1 Saudi Arabia
- 15.1.2 South Africa
- 15.1.3 Rest of Middle East and Africa
- 16. Competitive Analysis
- 16.1. Global Market Share Analysis 2024
- 16.2. Company Profiles
- 16.2.1 Baker Hughes a GE Company LLC
- 16.2.1.1. Overview
- 16.2.1.2. Products
- 16.2.1.3. SWOT Analysis
- 16.2.1.4. Recent Developments
- 16.2.1.5. Financials (Based on Availability)
- 16.2.2 Clariant
- 16.2.2.1. Overview
- 16.2.2.2. Products
- 16.2.2.3. SWOT Analysis
- 16.2.2.4. Recent Developments
- 16.2.2.5. Financials (Based on Availability)
- 16.2.3 FTS International
- 16.2.3.1. Overview
- 16.2.3.2. Products
- 16.2.3.3. SWOT Analysis
- 16.2.3.4. Recent Developments
- 16.2.3.5. Financials (Based on Availability)
- 16.2.4 Ashland
- 16.2.4.1. Overview
- 16.2.4.2. Products
- 16.2.4.3. SWOT Analysis
- 16.2.4.4. Recent Developments
- 16.2.4.5. Financials (Based on Availability)
- 16.2.5 BASF SE
- 16.2.5.1. Overview
- 16.2.5.2. Products
- 16.2.5.3. SWOT Analysis
- 16.2.5.4. Recent Developments
- 16.2.5.5. Financials (Based on Availability)
- 16.2.6 Weatherford
- 16.2.6.1. Overview
- 16.2.6.2. Products
- 16.2.6.3. SWOT Analysis
- 16.2.6.4. Recent Developments
- 16.2.6.5. Financials (Based on Availability)
- 16.2.7 DuPont
- 16.2.7.1. Overview
- 16.2.7.2. Products
- 16.2.7.3. SWOT Analysis
- 16.2.7.4. Recent Developments
- 16.2.7.5. Financials (Based on Availability)
- 16.2.8 Dow
- 16.2.8.1. Overview
- 16.2.8.2. Products
- 16.2.8.3. SWOT Analysis
- 16.2.8.4. Recent Developments
- 16.2.8.5. Financials (Based on Availability)
- 16.2.9 SNP Inc
- 16.2.9.1. Overview
- 16.2.9.2. Products
- 16.2.9.3. SWOT Analysis
- 16.2.9.4. Recent Developments
- 16.2.9.5. Financials (Based on Availability)
- 16.2.10 Halliburton
- 16.2.10.1. Overview
- 16.2.10.2. Products
- 16.2.10.3. SWOT Analysis
- 16.2.10.4. Recent Developments
- 16.2.10.5. Financials (Based on Availability)
- 16.2.11 Schlumberger Limited
- 16.2.11.1. Overview
- 16.2.11.2. Products
- 16.2.11.3. SWOT Analysis
- 16.2.11.4. Recent Developments
- 16.2.11.5. Financials (Based on Availability)
- 16.2.12 Chevron PhillipsChemicalCompay*List Not Exhaustive
- 16.2.12.1. Overview
- 16.2.12.2. Products
- 16.2.12.3. SWOT Analysis
- 16.2.12.4. Recent Developments
- 16.2.12.5. Financials (Based on Availability)
- 16.2.13 Albemarle Corporation
- 16.2.13.1. Overview
- 16.2.13.2. Products
- 16.2.13.3. SWOT Analysis
- 16.2.13.4. Recent Developments
- 16.2.13.5. Financials (Based on Availability)
- 16.2.14 Calfrac Well Services Ltd
- 16.2.14.1. Overview
- 16.2.14.2. Products
- 16.2.14.3. SWOT Analysis
- 16.2.14.4. Recent Developments
- 16.2.14.5. Financials (Based on Availability)
- 16.2.1 Baker Hughes a GE Company LLC
List of Figures
- Figure 1: Global Fracking Chemicals Fluid Market Revenue Breakdown (Million, %) by Region 2024 & 2032
- Figure 2: Asia Pacific Fracking Chemicals Fluid Market Revenue (Million), by Country 2024 & 2032
- Figure 3: Asia Pacific Fracking Chemicals Fluid Market Revenue Share (%), by Country 2024 & 2032
- Figure 4: North America Fracking Chemicals Fluid Market Revenue (Million), by Country 2024 & 2032
- Figure 5: North America Fracking Chemicals Fluid Market Revenue Share (%), by Country 2024 & 2032
- Figure 6: Europe Fracking Chemicals Fluid Market Revenue (Million), by Country 2024 & 2032
- Figure 7: Europe Fracking Chemicals Fluid Market Revenue Share (%), by Country 2024 & 2032
- Figure 8: South America Fracking Chemicals Fluid Market Revenue (Million), by Country 2024 & 2032
- Figure 9: South America Fracking Chemicals Fluid Market Revenue Share (%), by Country 2024 & 2032
- Figure 10: Middle East and Africa Fracking Chemicals Fluid Market Revenue (Million), by Country 2024 & 2032
- Figure 11: Middle East and Africa Fracking Chemicals Fluid Market Revenue Share (%), by Country 2024 & 2032
- Figure 12: Asia Pacific Fracking Chemicals Fluid Market Revenue (Million), by Fluid Type 2024 & 2032
- Figure 13: Asia Pacific Fracking Chemicals Fluid Market Revenue Share (%), by Fluid Type 2024 & 2032
- Figure 14: Asia Pacific Fracking Chemicals Fluid Market Revenue (Million), by Product Type 2024 & 2032
- Figure 15: Asia Pacific Fracking Chemicals Fluid Market Revenue Share (%), by Product Type 2024 & 2032
- Figure 16: Asia Pacific Fracking Chemicals Fluid Market Revenue (Million), by Function 2024 & 2032
- Figure 17: Asia Pacific Fracking Chemicals Fluid Market Revenue Share (%), by Function 2024 & 2032
- Figure 18: Asia Pacific Fracking Chemicals Fluid Market Revenue (Million), by Application 2024 & 2032
- Figure 19: Asia Pacific Fracking Chemicals Fluid Market Revenue Share (%), by Application 2024 & 2032
- Figure 20: Asia Pacific Fracking Chemicals Fluid Market Revenue (Million), by Country 2024 & 2032
- Figure 21: Asia Pacific Fracking Chemicals Fluid Market Revenue Share (%), by Country 2024 & 2032
- Figure 22: North America Fracking Chemicals Fluid Market Revenue (Million), by Fluid Type 2024 & 2032
- Figure 23: North America Fracking Chemicals Fluid Market Revenue Share (%), by Fluid Type 2024 & 2032
- Figure 24: North America Fracking Chemicals Fluid Market Revenue (Million), by Product Type 2024 & 2032
- Figure 25: North America Fracking Chemicals Fluid Market Revenue Share (%), by Product Type 2024 & 2032
- Figure 26: North America Fracking Chemicals Fluid Market Revenue (Million), by Function 2024 & 2032
- Figure 27: North America Fracking Chemicals Fluid Market Revenue Share (%), by Function 2024 & 2032
- Figure 28: North America Fracking Chemicals Fluid Market Revenue (Million), by Application 2024 & 2032
- Figure 29: North America Fracking Chemicals Fluid Market Revenue Share (%), by Application 2024 & 2032
- Figure 30: North America Fracking Chemicals Fluid Market Revenue (Million), by Country 2024 & 2032
- Figure 31: North America Fracking Chemicals Fluid Market Revenue Share (%), by Country 2024 & 2032
- Figure 32: Europe Fracking Chemicals Fluid Market Revenue (Million), by Fluid Type 2024 & 2032
- Figure 33: Europe Fracking Chemicals Fluid Market Revenue Share (%), by Fluid Type 2024 & 2032
- Figure 34: Europe Fracking Chemicals Fluid Market Revenue (Million), by Product Type 2024 & 2032
- Figure 35: Europe Fracking Chemicals Fluid Market Revenue Share (%), by Product Type 2024 & 2032
- Figure 36: Europe Fracking Chemicals Fluid Market Revenue (Million), by Function 2024 & 2032
- Figure 37: Europe Fracking Chemicals Fluid Market Revenue Share (%), by Function 2024 & 2032
- Figure 38: Europe Fracking Chemicals Fluid Market Revenue (Million), by Application 2024 & 2032
- Figure 39: Europe Fracking Chemicals Fluid Market Revenue Share (%), by Application 2024 & 2032
- Figure 40: Europe Fracking Chemicals Fluid Market Revenue (Million), by Country 2024 & 2032
- Figure 41: Europe Fracking Chemicals Fluid Market Revenue Share (%), by Country 2024 & 2032
- Figure 42: South America Fracking Chemicals Fluid Market Revenue (Million), by Fluid Type 2024 & 2032
- Figure 43: South America Fracking Chemicals Fluid Market Revenue Share (%), by Fluid Type 2024 & 2032
- Figure 44: South America Fracking Chemicals Fluid Market Revenue (Million), by Product Type 2024 & 2032
- Figure 45: South America Fracking Chemicals Fluid Market Revenue Share (%), by Product Type 2024 & 2032
- Figure 46: South America Fracking Chemicals Fluid Market Revenue (Million), by Function 2024 & 2032
- Figure 47: South America Fracking Chemicals Fluid Market Revenue Share (%), by Function 2024 & 2032
- Figure 48: South America Fracking Chemicals Fluid Market Revenue (Million), by Application 2024 & 2032
- Figure 49: South America Fracking Chemicals Fluid Market Revenue Share (%), by Application 2024 & 2032
- Figure 50: South America Fracking Chemicals Fluid Market Revenue (Million), by Country 2024 & 2032
- Figure 51: South America Fracking Chemicals Fluid Market Revenue Share (%), by Country 2024 & 2032
- Figure 52: Middle East and Africa Fracking Chemicals Fluid Market Revenue (Million), by Fluid Type 2024 & 2032
- Figure 53: Middle East and Africa Fracking Chemicals Fluid Market Revenue Share (%), by Fluid Type 2024 & 2032
- Figure 54: Middle East and Africa Fracking Chemicals Fluid Market Revenue (Million), by Product Type 2024 & 2032
- Figure 55: Middle East and Africa Fracking Chemicals Fluid Market Revenue Share (%), by Product Type 2024 & 2032
- Figure 56: Middle East and Africa Fracking Chemicals Fluid Market Revenue (Million), by Function 2024 & 2032
- Figure 57: Middle East and Africa Fracking Chemicals Fluid Market Revenue Share (%), by Function 2024 & 2032
- Figure 58: Middle East and Africa Fracking Chemicals Fluid Market Revenue (Million), by Application 2024 & 2032
- Figure 59: Middle East and Africa Fracking Chemicals Fluid Market Revenue Share (%), by Application 2024 & 2032
- Figure 60: Middle East and Africa Fracking Chemicals Fluid Market Revenue (Million), by Country 2024 & 2032
- Figure 61: Middle East and Africa Fracking Chemicals Fluid Market Revenue Share (%), by Country 2024 & 2032
List of Tables
- Table 1: Global Fracking Chemicals Fluid Market Revenue Million Forecast, by Region 2019 & 2032
- Table 2: Global Fracking Chemicals Fluid Market Revenue Million Forecast, by Fluid Type 2019 & 2032
- Table 3: Global Fracking Chemicals Fluid Market Revenue Million Forecast, by Product Type 2019 & 2032
- Table 4: Global Fracking Chemicals Fluid Market Revenue Million Forecast, by Function 2019 & 2032
- Table 5: Global Fracking Chemicals Fluid Market Revenue Million Forecast, by Application 2019 & 2032
- Table 6: Global Fracking Chemicals Fluid Market Revenue Million Forecast, by Region 2019 & 2032
- Table 7: Global Fracking Chemicals Fluid Market Revenue Million Forecast, by Country 2019 & 2032
- Table 8: China Fracking Chemicals Fluid Market Revenue (Million) Forecast, by Application 2019 & 2032
- Table 9: India Fracking Chemicals Fluid Market Revenue (Million) Forecast, by Application 2019 & 2032
- Table 10: Japan Fracking Chemicals Fluid Market Revenue (Million) Forecast, by Application 2019 & 2032
- Table 11: South Korea Fracking Chemicals Fluid Market Revenue (Million) Forecast, by Application 2019 & 2032
- Table 12: Rest of Asia Pacific Fracking Chemicals Fluid Market Revenue (Million) Forecast, by Application 2019 & 2032
- Table 13: Global Fracking Chemicals Fluid Market Revenue Million Forecast, by Country 2019 & 2032
- Table 14: United States Fracking Chemicals Fluid Market Revenue (Million) Forecast, by Application 2019 & 2032
- Table 15: Canada Fracking Chemicals Fluid Market Revenue (Million) Forecast, by Application 2019 & 2032
- Table 16: Mexico Fracking Chemicals Fluid Market Revenue (Million) Forecast, by Application 2019 & 2032
- Table 17: Global Fracking Chemicals Fluid Market Revenue Million Forecast, by Country 2019 & 2032
- Table 18: Germany Fracking Chemicals Fluid Market Revenue (Million) Forecast, by Application 2019 & 2032
- Table 19: United Kingdom Fracking Chemicals Fluid Market Revenue (Million) Forecast, by Application 2019 & 2032
- Table 20: France Fracking Chemicals Fluid Market Revenue (Million) Forecast, by Application 2019 & 2032
- Table 21: Italy Fracking Chemicals Fluid Market Revenue (Million) Forecast, by Application 2019 & 2032
- Table 22: Rest of Europe Fracking Chemicals Fluid Market Revenue (Million) Forecast, by Application 2019 & 2032
- Table 23: Global Fracking Chemicals Fluid Market Revenue Million Forecast, by Country 2019 & 2032
- Table 24: Brazil Fracking Chemicals Fluid Market Revenue (Million) Forecast, by Application 2019 & 2032
- Table 25: Argentina Fracking Chemicals Fluid Market Revenue (Million) Forecast, by Application 2019 & 2032
- Table 26: Rest of South America Fracking Chemicals Fluid Market Revenue (Million) Forecast, by Application 2019 & 2032
- Table 27: Global Fracking Chemicals Fluid Market Revenue Million Forecast, by Country 2019 & 2032
- Table 28: Saudi Arabia Fracking Chemicals Fluid Market Revenue (Million) Forecast, by Application 2019 & 2032
- Table 29: South Africa Fracking Chemicals Fluid Market Revenue (Million) Forecast, by Application 2019 & 2032
- Table 30: Rest of Middle East and Africa Fracking Chemicals Fluid Market Revenue (Million) Forecast, by Application 2019 & 2032
- Table 31: Global Fracking Chemicals Fluid Market Revenue Million Forecast, by Fluid Type 2019 & 2032
- Table 32: Global Fracking Chemicals Fluid Market Revenue Million Forecast, by Product Type 2019 & 2032
- Table 33: Global Fracking Chemicals Fluid Market Revenue Million Forecast, by Function 2019 & 2032
- Table 34: Global Fracking Chemicals Fluid Market Revenue Million Forecast, by Application 2019 & 2032
- Table 35: Global Fracking Chemicals Fluid Market Revenue Million Forecast, by Country 2019 & 2032
- Table 36: China Fracking Chemicals Fluid Market Revenue (Million) Forecast, by Application 2019 & 2032
- Table 37: India Fracking Chemicals Fluid Market Revenue (Million) Forecast, by Application 2019 & 2032
- Table 38: Japan Fracking Chemicals Fluid Market Revenue (Million) Forecast, by Application 2019 & 2032
- Table 39: South Korea Fracking Chemicals Fluid Market Revenue (Million) Forecast, by Application 2019 & 2032
- Table 40: Rest of Asia Pacific Fracking Chemicals Fluid Market Revenue (Million) Forecast, by Application 2019 & 2032
- Table 41: Global Fracking Chemicals Fluid Market Revenue Million Forecast, by Fluid Type 2019 & 2032
- Table 42: Global Fracking Chemicals Fluid Market Revenue Million Forecast, by Product Type 2019 & 2032
- Table 43: Global Fracking Chemicals Fluid Market Revenue Million Forecast, by Function 2019 & 2032
- Table 44: Global Fracking Chemicals Fluid Market Revenue Million Forecast, by Application 2019 & 2032
- Table 45: Global Fracking Chemicals Fluid Market Revenue Million Forecast, by Country 2019 & 2032
- Table 46: United States Fracking Chemicals Fluid Market Revenue (Million) Forecast, by Application 2019 & 2032
- Table 47: Canada Fracking Chemicals Fluid Market Revenue (Million) Forecast, by Application 2019 & 2032
- Table 48: Mexico Fracking Chemicals Fluid Market Revenue (Million) Forecast, by Application 2019 & 2032
- Table 49: Global Fracking Chemicals Fluid Market Revenue Million Forecast, by Fluid Type 2019 & 2032
- Table 50: Global Fracking Chemicals Fluid Market Revenue Million Forecast, by Product Type 2019 & 2032
- Table 51: Global Fracking Chemicals Fluid Market Revenue Million Forecast, by Function 2019 & 2032
- Table 52: Global Fracking Chemicals Fluid Market Revenue Million Forecast, by Application 2019 & 2032
- Table 53: Global Fracking Chemicals Fluid Market Revenue Million Forecast, by Country 2019 & 2032
- Table 54: Germany Fracking Chemicals Fluid Market Revenue (Million) Forecast, by Application 2019 & 2032
- Table 55: United Kingdom Fracking Chemicals Fluid Market Revenue (Million) Forecast, by Application 2019 & 2032
- Table 56: France Fracking Chemicals Fluid Market Revenue (Million) Forecast, by Application 2019 & 2032
- Table 57: Italy Fracking Chemicals Fluid Market Revenue (Million) Forecast, by Application 2019 & 2032
- Table 58: Rest of Europe Fracking Chemicals Fluid Market Revenue (Million) Forecast, by Application 2019 & 2032
- Table 59: Global Fracking Chemicals Fluid Market Revenue Million Forecast, by Fluid Type 2019 & 2032
- Table 60: Global Fracking Chemicals Fluid Market Revenue Million Forecast, by Product Type 2019 & 2032
- Table 61: Global Fracking Chemicals Fluid Market Revenue Million Forecast, by Function 2019 & 2032
- Table 62: Global Fracking Chemicals Fluid Market Revenue Million Forecast, by Application 2019 & 2032
- Table 63: Global Fracking Chemicals Fluid Market Revenue Million Forecast, by Country 2019 & 2032
- Table 64: Brazil Fracking Chemicals Fluid Market Revenue (Million) Forecast, by Application 2019 & 2032
- Table 65: Argentina Fracking Chemicals Fluid Market Revenue (Million) Forecast, by Application 2019 & 2032
- Table 66: Rest of South America Fracking Chemicals Fluid Market Revenue (Million) Forecast, by Application 2019 & 2032
- Table 67: Global Fracking Chemicals Fluid Market Revenue Million Forecast, by Fluid Type 2019 & 2032
- Table 68: Global Fracking Chemicals Fluid Market Revenue Million Forecast, by Product Type 2019 & 2032
- Table 69: Global Fracking Chemicals Fluid Market Revenue Million Forecast, by Function 2019 & 2032
- Table 70: Global Fracking Chemicals Fluid Market Revenue Million Forecast, by Application 2019 & 2032
- Table 71: Global Fracking Chemicals Fluid Market Revenue Million Forecast, by Country 2019 & 2032
- Table 72: Saudi Arabia Fracking Chemicals Fluid Market Revenue (Million) Forecast, by Application 2019 & 2032
- Table 73: South Africa Fracking Chemicals Fluid Market Revenue (Million) Forecast, by Application 2019 & 2032
- Table 74: Rest of Middle East and Africa Fracking Chemicals Fluid Market Revenue (Million) Forecast, by Application 2019 & 2032
Frequently Asked Questions
1. What is the projected Compound Annual Growth Rate (CAGR) of the Fracking Chemicals Fluid Market?
The projected CAGR is approximately > 9.00%.
2. Which companies are prominent players in the Fracking Chemicals Fluid Market?
Key companies in the market include Baker Hughes a GE Company LLC, Clariant, FTS International, Ashland, BASF SE, Weatherford, DuPont, Dow, SNP Inc, Halliburton, Schlumberger Limited, Chevron PhillipsChemicalCompay*List Not Exhaustive, Albemarle Corporation, Calfrac Well Services Ltd.
3. What are the main segments of the Fracking Chemicals Fluid Market?
The market segments include Fluid Type, Product Type, Function, Application.
4. Can you provide details about the market size?
The market size is estimated to be USD XX Million as of 2022.
5. What are some drivers contributing to market growth?
; Growing Demand of Fracking Chemicals Fluid from Oil and Gas Industry; Other Drivers.
6. What are the notable trends driving market growth?
Growing Demand of Fracking Chemicals Fluid from Oil and Gas Industry.
7. Are there any restraints impacting market growth?
; Stringent Environmental and Governmental Regulations towards Fracking Fluids; Impact of COVID - 19.
8. Can you provide examples of recent developments in the market?
N/A
9. What pricing options are available for accessing the report?
Pricing options include single-user, multi-user, and enterprise licenses priced at USD 4750, USD 5250, and USD 8750 respectively.
10. Is the market size provided in terms of value or volume?
The market size is provided in terms of value, measured in Million.
11. Are there any specific market keywords associated with the report?
Yes, the market keyword associated with the report is "Fracking Chemicals Fluid Market," which aids in identifying and referencing the specific market segment covered.
12. How do I determine which pricing option suits my needs best?
The pricing options vary based on user requirements and access needs. Individual users may opt for single-user licenses, while businesses requiring broader access may choose multi-user or enterprise licenses for cost-effective access to the report.
13. Are there any additional resources or data provided in the Fracking Chemicals Fluid Market report?
While the report offers comprehensive insights, it's advisable to review the specific contents or supplementary materials provided to ascertain if additional resources or data are available.
14. How can I stay updated on further developments or reports in the Fracking Chemicals Fluid Market?
To stay informed about further developments, trends, and reports in the Fracking Chemicals Fluid Market, consider subscribing to industry newsletters, following relevant companies and organizations, or regularly checking reputable industry news sources and publications.
Methodology
Step 1 - Identification of Relevant Samples Size from Population Database


Step 2 - Approaches for Defining Global Market Size (Value, Volume* & Price*)

Note*: In applicable scenarios
Step 3 - Data Sources
Primary Research
- Web Analytics
- Survey Reports
- Research Institute
- Latest Research Reports
- Opinion Leaders
Secondary Research
- Annual Reports
- White Paper
- Latest Press Release
- Industry Association
- Paid Database
- Investor Presentations

Step 4 - Data Triangulation
Involves using different sources of information in order to increase the validity of a study
These sources are likely to be stakeholders in a program - participants, other researchers, program staff, other community members, and so on.
Then we put all data in single framework & apply various statistical tools to find out the dynamic on the market.
During the analysis stage, feedback from the stakeholder groups would be compared to determine areas of agreement as well as areas of divergence
