

Key Insights
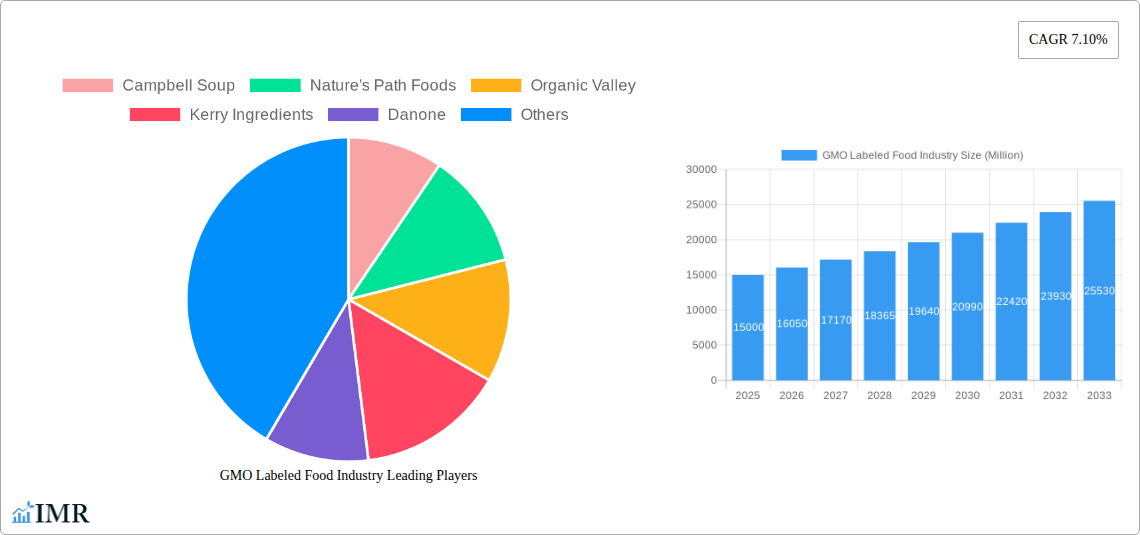
The GMO labeled food industry, while exhibiting a relatively stable growth trajectory with a Compound Annual Growth Rate (CAGR) of 7.10% from 2019-2024, faces a complex interplay of market drivers, trends, and restraints. Consumer demand for transparency and ethically sourced products is a significant driver, fueled by growing health consciousness and concerns about potential long-term health effects associated with genetically modified organisms (GMOs). This demand is further bolstered by increasing regulatory pressures in various regions, mandating clear GMO labeling on food products. However, the market is also constrained by the fluctuating prices of raw materials, the complexities of supply chain management for labeled products, and potential challenges in maintaining consistent consumer awareness and acceptance across different demographics and geographies. The processed food segment, encompassing a wide range of products from cereals to snacks, likely accounts for the largest market share, followed by meat & poultry and dairy. Supermarkets and hypermarkets remain the dominant distribution channel due to their wide reach and established infrastructure, though online retail is experiencing significant growth, reflecting evolving consumer shopping habits. Major players like Campbell Soup, General Mills, and Danone are strategically positioning themselves to capitalize on this growing market by investing in research, product development, and expanding their portfolios of GMO-labeled products.
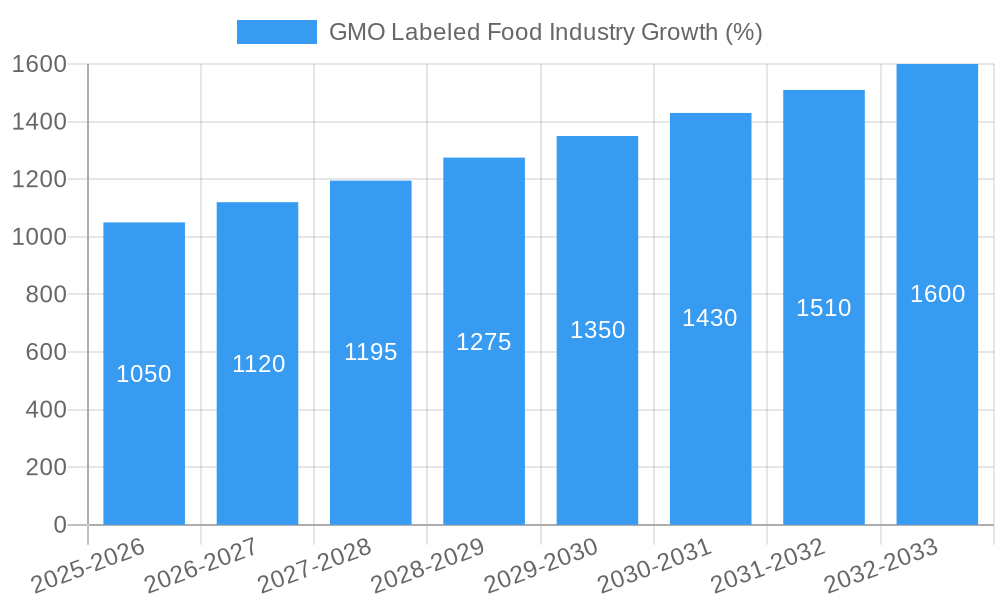
Looking ahead, the forecast period (2025-2033) suggests continued expansion, though the rate of growth may fluctuate depending on factors such as evolving consumer preferences, regulatory changes across different regions (e.g., potential variations in labeling requirements between North America and Europe), and advancements in genetic engineering technology. The Asia-Pacific region, with its large and growing population, holds significant potential for future growth, driven by increasing disposable incomes and rising awareness of food safety and quality. Companies are likely to focus on innovation, offering a wider variety of GMO-labeled products, exploring organic and sustainable farming practices, and actively communicating the benefits of their offerings to consumers to maintain market competitiveness and capitalize on this market's continued expansion.
GMO Labeled Food Industry Market Report: 2019-2033
This comprehensive report provides a detailed analysis of the GMO labeled food industry, offering invaluable insights for industry professionals, investors, and stakeholders. Covering the period from 2019 to 2033, with a focus on 2025, this report examines market dynamics, growth trends, regional performance, and key players, enabling informed strategic decision-making. The report segments the market by type (Processed Food, Meat & Poultry, Dairy, Beverage, Other Types) and distribution channel (Supermarket/Hypermarket, Convenience Stores, Specialist Stores, Online Retail Stores, Other Distribution Channels).
GMO Labeled Food Industry Market Dynamics & Structure
This section analyzes the competitive landscape of the GMO labeled food market, encompassing market concentration, technological advancements, regulatory landscapes, substitute products, end-user demographics, and merger & acquisition (M&A) activities. The analysis considers factors influencing market growth and challenges faced by industry players. The global GMO labeled food market size in 2024 is estimated at xx Million.
- Market Concentration: The market exhibits a moderately concentrated structure, with major players such as Campbell Soup, General Mills, and Kellogg Company holding significant market share. However, smaller niche players focusing on specific segments like organic and plant-based foods are also gaining traction. The top 5 players account for approximately xx% of the market share in 2024.
- Technological Innovation: Advancements in genetic engineering and labeling technologies continue to shape the market. However, innovation barriers like high R&D costs and stringent regulations pose challenges.
- Regulatory Frameworks: Varying governmental regulations across different countries regarding GMO labeling significantly impact market dynamics. Compliance costs and varying consumer acceptance levels based on regulations affect market growth.
- Competitive Product Substitutes: The growing popularity of organic and non-GMO products presents strong competition for GMO labeled foods. This intensifies competition and necessitates product differentiation.
- End-User Demographics: Consumer awareness and preferences regarding GMOs are crucial factors. Growing health consciousness and demand for transparency are driving demand for GMO labeled foods in specific demographics.
- M&A Trends: The industry has witnessed several M&A activities in recent years, primarily focused on expanding product portfolios and market reach. The number of M&A deals in the period 2019-2024 is estimated at xx.
GMO Labeled Food Industry Growth Trends & Insights
This section provides a detailed analysis of the GMO labeled food market's evolution, adoption rates, technological disruptions, and shifts in consumer behavior. It leverages comprehensive market data to provide a precise overview of market size, CAGR, and penetration rates. The global GMO labeled food market is projected to reach xx Million by 2033, exhibiting a CAGR of xx% during the forecast period (2025-2033).
The market is experiencing fluctuating growth influenced by consumer preferences and technological advancements. The rise of e-commerce platforms has also expanded the market's reach. Changing consumer habits, coupled with increased health awareness, fuel a significant demand for GMO-labeled food products. The adoption rate of GMO-labeled foods has steadily increased, particularly among health-conscious consumers and those seeking transparency. Technological disruptions such as improved genetic engineering techniques and advanced labeling technologies are driving innovation and expanding market segments.
Dominant Regions, Countries, or Segments in GMO Labeled Food Industry
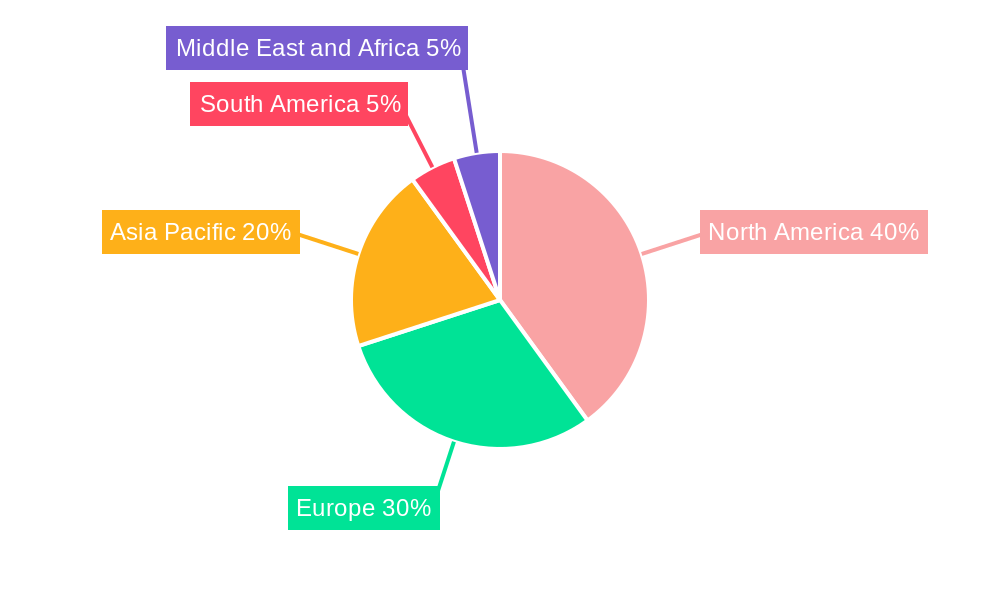
This section identifies the leading regions, countries, and segments within the GMO labeled food market, analyzing factors that drive their dominance. North America currently holds the largest market share, followed by Europe and Asia-Pacific.
- Dominant Regions: North America and Europe are the dominant regions, driven by higher consumer awareness of GMOs and stringent labeling regulations. Asia-Pacific is anticipated to experience significant growth due to rising disposable incomes and changing consumer preferences.
- Dominant Segments (Type): The Processed Food segment currently dominates the market due to the widespread consumption of processed foods. However, the Meat & Poultry segment is also witnessing considerable growth.
- Dominant Segments (Distribution Channel): Supermarket/Hypermarkets are the primary distribution channel, driven by their extensive reach and established supply chains. However, online retail stores are increasingly becoming significant distribution channels, especially for niche players.
- Key Drivers: Stringent regulatory frameworks in North America and Europe have pushed manufacturers towards clear GMO labeling, driving market growth. In contrast, growing consumer awareness and demand for transparency are fueling the expansion of the market in developing regions.
GMO Labeled Food Industry Product Landscape
The GMO labeled food industry offers a diverse range of products catering to various consumer preferences and dietary needs. Product innovation focuses on enhancing product quality, extending shelf life, and improving nutritional value. Technological advancements such as improved genetic engineering techniques and advanced labeling technologies are continuously improving product quality, creating new product applications, and enhancing the efficiency of the supply chain. Key innovations include the development of GMO-labeled foods with enhanced nutritional content and extended shelf life.
Key Drivers, Barriers & Challenges in GMO Labeled Food Industry
Key Drivers:
- Increasing consumer demand for transparency and traceability in food products.
- Stringent government regulations regarding GMO labeling in several countries.
- Growing health consciousness and awareness of the potential health impacts of GMOs.
- Rising demand for organic and non-GMO products, fostering increased competition and the demand for clear labeling.
Challenges and Restraints:
- The high cost of GMO labeling and compliance with stringent regulations.
- Negative perceptions and misconceptions surrounding GMOs among some consumers.
- Supply chain complexities and challenges in ensuring accurate GMO labeling across the entire supply chain. The impact of supply chain disruptions on accurate labeling has resulted in a xx% decrease in on-time delivery rates in 2024.
Emerging Opportunities in GMO Labeled Food Industry
- Expanding into untapped markets in developing countries with growing awareness of GMOs and health consciousness.
- Leveraging technological advancements to improve GMO labeling technologies and reduce costs.
- Developing innovative products with enhanced nutritional value and extended shelf life.
- Catering to specific dietary needs and preferences by offering GMO-labeled products tailored to these needs. The xx Million projected growth in the vegan food segment in 2025 represents a key opportunity.
Growth Accelerators in the GMO Labeled Food Industry
Technological breakthroughs in genetic engineering and labeling technologies are significantly accelerating market growth. Strategic partnerships between food manufacturers and technology providers are driving innovation. Expansion strategies focusing on emerging markets and product diversification are key drivers of long-term growth.
Key Players Shaping the GMO Labeled Food Industry Market
- Campbell Soup
- Nature's Path Foods
- Organic Valley
- Kerry Ingredients
- Danone
- Ingredion Incorporated
- Chipotle
- General Mills
- ConAgra Foods Inc
- Kellogg Company
Notable Milestones in GMO Labeled Food Industry Sector
- August 2021: Walmart launched a new line of great-value products with clear GMO or NON-GMO labeling.
- June 2022: Kellogg split into three independent companies, impacting the GMO labeled food market’s competitive landscape.
- February 2023: Danone invested USD 65 million in a new production line, enhancing its capacity for GMO-labeled products.
In-Depth GMO Labeled Food Industry Market Outlook
The GMO labeled food industry is poised for continued growth, driven by increasing consumer awareness, stringent regulations, and technological advancements. Strategic partnerships, product diversification, and expansion into emerging markets will create significant opportunities for market players. The continued focus on transparency and sustainability within the food industry presents a robust outlook for the GMO labeled food market for the foreseeable future.
GMO Labeled Food Industry Segmentation
-
1. Type
- 1.1. Processed Food
- 1.2. Meat & Poultry
- 1.3. Dairy
- 1.4. Beverage
- 1.5. Other Types
-
2. Distribution Channel
- 2.1. Supermarket/Hypermarket
- 2.2. Convenience Stores
- 2.3. Specialist Stores
- 2.4. Online Retail Stores
- 2.5. Other Distribution Channels
GMO Labeled Food Industry Segmentation By Geography
-
1. North America
- 1.1. United States
- 1.2. Canada
- 1.3. Mexico
- 1.4. Rest of North America
-
2. Europe
- 2.1. United Kingdom
- 2.2. Germany
- 2.3. France
- 2.4. Russia
- 2.5. Italy
- 2.6. Spain
- 2.7. Rest of Europe
-
3. Asia Pacific
- 3.1. India
- 3.2. China
- 3.3. Japan
- 3.4. Australia
- 3.5. Rest of Asia Pacific
-
4. South America
- 4.1. Brazil
- 4.2. Argentina
- 4.3. Rest of South America
- 5. Middle East
-
6. South Africa
- 6.1. United Arab of Emirates
- 6.2. Rest of Middle East
GMO Labeled Food Industry REPORT HIGHLIGHTS
| Aspects | Details |
|---|---|
| Study Period | 2019-2033 |
| Base Year | 2024 |
| Estimated Year | 2025 |
| Forecast Period | 2025-2033 |
| Historical Period | 2019-2024 |
| Growth Rate | CAGR of 7.10% from 2019-2033 |
| Segmentation |
|
Table of Contents
- 1. Introduction
- 1.1. Research Scope
- 1.2. Market Segmentation
- 1.3. Research Methodology
- 1.4. Definitions and Assumptions
- 2. Executive Summary
- 2.1. Introduction
- 3. Market Dynamics
- 3.1. Introduction
- 3.2. Market Drivers
- 3.2.1. Increased Application of Collagen in End-User Industry; Implementation of Business Strategies by Market Players
- 3.3. Market Restrains
- 3.3.1. Growing Inclination Toward Clean Label Products
- 3.4. Market Trends
- 3.4.1. Growing Consumer Awareness about labelling
- 4. Market Factor Analysis
- 4.1. Porters Five Forces
- 4.2. Supply/Value Chain
- 4.3. PESTEL analysis
- 4.4. Market Entropy
- 4.5. Patent/Trademark Analysis
- 5. Global GMO Labeled Food Industry Analysis, Insights and Forecast, 2019-2031
- 5.1. Market Analysis, Insights and Forecast - by Type
- 5.1.1. Processed Food
- 5.1.2. Meat & Poultry
- 5.1.3. Dairy
- 5.1.4. Beverage
- 5.1.5. Other Types
- 5.2. Market Analysis, Insights and Forecast - by Distribution Channel
- 5.2.1. Supermarket/Hypermarket
- 5.2.2. Convenience Stores
- 5.2.3. Specialist Stores
- 5.2.4. Online Retail Stores
- 5.2.5. Other Distribution Channels
- 5.3. Market Analysis, Insights and Forecast - by Region
- 5.3.1. North America
- 5.3.2. Europe
- 5.3.3. Asia Pacific
- 5.3.4. South America
- 5.3.5. Middle East
- 5.3.6. South Africa
- 5.1. Market Analysis, Insights and Forecast - by Type
- 6. North America GMO Labeled Food Industry Analysis, Insights and Forecast, 2019-2031
- 6.1. Market Analysis, Insights and Forecast - by Type
- 6.1.1. Processed Food
- 6.1.2. Meat & Poultry
- 6.1.3. Dairy
- 6.1.4. Beverage
- 6.1.5. Other Types
- 6.2. Market Analysis, Insights and Forecast - by Distribution Channel
- 6.2.1. Supermarket/Hypermarket
- 6.2.2. Convenience Stores
- 6.2.3. Specialist Stores
- 6.2.4. Online Retail Stores
- 6.2.5. Other Distribution Channels
- 6.1. Market Analysis, Insights and Forecast - by Type
- 7. Europe GMO Labeled Food Industry Analysis, Insights and Forecast, 2019-2031
- 7.1. Market Analysis, Insights and Forecast - by Type
- 7.1.1. Processed Food
- 7.1.2. Meat & Poultry
- 7.1.3. Dairy
- 7.1.4. Beverage
- 7.1.5. Other Types
- 7.2. Market Analysis, Insights and Forecast - by Distribution Channel
- 7.2.1. Supermarket/Hypermarket
- 7.2.2. Convenience Stores
- 7.2.3. Specialist Stores
- 7.2.4. Online Retail Stores
- 7.2.5. Other Distribution Channels
- 7.1. Market Analysis, Insights and Forecast - by Type
- 8. Asia Pacific GMO Labeled Food Industry Analysis, Insights and Forecast, 2019-2031
- 8.1. Market Analysis, Insights and Forecast - by Type
- 8.1.1. Processed Food
- 8.1.2. Meat & Poultry
- 8.1.3. Dairy
- 8.1.4. Beverage
- 8.1.5. Other Types
- 8.2. Market Analysis, Insights and Forecast - by Distribution Channel
- 8.2.1. Supermarket/Hypermarket
- 8.2.2. Convenience Stores
- 8.2.3. Specialist Stores
- 8.2.4. Online Retail Stores
- 8.2.5. Other Distribution Channels
- 8.1. Market Analysis, Insights and Forecast - by Type
- 9. South America GMO Labeled Food Industry Analysis, Insights and Forecast, 2019-2031
- 9.1. Market Analysis, Insights and Forecast - by Type
- 9.1.1. Processed Food
- 9.1.2. Meat & Poultry
- 9.1.3. Dairy
- 9.1.4. Beverage
- 9.1.5. Other Types
- 9.2. Market Analysis, Insights and Forecast - by Distribution Channel
- 9.2.1. Supermarket/Hypermarket
- 9.2.2. Convenience Stores
- 9.2.3. Specialist Stores
- 9.2.4. Online Retail Stores
- 9.2.5. Other Distribution Channels
- 9.1. Market Analysis, Insights and Forecast - by Type
- 10. Middle East GMO Labeled Food Industry Analysis, Insights and Forecast, 2019-2031
- 10.1. Market Analysis, Insights and Forecast - by Type
- 10.1.1. Processed Food
- 10.1.2. Meat & Poultry
- 10.1.3. Dairy
- 10.1.4. Beverage
- 10.1.5. Other Types
- 10.2. Market Analysis, Insights and Forecast - by Distribution Channel
- 10.2.1. Supermarket/Hypermarket
- 10.2.2. Convenience Stores
- 10.2.3. Specialist Stores
- 10.2.4. Online Retail Stores
- 10.2.5. Other Distribution Channels
- 10.1. Market Analysis, Insights and Forecast - by Type
- 11. South Africa GMO Labeled Food Industry Analysis, Insights and Forecast, 2019-2031
- 11.1. Market Analysis, Insights and Forecast - by Type
- 11.1.1. Processed Food
- 11.1.2. Meat & Poultry
- 11.1.3. Dairy
- 11.1.4. Beverage
- 11.1.5. Other Types
- 11.2. Market Analysis, Insights and Forecast - by Distribution Channel
- 11.2.1. Supermarket/Hypermarket
- 11.2.2. Convenience Stores
- 11.2.3. Specialist Stores
- 11.2.4. Online Retail Stores
- 11.2.5. Other Distribution Channels
- 11.1. Market Analysis, Insights and Forecast - by Type
- 12. North America GMO Labeled Food Industry Analysis, Insights and Forecast, 2019-2031
- 12.1. Market Analysis, Insights and Forecast - By Country/Sub-region
- 12.1.1 United States
- 12.1.2 Canada
- 12.1.3 Mexico
- 12.1.4 Rest of North America
- 13. Europe GMO Labeled Food Industry Analysis, Insights and Forecast, 2019-2031
- 13.1. Market Analysis, Insights and Forecast - By Country/Sub-region
- 13.1.1 United Kingdom
- 13.1.2 Germany
- 13.1.3 France
- 13.1.4 Russia
- 13.1.5 Italy
- 13.1.6 Spain
- 13.1.7 Rest of Europe
- 14. Asia Pacific GMO Labeled Food Industry Analysis, Insights and Forecast, 2019-2031
- 14.1. Market Analysis, Insights and Forecast - By Country/Sub-region
- 14.1.1 India
- 14.1.2 China
- 14.1.3 Japan
- 14.1.4 Australia
- 14.1.5 Rest of Asia Pacific
- 15. South America GMO Labeled Food Industry Analysis, Insights and Forecast, 2019-2031
- 15.1. Market Analysis, Insights and Forecast - By Country/Sub-region
- 15.1.1 Brazil
- 15.1.2 Argentina
- 15.1.3 Rest of South America
- 16. Middle East and Africa GMO Labeled Food Industry Analysis, Insights and Forecast, 2019-2031
- 16.1. Market Analysis, Insights and Forecast - By Country/Sub-region
- 16.1.1 South Africa
- 16.1.2 United Arab Emirates
- 16.1.3 Rest of Middle East and Africa
- 17. Competitive Analysis
- 17.1. Global Market Share Analysis 2024
- 17.2. Company Profiles
- 17.2.1 Campbell Soup
- 17.2.1.1. Overview
- 17.2.1.2. Products
- 17.2.1.3. SWOT Analysis
- 17.2.1.4. Recent Developments
- 17.2.1.5. Financials (Based on Availability)
- 17.2.2 Nature's Path Foods
- 17.2.2.1. Overview
- 17.2.2.2. Products
- 17.2.2.3. SWOT Analysis
- 17.2.2.4. Recent Developments
- 17.2.2.5. Financials (Based on Availability)
- 17.2.3 Organic Valley
- 17.2.3.1. Overview
- 17.2.3.2. Products
- 17.2.3.3. SWOT Analysis
- 17.2.3.4. Recent Developments
- 17.2.3.5. Financials (Based on Availability)
- 17.2.4 Kerry Ingredients
- 17.2.4.1. Overview
- 17.2.4.2. Products
- 17.2.4.3. SWOT Analysis
- 17.2.4.4. Recent Developments
- 17.2.4.5. Financials (Based on Availability)
- 17.2.5 Danone
- 17.2.5.1. Overview
- 17.2.5.2. Products
- 17.2.5.3. SWOT Analysis
- 17.2.5.4. Recent Developments
- 17.2.5.5. Financials (Based on Availability)
- 17.2.6 Ingredion Incorporated
- 17.2.6.1. Overview
- 17.2.6.2. Products
- 17.2.6.3. SWOT Analysis
- 17.2.6.4. Recent Developments
- 17.2.6.5. Financials (Based on Availability)
- 17.2.7 Chipotle
- 17.2.7.1. Overview
- 17.2.7.2. Products
- 17.2.7.3. SWOT Analysis
- 17.2.7.4. Recent Developments
- 17.2.7.5. Financials (Based on Availability)
- 17.2.8 General Mills
- 17.2.8.1. Overview
- 17.2.8.2. Products
- 17.2.8.3. SWOT Analysis
- 17.2.8.4. Recent Developments
- 17.2.8.5. Financials (Based on Availability)
- 17.2.9 ConAgra Foods Inc
- 17.2.9.1. Overview
- 17.2.9.2. Products
- 17.2.9.3. SWOT Analysis
- 17.2.9.4. Recent Developments
- 17.2.9.5. Financials (Based on Availability)
- 17.2.10 Kellogg Company
- 17.2.10.1. Overview
- 17.2.10.2. Products
- 17.2.10.3. SWOT Analysis
- 17.2.10.4. Recent Developments
- 17.2.10.5. Financials (Based on Availability)
- 17.2.1 Campbell Soup
List of Figures
- Figure 1: Global GMO Labeled Food Industry Revenue Breakdown (Million, %) by Region 2024 & 2032
- Figure 2: North America GMO Labeled Food Industry Revenue (Million), by Country 2024 & 2032
- Figure 3: North America GMO Labeled Food Industry Revenue Share (%), by Country 2024 & 2032
- Figure 4: Europe GMO Labeled Food Industry Revenue (Million), by Country 2024 & 2032
- Figure 5: Europe GMO Labeled Food Industry Revenue Share (%), by Country 2024 & 2032
- Figure 6: Asia Pacific GMO Labeled Food Industry Revenue (Million), by Country 2024 & 2032
- Figure 7: Asia Pacific GMO Labeled Food Industry Revenue Share (%), by Country 2024 & 2032
- Figure 8: South America GMO Labeled Food Industry Revenue (Million), by Country 2024 & 2032
- Figure 9: South America GMO Labeled Food Industry Revenue Share (%), by Country 2024 & 2032
- Figure 10: Middle East and Africa GMO Labeled Food Industry Revenue (Million), by Country 2024 & 2032
- Figure 11: Middle East and Africa GMO Labeled Food Industry Revenue Share (%), by Country 2024 & 2032
- Figure 12: North America GMO Labeled Food Industry Revenue (Million), by Type 2024 & 2032
- Figure 13: North America GMO Labeled Food Industry Revenue Share (%), by Type 2024 & 2032
- Figure 14: North America GMO Labeled Food Industry Revenue (Million), by Distribution Channel 2024 & 2032
- Figure 15: North America GMO Labeled Food Industry Revenue Share (%), by Distribution Channel 2024 & 2032
- Figure 16: North America GMO Labeled Food Industry Revenue (Million), by Country 2024 & 2032
- Figure 17: North America GMO Labeled Food Industry Revenue Share (%), by Country 2024 & 2032
- Figure 18: Europe GMO Labeled Food Industry Revenue (Million), by Type 2024 & 2032
- Figure 19: Europe GMO Labeled Food Industry Revenue Share (%), by Type 2024 & 2032
- Figure 20: Europe GMO Labeled Food Industry Revenue (Million), by Distribution Channel 2024 & 2032
- Figure 21: Europe GMO Labeled Food Industry Revenue Share (%), by Distribution Channel 2024 & 2032
- Figure 22: Europe GMO Labeled Food Industry Revenue (Million), by Country 2024 & 2032
- Figure 23: Europe GMO Labeled Food Industry Revenue Share (%), by Country 2024 & 2032
- Figure 24: Asia Pacific GMO Labeled Food Industry Revenue (Million), by Type 2024 & 2032
- Figure 25: Asia Pacific GMO Labeled Food Industry Revenue Share (%), by Type 2024 & 2032
- Figure 26: Asia Pacific GMO Labeled Food Industry Revenue (Million), by Distribution Channel 2024 & 2032
- Figure 27: Asia Pacific GMO Labeled Food Industry Revenue Share (%), by Distribution Channel 2024 & 2032
- Figure 28: Asia Pacific GMO Labeled Food Industry Revenue (Million), by Country 2024 & 2032
- Figure 29: Asia Pacific GMO Labeled Food Industry Revenue Share (%), by Country 2024 & 2032
- Figure 30: South America GMO Labeled Food Industry Revenue (Million), by Type 2024 & 2032
- Figure 31: South America GMO Labeled Food Industry Revenue Share (%), by Type 2024 & 2032
- Figure 32: South America GMO Labeled Food Industry Revenue (Million), by Distribution Channel 2024 & 2032
- Figure 33: South America GMO Labeled Food Industry Revenue Share (%), by Distribution Channel 2024 & 2032
- Figure 34: South America GMO Labeled Food Industry Revenue (Million), by Country 2024 & 2032
- Figure 35: South America GMO Labeled Food Industry Revenue Share (%), by Country 2024 & 2032
- Figure 36: Middle East GMO Labeled Food Industry Revenue (Million), by Type 2024 & 2032
- Figure 37: Middle East GMO Labeled Food Industry Revenue Share (%), by Type 2024 & 2032
- Figure 38: Middle East GMO Labeled Food Industry Revenue (Million), by Distribution Channel 2024 & 2032
- Figure 39: Middle East GMO Labeled Food Industry Revenue Share (%), by Distribution Channel 2024 & 2032
- Figure 40: Middle East GMO Labeled Food Industry Revenue (Million), by Country 2024 & 2032
- Figure 41: Middle East GMO Labeled Food Industry Revenue Share (%), by Country 2024 & 2032
- Figure 42: South Africa GMO Labeled Food Industry Revenue (Million), by Type 2024 & 2032
- Figure 43: South Africa GMO Labeled Food Industry Revenue Share (%), by Type 2024 & 2032
- Figure 44: South Africa GMO Labeled Food Industry Revenue (Million), by Distribution Channel 2024 & 2032
- Figure 45: South Africa GMO Labeled Food Industry Revenue Share (%), by Distribution Channel 2024 & 2032
- Figure 46: South Africa GMO Labeled Food Industry Revenue (Million), by Country 2024 & 2032
- Figure 47: South Africa GMO Labeled Food Industry Revenue Share (%), by Country 2024 & 2032
List of Tables
- Table 1: Global GMO Labeled Food Industry Revenue Million Forecast, by Region 2019 & 2032
- Table 2: Global GMO Labeled Food Industry Revenue Million Forecast, by Type 2019 & 2032
- Table 3: Global GMO Labeled Food Industry Revenue Million Forecast, by Distribution Channel 2019 & 2032
- Table 4: Global GMO Labeled Food Industry Revenue Million Forecast, by Region 2019 & 2032
- Table 5: Global GMO Labeled Food Industry Revenue Million Forecast, by Country 2019 & 2032
- Table 6: United States GMO Labeled Food Industry Revenue (Million) Forecast, by Application 2019 & 2032
- Table 7: Canada GMO Labeled Food Industry Revenue (Million) Forecast, by Application 2019 & 2032
- Table 8: Mexico GMO Labeled Food Industry Revenue (Million) Forecast, by Application 2019 & 2032
- Table 9: Rest of North America GMO Labeled Food Industry Revenue (Million) Forecast, by Application 2019 & 2032
- Table 10: Global GMO Labeled Food Industry Revenue Million Forecast, by Country 2019 & 2032
- Table 11: United Kingdom GMO Labeled Food Industry Revenue (Million) Forecast, by Application 2019 & 2032
- Table 12: Germany GMO Labeled Food Industry Revenue (Million) Forecast, by Application 2019 & 2032
- Table 13: France GMO Labeled Food Industry Revenue (Million) Forecast, by Application 2019 & 2032
- Table 14: Russia GMO Labeled Food Industry Revenue (Million) Forecast, by Application 2019 & 2032
- Table 15: Italy GMO Labeled Food Industry Revenue (Million) Forecast, by Application 2019 & 2032
- Table 16: Spain GMO Labeled Food Industry Revenue (Million) Forecast, by Application 2019 & 2032
- Table 17: Rest of Europe GMO Labeled Food Industry Revenue (Million) Forecast, by Application 2019 & 2032
- Table 18: Global GMO Labeled Food Industry Revenue Million Forecast, by Country 2019 & 2032
- Table 19: India GMO Labeled Food Industry Revenue (Million) Forecast, by Application 2019 & 2032
- Table 20: China GMO Labeled Food Industry Revenue (Million) Forecast, by Application 2019 & 2032
- Table 21: Japan GMO Labeled Food Industry Revenue (Million) Forecast, by Application 2019 & 2032
- Table 22: Australia GMO Labeled Food Industry Revenue (Million) Forecast, by Application 2019 & 2032
- Table 23: Rest of Asia Pacific GMO Labeled Food Industry Revenue (Million) Forecast, by Application 2019 & 2032
- Table 24: Global GMO Labeled Food Industry Revenue Million Forecast, by Country 2019 & 2032
- Table 25: Brazil GMO Labeled Food Industry Revenue (Million) Forecast, by Application 2019 & 2032
- Table 26: Argentina GMO Labeled Food Industry Revenue (Million) Forecast, by Application 2019 & 2032
- Table 27: Rest of South America GMO Labeled Food Industry Revenue (Million) Forecast, by Application 2019 & 2032
- Table 28: Global GMO Labeled Food Industry Revenue Million Forecast, by Country 2019 & 2032
- Table 29: South Africa GMO Labeled Food Industry Revenue (Million) Forecast, by Application 2019 & 2032
- Table 30: United Arab Emirates GMO Labeled Food Industry Revenue (Million) Forecast, by Application 2019 & 2032
- Table 31: Rest of Middle East and Africa GMO Labeled Food Industry Revenue (Million) Forecast, by Application 2019 & 2032
- Table 32: Global GMO Labeled Food Industry Revenue Million Forecast, by Type 2019 & 2032
- Table 33: Global GMO Labeled Food Industry Revenue Million Forecast, by Distribution Channel 2019 & 2032
- Table 34: Global GMO Labeled Food Industry Revenue Million Forecast, by Country 2019 & 2032
- Table 35: United States GMO Labeled Food Industry Revenue (Million) Forecast, by Application 2019 & 2032
- Table 36: Canada GMO Labeled Food Industry Revenue (Million) Forecast, by Application 2019 & 2032
- Table 37: Mexico GMO Labeled Food Industry Revenue (Million) Forecast, by Application 2019 & 2032
- Table 38: Rest of North America GMO Labeled Food Industry Revenue (Million) Forecast, by Application 2019 & 2032
- Table 39: Global GMO Labeled Food Industry Revenue Million Forecast, by Type 2019 & 2032
- Table 40: Global GMO Labeled Food Industry Revenue Million Forecast, by Distribution Channel 2019 & 2032
- Table 41: Global GMO Labeled Food Industry Revenue Million Forecast, by Country 2019 & 2032
- Table 42: United Kingdom GMO Labeled Food Industry Revenue (Million) Forecast, by Application 2019 & 2032
- Table 43: Germany GMO Labeled Food Industry Revenue (Million) Forecast, by Application 2019 & 2032
- Table 44: France GMO Labeled Food Industry Revenue (Million) Forecast, by Application 2019 & 2032
- Table 45: Russia GMO Labeled Food Industry Revenue (Million) Forecast, by Application 2019 & 2032
- Table 46: Italy GMO Labeled Food Industry Revenue (Million) Forecast, by Application 2019 & 2032
- Table 47: Spain GMO Labeled Food Industry Revenue (Million) Forecast, by Application 2019 & 2032
- Table 48: Rest of Europe GMO Labeled Food Industry Revenue (Million) Forecast, by Application 2019 & 2032
- Table 49: Global GMO Labeled Food Industry Revenue Million Forecast, by Type 2019 & 2032
- Table 50: Global GMO Labeled Food Industry Revenue Million Forecast, by Distribution Channel 2019 & 2032
- Table 51: Global GMO Labeled Food Industry Revenue Million Forecast, by Country 2019 & 2032
- Table 52: India GMO Labeled Food Industry Revenue (Million) Forecast, by Application 2019 & 2032
- Table 53: China GMO Labeled Food Industry Revenue (Million) Forecast, by Application 2019 & 2032
- Table 54: Japan GMO Labeled Food Industry Revenue (Million) Forecast, by Application 2019 & 2032
- Table 55: Australia GMO Labeled Food Industry Revenue (Million) Forecast, by Application 2019 & 2032
- Table 56: Rest of Asia Pacific GMO Labeled Food Industry Revenue (Million) Forecast, by Application 2019 & 2032
- Table 57: Global GMO Labeled Food Industry Revenue Million Forecast, by Type 2019 & 2032
- Table 58: Global GMO Labeled Food Industry Revenue Million Forecast, by Distribution Channel 2019 & 2032
- Table 59: Global GMO Labeled Food Industry Revenue Million Forecast, by Country 2019 & 2032
- Table 60: Brazil GMO Labeled Food Industry Revenue (Million) Forecast, by Application 2019 & 2032
- Table 61: Argentina GMO Labeled Food Industry Revenue (Million) Forecast, by Application 2019 & 2032
- Table 62: Rest of South America GMO Labeled Food Industry Revenue (Million) Forecast, by Application 2019 & 2032
- Table 63: Global GMO Labeled Food Industry Revenue Million Forecast, by Type 2019 & 2032
- Table 64: Global GMO Labeled Food Industry Revenue Million Forecast, by Distribution Channel 2019 & 2032
- Table 65: Global GMO Labeled Food Industry Revenue Million Forecast, by Country 2019 & 2032
- Table 66: Global GMO Labeled Food Industry Revenue Million Forecast, by Type 2019 & 2032
- Table 67: Global GMO Labeled Food Industry Revenue Million Forecast, by Distribution Channel 2019 & 2032
- Table 68: Global GMO Labeled Food Industry Revenue Million Forecast, by Country 2019 & 2032
- Table 69: United Arab of Emirates GMO Labeled Food Industry Revenue (Million) Forecast, by Application 2019 & 2032
- Table 70: Rest of Middle East GMO Labeled Food Industry Revenue (Million) Forecast, by Application 2019 & 2032
Frequently Asked Questions
1. What is the projected Compound Annual Growth Rate (CAGR) of the GMO Labeled Food Industry?
The projected CAGR is approximately 7.10%.
2. Which companies are prominent players in the GMO Labeled Food Industry?
Key companies in the market include Campbell Soup, Nature's Path Foods, Organic Valley, Kerry Ingredients, Danone, Ingredion Incorporated, Chipotle, General Mills, ConAgra Foods Inc, Kellogg Company.
3. What are the main segments of the GMO Labeled Food Industry?
The market segments include Type, Distribution Channel.
4. Can you provide details about the market size?
The market size is estimated to be USD XX Million as of 2022.
5. What are some drivers contributing to market growth?
Increased Application of Collagen in End-User Industry; Implementation of Business Strategies by Market Players.
6. What are the notable trends driving market growth?
Growing Consumer Awareness about labelling.
7. Are there any restraints impacting market growth?
Growing Inclination Toward Clean Label Products.
8. Can you provide examples of recent developments in the market?
February 2023: Danone, a leading food and beverage company, announced it would invest up to USD 65 million over the next two years to create a new production line in Jacksonville, Florida. The investment will support Danone North America's long-term growth strategy and deliver key benefits across the U.S. business, including advancing operational excellence, accelerating the company's sustainability goals, and driving cost efficiencies.
9. What pricing options are available for accessing the report?
Pricing options include single-user, multi-user, and enterprise licenses priced at USD 4750, USD 5250, and USD 8750 respectively.
10. Is the market size provided in terms of value or volume?
The market size is provided in terms of value, measured in Million.
11. Are there any specific market keywords associated with the report?
Yes, the market keyword associated with the report is "GMO Labeled Food Industry," which aids in identifying and referencing the specific market segment covered.
12. How do I determine which pricing option suits my needs best?
The pricing options vary based on user requirements and access needs. Individual users may opt for single-user licenses, while businesses requiring broader access may choose multi-user or enterprise licenses for cost-effective access to the report.
13. Are there any additional resources or data provided in the GMO Labeled Food Industry report?
While the report offers comprehensive insights, it's advisable to review the specific contents or supplementary materials provided to ascertain if additional resources or data are available.
14. How can I stay updated on further developments or reports in the GMO Labeled Food Industry?
To stay informed about further developments, trends, and reports in the GMO Labeled Food Industry, consider subscribing to industry newsletters, following relevant companies and organizations, or regularly checking reputable industry news sources and publications.
Methodology
Step 1 - Identification of Relevant Samples Size from Population Database


Step 2 - Approaches for Defining Global Market Size (Value, Volume* & Price*)

Note*: In applicable scenarios
Step 3 - Data Sources
Primary Research
- Web Analytics
- Survey Reports
- Research Institute
- Latest Research Reports
- Opinion Leaders
Secondary Research
- Annual Reports
- White Paper
- Latest Press Release
- Industry Association
- Paid Database
- Investor Presentations

Step 4 - Data Triangulation
Involves using different sources of information in order to increase the validity of a study
These sources are likely to be stakeholders in a program - participants, other researchers, program staff, other community members, and so on.
Then we put all data in single framework & apply various statistical tools to find out the dynamic on the market.
During the analysis stage, feedback from the stakeholder groups would be compared to determine areas of agreement as well as areas of divergence
