

Key Insights
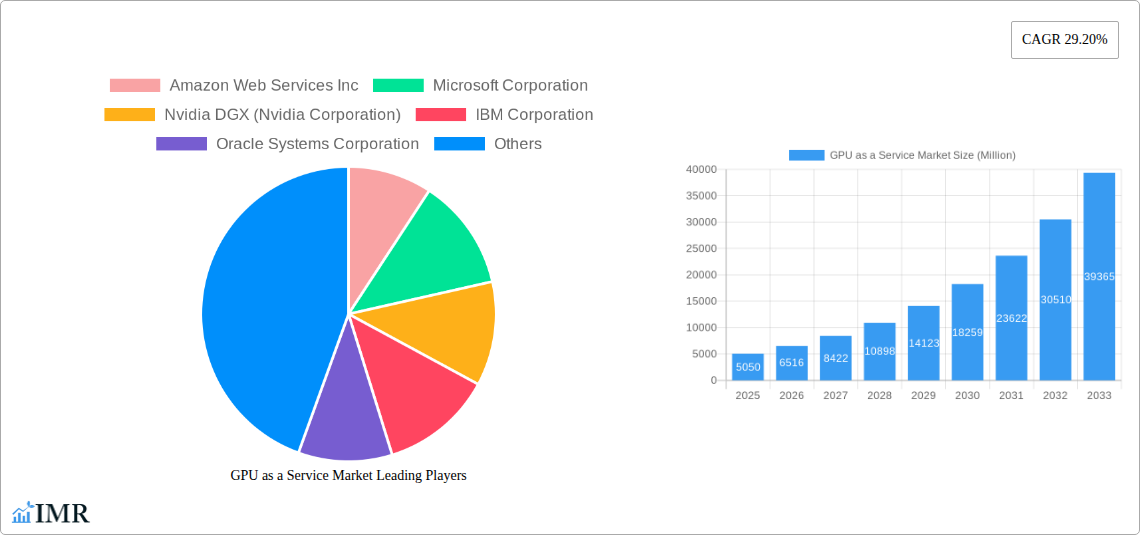
The GPU-as-a-Service (GaaS) market is experiencing explosive growth, projected to reach $5.05 billion in 2025 and maintain a robust Compound Annual Growth Rate (CAGR) of 29.20% from 2025 to 2033. This surge is driven by several key factors. The increasing demand for high-performance computing (HPC) across diverse sectors, including artificial intelligence (AI), machine learning (ML), deep learning, and big data analytics, fuels the need for readily accessible and scalable GPU resources. Businesses are increasingly opting for GaaS to avoid the high upfront costs and complex management associated with owning and maintaining their own GPU infrastructure. Cloud providers like Amazon Web Services (AWS), Microsoft Azure, and Google Cloud Platform (GCP) are major players, offering a wide range of GPU instances tailored to specific workloads, further driving market expansion. Furthermore, advancements in GPU technology and the emergence of specialized AI accelerators are enhancing the capabilities and efficiency of GaaS offerings, attracting a broader range of users. The accessibility and scalability of GaaS are lowering the barrier to entry for smaller companies and researchers, fostering innovation and accelerating the development of AI-driven applications.
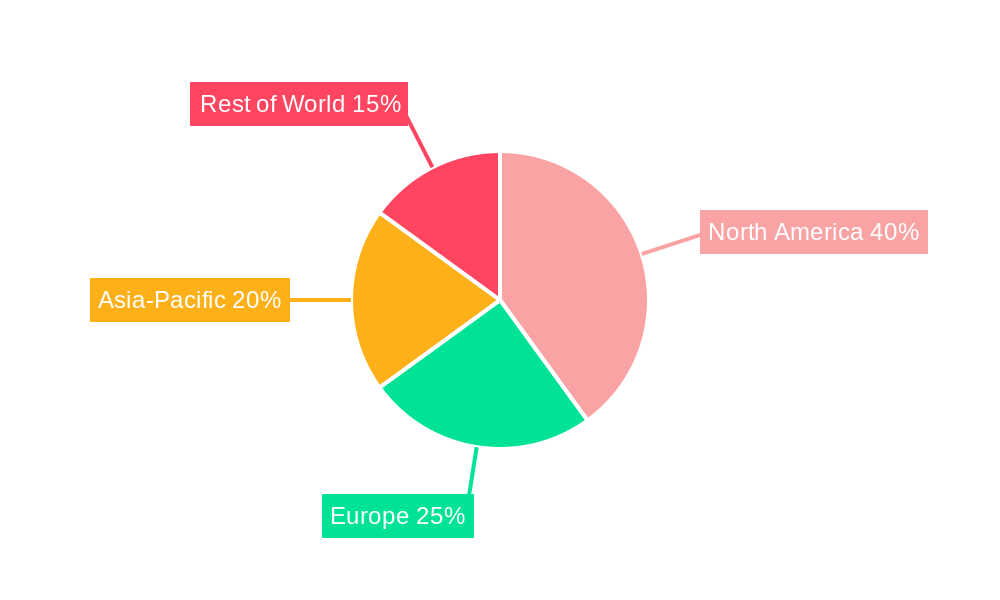
The competitive landscape is dynamic, with established tech giants like AWS, Microsoft, Nvidia, IBM, and Oracle vying for market share alongside emerging providers like CoreWeave and smaller cloud services. The market's growth is anticipated to be regionally diverse, with North America and Europe likely holding significant shares, driven by robust technological adoption and a concentrated presence of key players. However, Asia-Pacific is projected to witness rapid growth due to increasing digitalization and government initiatives promoting AI and cloud computing. While the market faces potential restraints like security concerns and potential latency issues depending on geographical location and network infrastructure, the overall trajectory points towards sustained and significant expansion throughout the forecast period. The growing reliance on cloud-based solutions and the ongoing evolution of AI applications will continue to be the major catalysts for this market's phenomenal growth.
GPU as a Service Market: A Comprehensive Report (2019-2033)
This comprehensive report provides an in-depth analysis of the GPU as a Service market, encompassing market dynamics, growth trends, regional segmentation, product landscape, key players, and future outlook. The study period covers 2019-2033, with 2025 as the base year and a forecast period of 2025-2033. The report utilizes both quantitative and qualitative data to offer a holistic view of this rapidly evolving market. The total market size in 2025 is estimated at xx Million.
GPU as a Service Market Market Dynamics & Structure
The GPU as a Service market is characterized by a moderately concentrated landscape, with key players like Amazon Web Services, Microsoft, and Nvidia holding significant market share. However, the market is also witnessing the emergence of several smaller players, fostering competition. Technological innovation, particularly in AI and high-performance computing, is a primary driver, fueling demand for sophisticated GPU-based solutions. Regulatory frameworks surrounding data privacy and security are increasingly influencing market dynamics, creating both opportunities and challenges. The market also faces competition from alternative computing architectures and on-premise solutions. M&A activity in the sector has been moderate, with xx deals recorded in the historical period (2019-2024), reflecting strategic efforts to expand capabilities and market reach.
- Market Concentration: Moderately concentrated, with top 3 players holding approximately xx% market share in 2025.
- Technological Innovation: Driven by advancements in AI, machine learning, and high-performance computing.
- Regulatory Framework: Compliance with data privacy regulations (e.g., GDPR, CCPA) significantly impacts market operations.
- Competitive Substitutes: On-premise solutions and alternative computing architectures present competitive pressure.
- End-User Demographics: Primarily driven by enterprises, research institutions, and AI/ML developers.
- M&A Trends: Moderate activity (xx deals in 2019-2024), reflecting consolidation and expansion strategies.
GPU as a Service Market Growth Trends & Insights
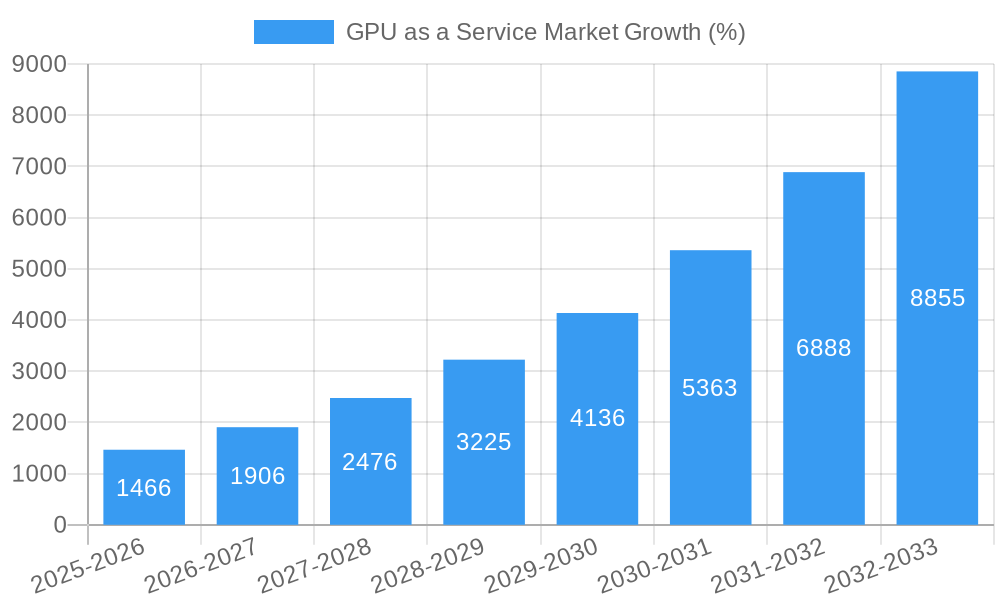
The GPU as a Service market has witnessed significant growth during the historical period (2019-2024), expanding at a CAGR of xx%. This growth trajectory is expected to continue, driven by increased adoption of cloud computing, the rise of AI and machine learning applications, and the need for scalable computing resources. The market is experiencing a shift towards specialized GPUs optimized for specific workloads, leading to improved performance and efficiency. Consumer behavior is increasingly leaning toward pay-as-you-go models, fostering the demand for flexible and cost-effective GPU-as-a-service solutions. Technological disruptions, such as advancements in network technologies and improved GPU virtualization, are further accelerating market growth. By 2033, the market is projected to reach xx Million, with a projected CAGR of xx% during the forecast period (2025-2033). Market penetration is expected to increase from xx% in 2025 to xx% in 2033.
Dominant Regions, Countries, or Segments in GPU as a Service Market
North America currently dominates the GPU as a Service market, owing to the strong presence of major cloud providers, robust technological infrastructure, and high adoption rates across various industries. The region's advanced technological ecosystem and substantial investments in research and development further contribute to its dominance. However, Asia-Pacific is projected to experience the fastest growth rate during the forecast period, propelled by increasing government initiatives, rising investment in AI and digital transformation, and a growing pool of skilled professionals.
- Key Drivers in North America: Strong presence of major cloud providers, advanced technological infrastructure, high adoption rates.
- Key Drivers in Asia-Pacific: Government initiatives promoting digitalization, rising investments in AI, growing skilled workforce.
- Market Share: North America holds approximately xx% of the market share in 2025, while Asia-Pacific is expected to reach xx% by 2033.
GPU as a Service Market Product Landscape
The GPU as a Service market offers a diverse range of products, including virtual machines with varying GPU configurations, specialized instances optimized for specific workloads (e.g., deep learning, high-performance computing), and managed services that simplify GPU deployment and management. These products are characterized by high performance, scalability, and cost-effectiveness. Continuous technological advancements are leading to the introduction of more powerful and energy-efficient GPUs, enhanced virtualization capabilities, and improved management tools. Unique selling propositions include flexible pricing models, enhanced security features, and seamless integration with other cloud services.
Key Drivers, Barriers & Challenges in GPU as a Service Market
Key Drivers:
- The rising adoption of AI and machine learning is driving the demand for high-performance computing capabilities.
- The increasing popularity of cloud computing provides a readily accessible platform for GPU-based services.
- Advancements in GPU technology are constantly improving performance and efficiency.
Key Challenges:
- Supply chain disruptions can impact the availability of GPUs, leading to price fluctuations and service limitations. This has a quantifiable impact, potentially reducing the market growth by approximately xx% in certain scenarios.
- Stringent data privacy regulations increase compliance costs and complexity for providers.
- Competition from on-premise solutions and alternative computing architectures continues to pressure the market.
Emerging Opportunities in GPU as a Service Market
The market presents significant opportunities in edge computing, enabling real-time processing of data at the point of origin. Furthermore, the growing demand for specialized GPUs tailored to specific applications, such as autonomous vehicles and medical imaging, opens new avenues for growth. Expansion into untapped markets, like smaller businesses and individual developers, represents a substantial growth potential. The increasing use of GPU computing in fields such as genomics and drug discovery also creates significant opportunities for the industry.
Growth Accelerators in the GPU as a Service Market Industry
Technological breakthroughs in GPU architecture and interconnectivity are consistently improving the performance and efficiency of GPU-as-a-service offerings. Strategic partnerships between cloud providers and GPU manufacturers are accelerating innovation and market penetration. Expansion into new geographic markets, particularly in developing economies, holds significant potential for long-term growth.
Key Players Shaping the GPU as a Service Market Market
- Amazon Web Services Inc
- Microsoft Corporation
- Nvidia DGX (Nvidia Corporation)
- IBM Corporation
- Oracle Systems Corporation
- Alphabet Inc (Google)
- Latitude sh
- Seeweb
- Alibaba cloud
- Linode LLC
- CoreWeave
*List Not Exhaustive
Notable Milestones in GPU as a Service Market Sector
- November 2023: Microsoft Corporation announced the addition of a new NVIDIA H200 Tensor core GPU as a Service on Azure, expected to boost AI workloads like LLMs and generative AI models.
- May 2024: Krutrim, an AI startup by Ola, launched a GPU as a Service, enabling developers and enterprises to train and tune AI models at competitive prices.
In-Depth GPU as a Service Market Market Outlook
The GPU as a Service market is poised for sustained growth, driven by ongoing technological advancements, increased cloud adoption, and the expanding applications of AI and machine learning. Strategic partnerships, market expansion into new regions, and the development of specialized GPU solutions will further accelerate market growth. The future holds significant opportunities for companies that can effectively address the challenges related to data privacy, supply chain management, and competition. The market's future potential is substantial, with projections suggesting significant expansion in both market size and penetration over the next decade.
GPU as a Service Market Segmentation
-
1. Application
- 1.1. Artificial Intelligence
- 1.2. High Performance Computing
- 1.3. Other Applications
-
2. Enterprise Type
- 2.1. Small and Medium Enterprise
- 2.2. Large Enterprise
-
3. End User
- 3.1. BFSI
- 3.2. Automotive
- 3.3. Healthcare
- 3.4. IT and Communication
- 3.5. Other End Users
GPU as a Service Market Segmentation By Geography
- 1. North America
- 2. Europe
- 3. Asia
- 4. Australia and New Zealand
- 5. Middle East and Africa
- 6. Latin America
GPU as a Service Market REPORT HIGHLIGHTS
| Aspects | Details |
|---|---|
| Study Period | 2019-2033 |
| Base Year | 2024 |
| Estimated Year | 2025 |
| Forecast Period | 2025-2033 |
| Historical Period | 2019-2024 |
| Growth Rate | CAGR of 29.20% from 2019-2033 |
| Segmentation |
|
Table of Contents
- 1. Introduction
- 1.1. Research Scope
- 1.2. Market Segmentation
- 1.3. Research Methodology
- 1.4. Definitions and Assumptions
- 2. Executive Summary
- 2.1. Introduction
- 3. Market Dynamics
- 3.1. Introduction
- 3.2. Market Drivers
- 3.2.1 Rising Usage of Generative AI and LLM Models Across Enterprises; Growing Applications of AR
- 3.2.2 VR
- 3.2.3 and AI
- 3.3. Market Restrains
- 3.3.1 Rising Usage of Generative AI and LLM Models Across Enterprises; Growing Applications of AR
- 3.3.2 VR
- 3.3.3 and AI
- 3.4. Market Trends
- 3.4.1. Automotive is Expected to Witness Remarkable Growth During Forecast Period
- 4. Market Factor Analysis
- 4.1. Porters Five Forces
- 4.2. Supply/Value Chain
- 4.3. PESTEL analysis
- 4.4. Market Entropy
- 4.5. Patent/Trademark Analysis
- 5. Global GPU as a Service Market Analysis, Insights and Forecast, 2019-2031
- 5.1. Market Analysis, Insights and Forecast - by Application
- 5.1.1. Artificial Intelligence
- 5.1.2. High Performance Computing
- 5.1.3. Other Applications
- 5.2. Market Analysis, Insights and Forecast - by Enterprise Type
- 5.2.1. Small and Medium Enterprise
- 5.2.2. Large Enterprise
- 5.3. Market Analysis, Insights and Forecast - by End User
- 5.3.1. BFSI
- 5.3.2. Automotive
- 5.3.3. Healthcare
- 5.3.4. IT and Communication
- 5.3.5. Other End Users
- 5.4. Market Analysis, Insights and Forecast - by Region
- 5.4.1. North America
- 5.4.2. Europe
- 5.4.3. Asia
- 5.4.4. Australia and New Zealand
- 5.4.5. Middle East and Africa
- 5.4.6. Latin America
- 5.1. Market Analysis, Insights and Forecast - by Application
- 6. North America GPU as a Service Market Analysis, Insights and Forecast, 2019-2031
- 6.1. Market Analysis, Insights and Forecast - by Application
- 6.1.1. Artificial Intelligence
- 6.1.2. High Performance Computing
- 6.1.3. Other Applications
- 6.2. Market Analysis, Insights and Forecast - by Enterprise Type
- 6.2.1. Small and Medium Enterprise
- 6.2.2. Large Enterprise
- 6.3. Market Analysis, Insights and Forecast - by End User
- 6.3.1. BFSI
- 6.3.2. Automotive
- 6.3.3. Healthcare
- 6.3.4. IT and Communication
- 6.3.5. Other End Users
- 6.1. Market Analysis, Insights and Forecast - by Application
- 7. Europe GPU as a Service Market Analysis, Insights and Forecast, 2019-2031
- 7.1. Market Analysis, Insights and Forecast - by Application
- 7.1.1. Artificial Intelligence
- 7.1.2. High Performance Computing
- 7.1.3. Other Applications
- 7.2. Market Analysis, Insights and Forecast - by Enterprise Type
- 7.2.1. Small and Medium Enterprise
- 7.2.2. Large Enterprise
- 7.3. Market Analysis, Insights and Forecast - by End User
- 7.3.1. BFSI
- 7.3.2. Automotive
- 7.3.3. Healthcare
- 7.3.4. IT and Communication
- 7.3.5. Other End Users
- 7.1. Market Analysis, Insights and Forecast - by Application
- 8. Asia GPU as a Service Market Analysis, Insights and Forecast, 2019-2031
- 8.1. Market Analysis, Insights and Forecast - by Application
- 8.1.1. Artificial Intelligence
- 8.1.2. High Performance Computing
- 8.1.3. Other Applications
- 8.2. Market Analysis, Insights and Forecast - by Enterprise Type
- 8.2.1. Small and Medium Enterprise
- 8.2.2. Large Enterprise
- 8.3. Market Analysis, Insights and Forecast - by End User
- 8.3.1. BFSI
- 8.3.2. Automotive
- 8.3.3. Healthcare
- 8.3.4. IT and Communication
- 8.3.5. Other End Users
- 8.1. Market Analysis, Insights and Forecast - by Application
- 9. Australia and New Zealand GPU as a Service Market Analysis, Insights and Forecast, 2019-2031
- 9.1. Market Analysis, Insights and Forecast - by Application
- 9.1.1. Artificial Intelligence
- 9.1.2. High Performance Computing
- 9.1.3. Other Applications
- 9.2. Market Analysis, Insights and Forecast - by Enterprise Type
- 9.2.1. Small and Medium Enterprise
- 9.2.2. Large Enterprise
- 9.3. Market Analysis, Insights and Forecast - by End User
- 9.3.1. BFSI
- 9.3.2. Automotive
- 9.3.3. Healthcare
- 9.3.4. IT and Communication
- 9.3.5. Other End Users
- 9.1. Market Analysis, Insights and Forecast - by Application
- 10. Middle East and Africa GPU as a Service Market Analysis, Insights and Forecast, 2019-2031
- 10.1. Market Analysis, Insights and Forecast - by Application
- 10.1.1. Artificial Intelligence
- 10.1.2. High Performance Computing
- 10.1.3. Other Applications
- 10.2. Market Analysis, Insights and Forecast - by Enterprise Type
- 10.2.1. Small and Medium Enterprise
- 10.2.2. Large Enterprise
- 10.3. Market Analysis, Insights and Forecast - by End User
- 10.3.1. BFSI
- 10.3.2. Automotive
- 10.3.3. Healthcare
- 10.3.4. IT and Communication
- 10.3.5. Other End Users
- 10.1. Market Analysis, Insights and Forecast - by Application
- 11. Latin America GPU as a Service Market Analysis, Insights and Forecast, 2019-2031
- 11.1. Market Analysis, Insights and Forecast - by Application
- 11.1.1. Artificial Intelligence
- 11.1.2. High Performance Computing
- 11.1.3. Other Applications
- 11.2. Market Analysis, Insights and Forecast - by Enterprise Type
- 11.2.1. Small and Medium Enterprise
- 11.2.2. Large Enterprise
- 11.3. Market Analysis, Insights and Forecast - by End User
- 11.3.1. BFSI
- 11.3.2. Automotive
- 11.3.3. Healthcare
- 11.3.4. IT and Communication
- 11.3.5. Other End Users
- 11.1. Market Analysis, Insights and Forecast - by Application
- 12. Competitive Analysis
- 12.1. Global Market Share Analysis 2024
- 12.2. Company Profiles
- 12.2.1 Amazon Web Services Inc
- 12.2.1.1. Overview
- 12.2.1.2. Products
- 12.2.1.3. SWOT Analysis
- 12.2.1.4. Recent Developments
- 12.2.1.5. Financials (Based on Availability)
- 12.2.2 Microsoft Corporation
- 12.2.2.1. Overview
- 12.2.2.2. Products
- 12.2.2.3. SWOT Analysis
- 12.2.2.4. Recent Developments
- 12.2.2.5. Financials (Based on Availability)
- 12.2.3 Nvidia DGX (Nvidia Corporation)
- 12.2.3.1. Overview
- 12.2.3.2. Products
- 12.2.3.3. SWOT Analysis
- 12.2.3.4. Recent Developments
- 12.2.3.5. Financials (Based on Availability)
- 12.2.4 IBM Corporation
- 12.2.4.1. Overview
- 12.2.4.2. Products
- 12.2.4.3. SWOT Analysis
- 12.2.4.4. Recent Developments
- 12.2.4.5. Financials (Based on Availability)
- 12.2.5 Oracle Systems Corporation
- 12.2.5.1. Overview
- 12.2.5.2. Products
- 12.2.5.3. SWOT Analysis
- 12.2.5.4. Recent Developments
- 12.2.5.5. Financials (Based on Availability)
- 12.2.6 Alphabet Inc (Google)
- 12.2.6.1. Overview
- 12.2.6.2. Products
- 12.2.6.3. SWOT Analysis
- 12.2.6.4. Recent Developments
- 12.2.6.5. Financials (Based on Availability)
- 12.2.7 Latitude sh
- 12.2.7.1. Overview
- 12.2.7.2. Products
- 12.2.7.3. SWOT Analysis
- 12.2.7.4. Recent Developments
- 12.2.7.5. Financials (Based on Availability)
- 12.2.8 Seeweb
- 12.2.8.1. Overview
- 12.2.8.2. Products
- 12.2.8.3. SWOT Analysis
- 12.2.8.4. Recent Developments
- 12.2.8.5. Financials (Based on Availability)
- 12.2.9 Alibaba cloud
- 12.2.9.1. Overview
- 12.2.9.2. Products
- 12.2.9.3. SWOT Analysis
- 12.2.9.4. Recent Developments
- 12.2.9.5. Financials (Based on Availability)
- 12.2.10 Linode LLC
- 12.2.10.1. Overview
- 12.2.10.2. Products
- 12.2.10.3. SWOT Analysis
- 12.2.10.4. Recent Developments
- 12.2.10.5. Financials (Based on Availability)
- 12.2.11 CoreWeave*List Not Exhaustive
- 12.2.11.1. Overview
- 12.2.11.2. Products
- 12.2.11.3. SWOT Analysis
- 12.2.11.4. Recent Developments
- 12.2.11.5. Financials (Based on Availability)
- 12.2.1 Amazon Web Services Inc
List of Figures
- Figure 1: Global GPU as a Service Market Revenue Breakdown (Million, %) by Region 2024 & 2032
- Figure 2: Global GPU as a Service Market Volume Breakdown (Billion, %) by Region 2024 & 2032
- Figure 3: North America GPU as a Service Market Revenue (Million), by Application 2024 & 2032
- Figure 4: North America GPU as a Service Market Volume (Billion), by Application 2024 & 2032
- Figure 5: North America GPU as a Service Market Revenue Share (%), by Application 2024 & 2032
- Figure 6: North America GPU as a Service Market Volume Share (%), by Application 2024 & 2032
- Figure 7: North America GPU as a Service Market Revenue (Million), by Enterprise Type 2024 & 2032
- Figure 8: North America GPU as a Service Market Volume (Billion), by Enterprise Type 2024 & 2032
- Figure 9: North America GPU as a Service Market Revenue Share (%), by Enterprise Type 2024 & 2032
- Figure 10: North America GPU as a Service Market Volume Share (%), by Enterprise Type 2024 & 2032
- Figure 11: North America GPU as a Service Market Revenue (Million), by End User 2024 & 2032
- Figure 12: North America GPU as a Service Market Volume (Billion), by End User 2024 & 2032
- Figure 13: North America GPU as a Service Market Revenue Share (%), by End User 2024 & 2032
- Figure 14: North America GPU as a Service Market Volume Share (%), by End User 2024 & 2032
- Figure 15: North America GPU as a Service Market Revenue (Million), by Country 2024 & 2032
- Figure 16: North America GPU as a Service Market Volume (Billion), by Country 2024 & 2032
- Figure 17: North America GPU as a Service Market Revenue Share (%), by Country 2024 & 2032
- Figure 18: North America GPU as a Service Market Volume Share (%), by Country 2024 & 2032
- Figure 19: Europe GPU as a Service Market Revenue (Million), by Application 2024 & 2032
- Figure 20: Europe GPU as a Service Market Volume (Billion), by Application 2024 & 2032
- Figure 21: Europe GPU as a Service Market Revenue Share (%), by Application 2024 & 2032
- Figure 22: Europe GPU as a Service Market Volume Share (%), by Application 2024 & 2032
- Figure 23: Europe GPU as a Service Market Revenue (Million), by Enterprise Type 2024 & 2032
- Figure 24: Europe GPU as a Service Market Volume (Billion), by Enterprise Type 2024 & 2032
- Figure 25: Europe GPU as a Service Market Revenue Share (%), by Enterprise Type 2024 & 2032
- Figure 26: Europe GPU as a Service Market Volume Share (%), by Enterprise Type 2024 & 2032
- Figure 27: Europe GPU as a Service Market Revenue (Million), by End User 2024 & 2032
- Figure 28: Europe GPU as a Service Market Volume (Billion), by End User 2024 & 2032
- Figure 29: Europe GPU as a Service Market Revenue Share (%), by End User 2024 & 2032
- Figure 30: Europe GPU as a Service Market Volume Share (%), by End User 2024 & 2032
- Figure 31: Europe GPU as a Service Market Revenue (Million), by Country 2024 & 2032
- Figure 32: Europe GPU as a Service Market Volume (Billion), by Country 2024 & 2032
- Figure 33: Europe GPU as a Service Market Revenue Share (%), by Country 2024 & 2032
- Figure 34: Europe GPU as a Service Market Volume Share (%), by Country 2024 & 2032
- Figure 35: Asia GPU as a Service Market Revenue (Million), by Application 2024 & 2032
- Figure 36: Asia GPU as a Service Market Volume (Billion), by Application 2024 & 2032
- Figure 37: Asia GPU as a Service Market Revenue Share (%), by Application 2024 & 2032
- Figure 38: Asia GPU as a Service Market Volume Share (%), by Application 2024 & 2032
- Figure 39: Asia GPU as a Service Market Revenue (Million), by Enterprise Type 2024 & 2032
- Figure 40: Asia GPU as a Service Market Volume (Billion), by Enterprise Type 2024 & 2032
- Figure 41: Asia GPU as a Service Market Revenue Share (%), by Enterprise Type 2024 & 2032
- Figure 42: Asia GPU as a Service Market Volume Share (%), by Enterprise Type 2024 & 2032
- Figure 43: Asia GPU as a Service Market Revenue (Million), by End User 2024 & 2032
- Figure 44: Asia GPU as a Service Market Volume (Billion), by End User 2024 & 2032
- Figure 45: Asia GPU as a Service Market Revenue Share (%), by End User 2024 & 2032
- Figure 46: Asia GPU as a Service Market Volume Share (%), by End User 2024 & 2032
- Figure 47: Asia GPU as a Service Market Revenue (Million), by Country 2024 & 2032
- Figure 48: Asia GPU as a Service Market Volume (Billion), by Country 2024 & 2032
- Figure 49: Asia GPU as a Service Market Revenue Share (%), by Country 2024 & 2032
- Figure 50: Asia GPU as a Service Market Volume Share (%), by Country 2024 & 2032
- Figure 51: Australia and New Zealand GPU as a Service Market Revenue (Million), by Application 2024 & 2032
- Figure 52: Australia and New Zealand GPU as a Service Market Volume (Billion), by Application 2024 & 2032
- Figure 53: Australia and New Zealand GPU as a Service Market Revenue Share (%), by Application 2024 & 2032
- Figure 54: Australia and New Zealand GPU as a Service Market Volume Share (%), by Application 2024 & 2032
- Figure 55: Australia and New Zealand GPU as a Service Market Revenue (Million), by Enterprise Type 2024 & 2032
- Figure 56: Australia and New Zealand GPU as a Service Market Volume (Billion), by Enterprise Type 2024 & 2032
- Figure 57: Australia and New Zealand GPU as a Service Market Revenue Share (%), by Enterprise Type 2024 & 2032
- Figure 58: Australia and New Zealand GPU as a Service Market Volume Share (%), by Enterprise Type 2024 & 2032
- Figure 59: Australia and New Zealand GPU as a Service Market Revenue (Million), by End User 2024 & 2032
- Figure 60: Australia and New Zealand GPU as a Service Market Volume (Billion), by End User 2024 & 2032
- Figure 61: Australia and New Zealand GPU as a Service Market Revenue Share (%), by End User 2024 & 2032
- Figure 62: Australia and New Zealand GPU as a Service Market Volume Share (%), by End User 2024 & 2032
- Figure 63: Australia and New Zealand GPU as a Service Market Revenue (Million), by Country 2024 & 2032
- Figure 64: Australia and New Zealand GPU as a Service Market Volume (Billion), by Country 2024 & 2032
- Figure 65: Australia and New Zealand GPU as a Service Market Revenue Share (%), by Country 2024 & 2032
- Figure 66: Australia and New Zealand GPU as a Service Market Volume Share (%), by Country 2024 & 2032
- Figure 67: Middle East and Africa GPU as a Service Market Revenue (Million), by Application 2024 & 2032
- Figure 68: Middle East and Africa GPU as a Service Market Volume (Billion), by Application 2024 & 2032
- Figure 69: Middle East and Africa GPU as a Service Market Revenue Share (%), by Application 2024 & 2032
- Figure 70: Middle East and Africa GPU as a Service Market Volume Share (%), by Application 2024 & 2032
- Figure 71: Middle East and Africa GPU as a Service Market Revenue (Million), by Enterprise Type 2024 & 2032
- Figure 72: Middle East and Africa GPU as a Service Market Volume (Billion), by Enterprise Type 2024 & 2032
- Figure 73: Middle East and Africa GPU as a Service Market Revenue Share (%), by Enterprise Type 2024 & 2032
- Figure 74: Middle East and Africa GPU as a Service Market Volume Share (%), by Enterprise Type 2024 & 2032
- Figure 75: Middle East and Africa GPU as a Service Market Revenue (Million), by End User 2024 & 2032
- Figure 76: Middle East and Africa GPU as a Service Market Volume (Billion), by End User 2024 & 2032
- Figure 77: Middle East and Africa GPU as a Service Market Revenue Share (%), by End User 2024 & 2032
- Figure 78: Middle East and Africa GPU as a Service Market Volume Share (%), by End User 2024 & 2032
- Figure 79: Middle East and Africa GPU as a Service Market Revenue (Million), by Country 2024 & 2032
- Figure 80: Middle East and Africa GPU as a Service Market Volume (Billion), by Country 2024 & 2032
- Figure 81: Middle East and Africa GPU as a Service Market Revenue Share (%), by Country 2024 & 2032
- Figure 82: Middle East and Africa GPU as a Service Market Volume Share (%), by Country 2024 & 2032
- Figure 83: Latin America GPU as a Service Market Revenue (Million), by Application 2024 & 2032
- Figure 84: Latin America GPU as a Service Market Volume (Billion), by Application 2024 & 2032
- Figure 85: Latin America GPU as a Service Market Revenue Share (%), by Application 2024 & 2032
- Figure 86: Latin America GPU as a Service Market Volume Share (%), by Application 2024 & 2032
- Figure 87: Latin America GPU as a Service Market Revenue (Million), by Enterprise Type 2024 & 2032
- Figure 88: Latin America GPU as a Service Market Volume (Billion), by Enterprise Type 2024 & 2032
- Figure 89: Latin America GPU as a Service Market Revenue Share (%), by Enterprise Type 2024 & 2032
- Figure 90: Latin America GPU as a Service Market Volume Share (%), by Enterprise Type 2024 & 2032
- Figure 91: Latin America GPU as a Service Market Revenue (Million), by End User 2024 & 2032
- Figure 92: Latin America GPU as a Service Market Volume (Billion), by End User 2024 & 2032
- Figure 93: Latin America GPU as a Service Market Revenue Share (%), by End User 2024 & 2032
- Figure 94: Latin America GPU as a Service Market Volume Share (%), by End User 2024 & 2032
- Figure 95: Latin America GPU as a Service Market Revenue (Million), by Country 2024 & 2032
- Figure 96: Latin America GPU as a Service Market Volume (Billion), by Country 2024 & 2032
- Figure 97: Latin America GPU as a Service Market Revenue Share (%), by Country 2024 & 2032
- Figure 98: Latin America GPU as a Service Market Volume Share (%), by Country 2024 & 2032
List of Tables
- Table 1: Global GPU as a Service Market Revenue Million Forecast, by Region 2019 & 2032
- Table 2: Global GPU as a Service Market Volume Billion Forecast, by Region 2019 & 2032
- Table 3: Global GPU as a Service Market Revenue Million Forecast, by Application 2019 & 2032
- Table 4: Global GPU as a Service Market Volume Billion Forecast, by Application 2019 & 2032
- Table 5: Global GPU as a Service Market Revenue Million Forecast, by Enterprise Type 2019 & 2032
- Table 6: Global GPU as a Service Market Volume Billion Forecast, by Enterprise Type 2019 & 2032
- Table 7: Global GPU as a Service Market Revenue Million Forecast, by End User 2019 & 2032
- Table 8: Global GPU as a Service Market Volume Billion Forecast, by End User 2019 & 2032
- Table 9: Global GPU as a Service Market Revenue Million Forecast, by Region 2019 & 2032
- Table 10: Global GPU as a Service Market Volume Billion Forecast, by Region 2019 & 2032
- Table 11: Global GPU as a Service Market Revenue Million Forecast, by Application 2019 & 2032
- Table 12: Global GPU as a Service Market Volume Billion Forecast, by Application 2019 & 2032
- Table 13: Global GPU as a Service Market Revenue Million Forecast, by Enterprise Type 2019 & 2032
- Table 14: Global GPU as a Service Market Volume Billion Forecast, by Enterprise Type 2019 & 2032
- Table 15: Global GPU as a Service Market Revenue Million Forecast, by End User 2019 & 2032
- Table 16: Global GPU as a Service Market Volume Billion Forecast, by End User 2019 & 2032
- Table 17: Global GPU as a Service Market Revenue Million Forecast, by Country 2019 & 2032
- Table 18: Global GPU as a Service Market Volume Billion Forecast, by Country 2019 & 2032
- Table 19: Global GPU as a Service Market Revenue Million Forecast, by Application 2019 & 2032
- Table 20: Global GPU as a Service Market Volume Billion Forecast, by Application 2019 & 2032
- Table 21: Global GPU as a Service Market Revenue Million Forecast, by Enterprise Type 2019 & 2032
- Table 22: Global GPU as a Service Market Volume Billion Forecast, by Enterprise Type 2019 & 2032
- Table 23: Global GPU as a Service Market Revenue Million Forecast, by End User 2019 & 2032
- Table 24: Global GPU as a Service Market Volume Billion Forecast, by End User 2019 & 2032
- Table 25: Global GPU as a Service Market Revenue Million Forecast, by Country 2019 & 2032
- Table 26: Global GPU as a Service Market Volume Billion Forecast, by Country 2019 & 2032
- Table 27: Global GPU as a Service Market Revenue Million Forecast, by Application 2019 & 2032
- Table 28: Global GPU as a Service Market Volume Billion Forecast, by Application 2019 & 2032
- Table 29: Global GPU as a Service Market Revenue Million Forecast, by Enterprise Type 2019 & 2032
- Table 30: Global GPU as a Service Market Volume Billion Forecast, by Enterprise Type 2019 & 2032
- Table 31: Global GPU as a Service Market Revenue Million Forecast, by End User 2019 & 2032
- Table 32: Global GPU as a Service Market Volume Billion Forecast, by End User 2019 & 2032
- Table 33: Global GPU as a Service Market Revenue Million Forecast, by Country 2019 & 2032
- Table 34: Global GPU as a Service Market Volume Billion Forecast, by Country 2019 & 2032
- Table 35: Global GPU as a Service Market Revenue Million Forecast, by Application 2019 & 2032
- Table 36: Global GPU as a Service Market Volume Billion Forecast, by Application 2019 & 2032
- Table 37: Global GPU as a Service Market Revenue Million Forecast, by Enterprise Type 2019 & 2032
- Table 38: Global GPU as a Service Market Volume Billion Forecast, by Enterprise Type 2019 & 2032
- Table 39: Global GPU as a Service Market Revenue Million Forecast, by End User 2019 & 2032
- Table 40: Global GPU as a Service Market Volume Billion Forecast, by End User 2019 & 2032
- Table 41: Global GPU as a Service Market Revenue Million Forecast, by Country 2019 & 2032
- Table 42: Global GPU as a Service Market Volume Billion Forecast, by Country 2019 & 2032
- Table 43: Global GPU as a Service Market Revenue Million Forecast, by Application 2019 & 2032
- Table 44: Global GPU as a Service Market Volume Billion Forecast, by Application 2019 & 2032
- Table 45: Global GPU as a Service Market Revenue Million Forecast, by Enterprise Type 2019 & 2032
- Table 46: Global GPU as a Service Market Volume Billion Forecast, by Enterprise Type 2019 & 2032
- Table 47: Global GPU as a Service Market Revenue Million Forecast, by End User 2019 & 2032
- Table 48: Global GPU as a Service Market Volume Billion Forecast, by End User 2019 & 2032
- Table 49: Global GPU as a Service Market Revenue Million Forecast, by Country 2019 & 2032
- Table 50: Global GPU as a Service Market Volume Billion Forecast, by Country 2019 & 2032
- Table 51: Global GPU as a Service Market Revenue Million Forecast, by Application 2019 & 2032
- Table 52: Global GPU as a Service Market Volume Billion Forecast, by Application 2019 & 2032
- Table 53: Global GPU as a Service Market Revenue Million Forecast, by Enterprise Type 2019 & 2032
- Table 54: Global GPU as a Service Market Volume Billion Forecast, by Enterprise Type 2019 & 2032
- Table 55: Global GPU as a Service Market Revenue Million Forecast, by End User 2019 & 2032
- Table 56: Global GPU as a Service Market Volume Billion Forecast, by End User 2019 & 2032
- Table 57: Global GPU as a Service Market Revenue Million Forecast, by Country 2019 & 2032
- Table 58: Global GPU as a Service Market Volume Billion Forecast, by Country 2019 & 2032
Frequently Asked Questions
1. What is the projected Compound Annual Growth Rate (CAGR) of the GPU as a Service Market?
The projected CAGR is approximately 29.20%.
2. Which companies are prominent players in the GPU as a Service Market?
Key companies in the market include Amazon Web Services Inc, Microsoft Corporation, Nvidia DGX (Nvidia Corporation), IBM Corporation, Oracle Systems Corporation, Alphabet Inc (Google), Latitude sh, Seeweb, Alibaba cloud, Linode LLC, CoreWeave*List Not Exhaustive.
3. What are the main segments of the GPU as a Service Market?
The market segments include Application, Enterprise Type, End User.
4. Can you provide details about the market size?
The market size is estimated to be USD 5.05 Million as of 2022.
5. What are some drivers contributing to market growth?
Rising Usage of Generative AI and LLM Models Across Enterprises; Growing Applications of AR. VR. and AI.
6. What are the notable trends driving market growth?
Automotive is Expected to Witness Remarkable Growth During Forecast Period.
7. Are there any restraints impacting market growth?
Rising Usage of Generative AI and LLM Models Across Enterprises; Growing Applications of AR. VR. and AI.
8. Can you provide examples of recent developments in the market?
May 2024: Krutrim, an AI startup by Ola, launched a GPU as a Service, which enables developers and enterprises to train and tune their AI models at competitive prices.November 2023: Microsoft Corporation announced the addition of a new NVIDIA H200 Tensor core GPU as a Service on Azure, which will be available in Q2 2024. The new service aims to support larger model inferencing with no growth in latency. This new service is expected to boost AI workloads such as LLMs and generative AI models.
9. What pricing options are available for accessing the report?
Pricing options include single-user, multi-user, and enterprise licenses priced at USD 4750, USD 5250, and USD 8750 respectively.
10. Is the market size provided in terms of value or volume?
The market size is provided in terms of value, measured in Million and volume, measured in Billion.
11. Are there any specific market keywords associated with the report?
Yes, the market keyword associated with the report is "GPU as a Service Market," which aids in identifying and referencing the specific market segment covered.
12. How do I determine which pricing option suits my needs best?
The pricing options vary based on user requirements and access needs. Individual users may opt for single-user licenses, while businesses requiring broader access may choose multi-user or enterprise licenses for cost-effective access to the report.
13. Are there any additional resources or data provided in the GPU as a Service Market report?
While the report offers comprehensive insights, it's advisable to review the specific contents or supplementary materials provided to ascertain if additional resources or data are available.
14. How can I stay updated on further developments or reports in the GPU as a Service Market?
To stay informed about further developments, trends, and reports in the GPU as a Service Market, consider subscribing to industry newsletters, following relevant companies and organizations, or regularly checking reputable industry news sources and publications.
Methodology
Step 1 - Identification of Relevant Samples Size from Population Database


Step 2 - Approaches for Defining Global Market Size (Value, Volume* & Price*)

Note*: In applicable scenarios
Step 3 - Data Sources
Primary Research
- Web Analytics
- Survey Reports
- Research Institute
- Latest Research Reports
- Opinion Leaders
Secondary Research
- Annual Reports
- White Paper
- Latest Press Release
- Industry Association
- Paid Database
- Investor Presentations

Step 4 - Data Triangulation
Involves using different sources of information in order to increase the validity of a study
These sources are likely to be stakeholders in a program - participants, other researchers, program staff, other community members, and so on.
Then we put all data in single framework & apply various statistical tools to find out the dynamic on the market.
During the analysis stage, feedback from the stakeholder groups would be compared to determine areas of agreement as well as areas of divergence
