

Key Insights
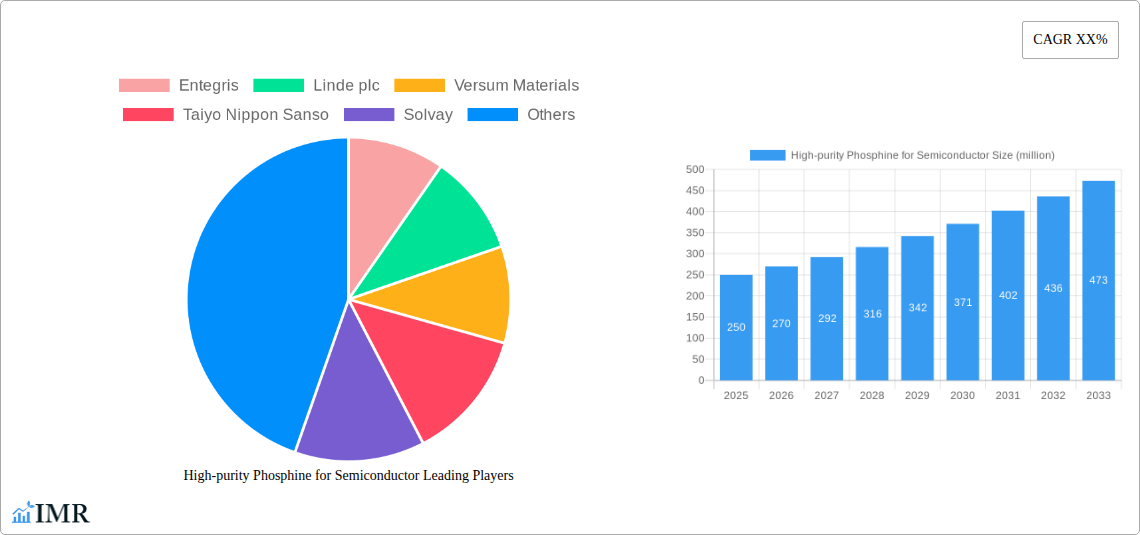
The high-purity phosphine for semiconductor market is experiencing robust growth, driven by the increasing demand for advanced semiconductor devices in various applications, including 5G infrastructure, artificial intelligence, and automotive electronics. The market's Compound Annual Growth Rate (CAGR) is estimated to be around 8% between 2025 and 2033, projecting a significant expansion from an estimated market size of $250 million in 2025 to approximately $450 million by 2033. Key drivers include the ongoing miniaturization of semiconductor chips, requiring higher purity levels of phosphine, and the expansion of leading-edge semiconductor manufacturing facilities globally. Trends such as the increasing adoption of advanced packaging techniques and the development of new semiconductor materials further fuel market growth. However, the market faces restraints such as stringent safety regulations surrounding the handling and transportation of phosphine due to its toxicity, and the potential for supply chain disruptions impacting the availability of raw materials. Major players like Entegris, Linde plc, Versum Materials, Taiyo Nippon Sanso, Solvay, and others are actively involved in developing innovative technologies to enhance safety and efficiency in phosphine production and delivery, further shaping the market landscape.
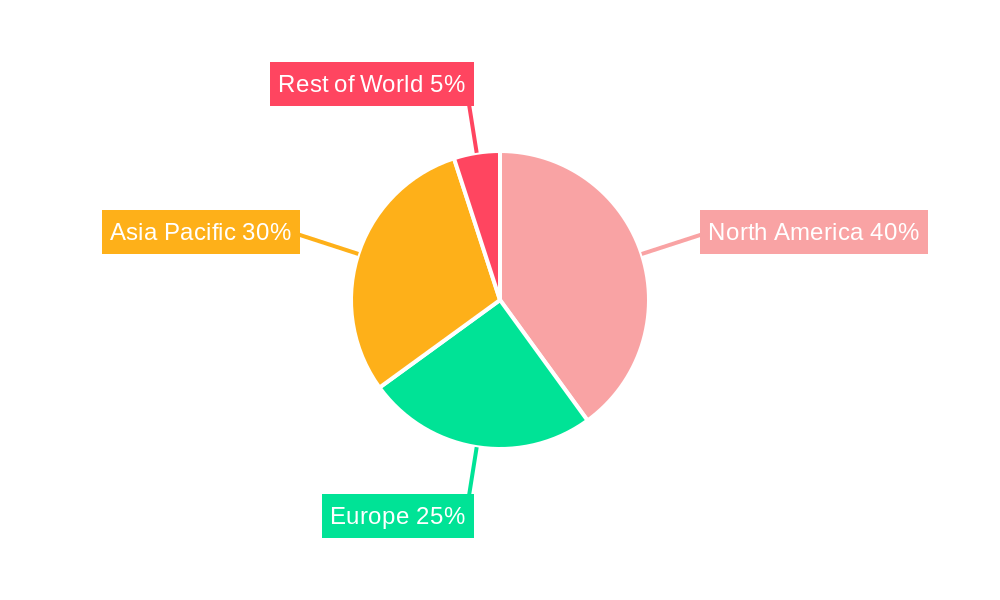
The segmentation of the high-purity phosphine market is largely driven by purity levels, with the demand for ultra-high-purity phosphine exceeding that of standard-grade products. Regional variations exist, with North America and Asia (particularly East Asia) currently dominating the market due to a high concentration of semiconductor manufacturing facilities. However, the growth in other regions like Europe is expected to increase as investments in semiconductor manufacturing expand. Competitive dynamics are characterized by a mix of established players with extensive production capabilities and emerging companies focusing on specialized applications and advanced purification techniques. The market is projected to consolidate further as companies invest in research and development and seek strategic partnerships to enhance their market positions. Long-term growth will depend on the continued innovation in semiconductor technology, the successful mitigation of supply chain risks and the implementation of robust safety protocols in the handling of phosphine.
High-Purity Phosphine for Semiconductor Market Report: 2019-2033
This comprehensive report provides an in-depth analysis of the high-purity phosphine for semiconductor market, covering market dynamics, growth trends, regional analysis, competitive landscape, and future outlook. The study period spans from 2019 to 2033, with 2025 serving as both the base and estimated year. This report is crucial for semiconductor manufacturers, material suppliers, investors, and industry analysts seeking a comprehensive understanding of this critical market segment. The parent market is the semiconductor industry, and the child market is specialized high-purity gases for semiconductor manufacturing.
High-purity Phosphine for Semiconductor Market Dynamics & Structure
The high-purity phosphine market is characterized by a moderately concentrated landscape, with key players like Entegris, Linde plc, Versum Materials, Taiyo Nippon Sanso, Solvay, Nata Opto-electronic, and Shanghai GenTech holding significant market share. The market is driven by continuous technological advancements in semiconductor manufacturing, particularly in the development of advanced nodes and increased demand for high-performance chips. Stringent regulatory frameworks related to gas handling and safety significantly influence operational costs and practices. The market also faces competitive pressures from alternative doping techniques. M&A activity has been moderate, with a predicted xx million USD in deal volume during the study period, driven primarily by consolidation efforts and vertical integration strategies.
- Market Concentration: Moderately concentrated, with top 5 players holding approximately xx% market share in 2025.
- Technological Innovation: Focus on enhancing purity levels, improving gas delivery systems, and reducing environmental impact.
- Regulatory Framework: Stringent safety regulations concerning handling and transportation of phosphine.
- Competitive Substitutes: Emerging alternative doping methods pose a moderate threat.
- End-User Demographics: Primarily driven by leading semiconductor manufacturers across various regions.
- M&A Trends: Moderate activity, primarily driven by consolidation and vertical integration.
High-purity Phosphine for Semiconductor Growth Trends & Insights
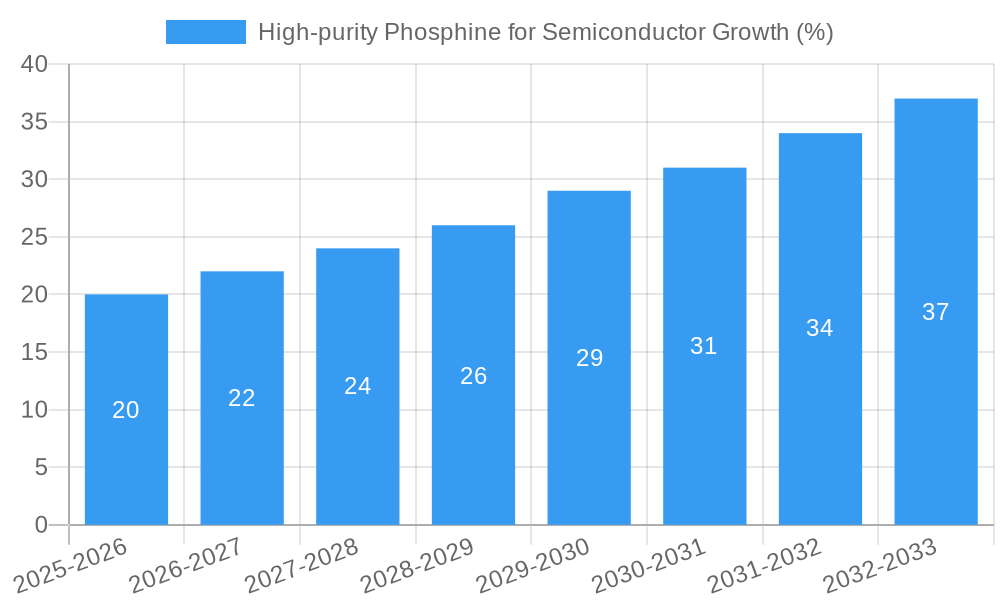
The high-purity phosphine market experienced a CAGR of xx% during the historical period (2019-2024) and is projected to maintain a CAGR of xx% during the forecast period (2025-2033), reaching a market size of xx million units by 2033. This growth is primarily fueled by the booming semiconductor industry, particularly the increasing demand for advanced logic and memory chips. Technological advancements in semiconductor manufacturing processes, such as EUV lithography, are further driving market growth. The market penetration of high-purity phosphine in advanced semiconductor manufacturing processes has been steadily increasing and is expected to reach xx% by 2033. Consumer behavior shifts towards high-performance computing and mobile devices contribute to the overall demand.
Dominant Regions, Countries, or Segments in High-purity Phosphine for Semiconductor
East Asia, particularly Taiwan, South Korea, and China, holds the dominant position in the high-purity phosphine market, owing to the concentration of leading semiconductor foundries and fabs. The robust semiconductor industry in these regions, coupled with favorable government policies supporting technological advancements, drives high demand. North America and Europe also contribute significantly, fueled by robust domestic semiconductor industries and investments in advanced technologies.
- Key Drivers in East Asia:
- High concentration of semiconductor manufacturing facilities.
- Strong government support for technological advancements.
- Growing domestic demand for high-performance electronics.
- Dominance Factors: High concentration of semiconductor fabs, robust investments in R&D, and established supply chains.
- Growth Potential: Continued growth is anticipated, driven by increased capacity expansions and technological innovations in the semiconductor industry.
High-purity Phosphine for Semiconductor Product Landscape
The high-purity phosphine market offers products with varying purity levels and packaging options to meet the stringent requirements of different semiconductor manufacturing processes. Innovations focus on enhanced purity, improved handling systems, and efficient delivery methods. The unique selling propositions include precise purity levels, minimized impurities, and reliable delivery systems, ensuring consistent and high-quality results. Technological advancements involve the development of advanced purification techniques and sophisticated gas delivery systems.
Key Drivers, Barriers & Challenges in High-purity Phosphine for Semiconductor
Key Drivers:
- The increasing demand for advanced semiconductor devices.
- Continuous advancements in semiconductor manufacturing technology.
- Government support and incentives for semiconductor industry development.
Challenges and Restraints:
- The inherent toxicity and flammability of phosphine pose safety and handling challenges.
- Strict environmental regulations and the need for sustainable manufacturing practices.
- The fluctuating prices of raw materials and potential supply chain disruptions.
Emerging Opportunities in High-purity Phosphine for Semiconductor
Emerging opportunities include the expansion into new geographical markets, particularly in Southeast Asia and India, where semiconductor manufacturing is rapidly growing. Further, the increasing adoption of advanced packaging techniques and the rise of specialized semiconductor applications in areas like 5G and AI present significant opportunities for high-purity phosphine suppliers.
Growth Accelerators in the High-purity Phosphine for Semiconductor Industry
Long-term growth will be accelerated by strategic partnerships between gas suppliers and semiconductor manufacturers, enabling collaborative development of advanced materials and processes. Technological breakthroughs in purification techniques and delivery systems will enhance product quality and efficiency. Moreover, expansion into new applications and markets will unlock further growth opportunities.
Key Players Shaping the High-purity Phosphine for Semiconductor Market
- Entegris
- Linde plc
- Versum Materials
- Taiyo Nippon Sanso
- Solvay
- Nata Opto-electronic
- Shanghai GenTech
Notable Milestones in High-purity Phosphine for Semiconductor Sector
- 2022-Q4: Linde plc announces investment in a new high-purity gas production facility.
- 2023-Q1: Entegris launches a new generation of phosphine delivery system.
- 2024-Q3: Versum Materials secures a long-term supply agreement with a major semiconductor manufacturer.
In-Depth High-purity Phosphine for Semiconductor Market Outlook
The high-purity phosphine market is poised for continued robust growth, driven by the sustained expansion of the semiconductor industry and the ongoing demand for advanced technologies. Strategic investments in R&D, capacity expansion, and strategic partnerships will play a crucial role in shaping the future of this market. Opportunities abound for companies that can effectively address the challenges related to safety, sustainability, and cost optimization.
High-purity Phosphine for Semiconductor Segmentation
-
1. Application
- 1.1. ETCH
- 1.2. Deposition
-
2. Types
- 2.1. 5N
- 2.2. 6N
- 2.3. Others
High-purity Phosphine for Semiconductor Segmentation By Geography
-
1. North America
- 1.1. United States
- 1.2. Canada
- 1.3. Mexico
-
2. South America
- 2.1. Brazil
- 2.2. Argentina
- 2.3. Rest of South America
-
3. Europe
- 3.1. United Kingdom
- 3.2. Germany
- 3.3. France
- 3.4. Italy
- 3.5. Spain
- 3.6. Russia
- 3.7. Benelux
- 3.8. Nordics
- 3.9. Rest of Europe
-
4. Middle East & Africa
- 4.1. Turkey
- 4.2. Israel
- 4.3. GCC
- 4.4. North Africa
- 4.5. South Africa
- 4.6. Rest of Middle East & Africa
-
5. Asia Pacific
- 5.1. China
- 5.2. India
- 5.3. Japan
- 5.4. South Korea
- 5.5. ASEAN
- 5.6. Oceania
- 5.7. Rest of Asia Pacific
High-purity Phosphine for Semiconductor REPORT HIGHLIGHTS
| Aspects | Details |
|---|---|
| Study Period | 2019-2033 |
| Base Year | 2024 |
| Estimated Year | 2025 |
| Forecast Period | 2025-2033 |
| Historical Period | 2019-2024 |
| Growth Rate | CAGR of XX% from 2019-2033 |
| Segmentation |
|
Table of Contents
- 1. Introduction
- 1.1. Research Scope
- 1.2. Market Segmentation
- 1.3. Research Methodology
- 1.4. Definitions and Assumptions
- 2. Executive Summary
- 2.1. Introduction
- 3. Market Dynamics
- 3.1. Introduction
- 3.2. Market Drivers
- 3.3. Market Restrains
- 3.4. Market Trends
- 4. Market Factor Analysis
- 4.1. Porters Five Forces
- 4.2. Supply/Value Chain
- 4.3. PESTEL analysis
- 4.4. Market Entropy
- 4.5. Patent/Trademark Analysis
- 5. Global High-purity Phosphine for Semiconductor Analysis, Insights and Forecast, 2019-2031
- 5.1. Market Analysis, Insights and Forecast - by Application
- 5.1.1. ETCH
- 5.1.2. Deposition
- 5.2. Market Analysis, Insights and Forecast - by Types
- 5.2.1. 5N
- 5.2.2. 6N
- 5.2.3. Others
- 5.3. Market Analysis, Insights and Forecast - by Region
- 5.3.1. North America
- 5.3.2. South America
- 5.3.3. Europe
- 5.3.4. Middle East & Africa
- 5.3.5. Asia Pacific
- 5.1. Market Analysis, Insights and Forecast - by Application
- 6. North America High-purity Phosphine for Semiconductor Analysis, Insights and Forecast, 2019-2031
- 6.1. Market Analysis, Insights and Forecast - by Application
- 6.1.1. ETCH
- 6.1.2. Deposition
- 6.2. Market Analysis, Insights and Forecast - by Types
- 6.2.1. 5N
- 6.2.2. 6N
- 6.2.3. Others
- 6.1. Market Analysis, Insights and Forecast - by Application
- 7. South America High-purity Phosphine for Semiconductor Analysis, Insights and Forecast, 2019-2031
- 7.1. Market Analysis, Insights and Forecast - by Application
- 7.1.1. ETCH
- 7.1.2. Deposition
- 7.2. Market Analysis, Insights and Forecast - by Types
- 7.2.1. 5N
- 7.2.2. 6N
- 7.2.3. Others
- 7.1. Market Analysis, Insights and Forecast - by Application
- 8. Europe High-purity Phosphine for Semiconductor Analysis, Insights and Forecast, 2019-2031
- 8.1. Market Analysis, Insights and Forecast - by Application
- 8.1.1. ETCH
- 8.1.2. Deposition
- 8.2. Market Analysis, Insights and Forecast - by Types
- 8.2.1. 5N
- 8.2.2. 6N
- 8.2.3. Others
- 8.1. Market Analysis, Insights and Forecast - by Application
- 9. Middle East & Africa High-purity Phosphine for Semiconductor Analysis, Insights and Forecast, 2019-2031
- 9.1. Market Analysis, Insights and Forecast - by Application
- 9.1.1. ETCH
- 9.1.2. Deposition
- 9.2. Market Analysis, Insights and Forecast - by Types
- 9.2.1. 5N
- 9.2.2. 6N
- 9.2.3. Others
- 9.1. Market Analysis, Insights and Forecast - by Application
- 10. Asia Pacific High-purity Phosphine for Semiconductor Analysis, Insights and Forecast, 2019-2031
- 10.1. Market Analysis, Insights and Forecast - by Application
- 10.1.1. ETCH
- 10.1.2. Deposition
- 10.2. Market Analysis, Insights and Forecast - by Types
- 10.2.1. 5N
- 10.2.2. 6N
- 10.2.3. Others
- 10.1. Market Analysis, Insights and Forecast - by Application
- 11. Competitive Analysis
- 11.1. Global Market Share Analysis 2024
- 11.2. Company Profiles
- 11.2.1 Entegris
- 11.2.1.1. Overview
- 11.2.1.2. Products
- 11.2.1.3. SWOT Analysis
- 11.2.1.4. Recent Developments
- 11.2.1.5. Financials (Based on Availability)
- 11.2.2 Linde plc
- 11.2.2.1. Overview
- 11.2.2.2. Products
- 11.2.2.3. SWOT Analysis
- 11.2.2.4. Recent Developments
- 11.2.2.5. Financials (Based on Availability)
- 11.2.3 Versum Materials
- 11.2.3.1. Overview
- 11.2.3.2. Products
- 11.2.3.3. SWOT Analysis
- 11.2.3.4. Recent Developments
- 11.2.3.5. Financials (Based on Availability)
- 11.2.4 Taiyo Nippon Sanso
- 11.2.4.1. Overview
- 11.2.4.2. Products
- 11.2.4.3. SWOT Analysis
- 11.2.4.4. Recent Developments
- 11.2.4.5. Financials (Based on Availability)
- 11.2.5 Solvay
- 11.2.5.1. Overview
- 11.2.5.2. Products
- 11.2.5.3. SWOT Analysis
- 11.2.5.4. Recent Developments
- 11.2.5.5. Financials (Based on Availability)
- 11.2.6 Nata Opto-electronic
- 11.2.6.1. Overview
- 11.2.6.2. Products
- 11.2.6.3. SWOT Analysis
- 11.2.6.4. Recent Developments
- 11.2.6.5. Financials (Based on Availability)
- 11.2.7 Shanghai GenTech
- 11.2.7.1. Overview
- 11.2.7.2. Products
- 11.2.7.3. SWOT Analysis
- 11.2.7.4. Recent Developments
- 11.2.7.5. Financials (Based on Availability)
- 11.2.1 Entegris
List of Figures
- Figure 1: Global High-purity Phosphine for Semiconductor Revenue Breakdown (million, %) by Region 2024 & 2032
- Figure 2: North America High-purity Phosphine for Semiconductor Revenue (million), by Application 2024 & 2032
- Figure 3: North America High-purity Phosphine for Semiconductor Revenue Share (%), by Application 2024 & 2032
- Figure 4: North America High-purity Phosphine for Semiconductor Revenue (million), by Types 2024 & 2032
- Figure 5: North America High-purity Phosphine for Semiconductor Revenue Share (%), by Types 2024 & 2032
- Figure 6: North America High-purity Phosphine for Semiconductor Revenue (million), by Country 2024 & 2032
- Figure 7: North America High-purity Phosphine for Semiconductor Revenue Share (%), by Country 2024 & 2032
- Figure 8: South America High-purity Phosphine for Semiconductor Revenue (million), by Application 2024 & 2032
- Figure 9: South America High-purity Phosphine for Semiconductor Revenue Share (%), by Application 2024 & 2032
- Figure 10: South America High-purity Phosphine for Semiconductor Revenue (million), by Types 2024 & 2032
- Figure 11: South America High-purity Phosphine for Semiconductor Revenue Share (%), by Types 2024 & 2032
- Figure 12: South America High-purity Phosphine for Semiconductor Revenue (million), by Country 2024 & 2032
- Figure 13: South America High-purity Phosphine for Semiconductor Revenue Share (%), by Country 2024 & 2032
- Figure 14: Europe High-purity Phosphine for Semiconductor Revenue (million), by Application 2024 & 2032
- Figure 15: Europe High-purity Phosphine for Semiconductor Revenue Share (%), by Application 2024 & 2032
- Figure 16: Europe High-purity Phosphine for Semiconductor Revenue (million), by Types 2024 & 2032
- Figure 17: Europe High-purity Phosphine for Semiconductor Revenue Share (%), by Types 2024 & 2032
- Figure 18: Europe High-purity Phosphine for Semiconductor Revenue (million), by Country 2024 & 2032
- Figure 19: Europe High-purity Phosphine for Semiconductor Revenue Share (%), by Country 2024 & 2032
- Figure 20: Middle East & Africa High-purity Phosphine for Semiconductor Revenue (million), by Application 2024 & 2032
- Figure 21: Middle East & Africa High-purity Phosphine for Semiconductor Revenue Share (%), by Application 2024 & 2032
- Figure 22: Middle East & Africa High-purity Phosphine for Semiconductor Revenue (million), by Types 2024 & 2032
- Figure 23: Middle East & Africa High-purity Phosphine for Semiconductor Revenue Share (%), by Types 2024 & 2032
- Figure 24: Middle East & Africa High-purity Phosphine for Semiconductor Revenue (million), by Country 2024 & 2032
- Figure 25: Middle East & Africa High-purity Phosphine for Semiconductor Revenue Share (%), by Country 2024 & 2032
- Figure 26: Asia Pacific High-purity Phosphine for Semiconductor Revenue (million), by Application 2024 & 2032
- Figure 27: Asia Pacific High-purity Phosphine for Semiconductor Revenue Share (%), by Application 2024 & 2032
- Figure 28: Asia Pacific High-purity Phosphine for Semiconductor Revenue (million), by Types 2024 & 2032
- Figure 29: Asia Pacific High-purity Phosphine for Semiconductor Revenue Share (%), by Types 2024 & 2032
- Figure 30: Asia Pacific High-purity Phosphine for Semiconductor Revenue (million), by Country 2024 & 2032
- Figure 31: Asia Pacific High-purity Phosphine for Semiconductor Revenue Share (%), by Country 2024 & 2032
List of Tables
- Table 1: Global High-purity Phosphine for Semiconductor Revenue million Forecast, by Region 2019 & 2032
- Table 2: Global High-purity Phosphine for Semiconductor Revenue million Forecast, by Application 2019 & 2032
- Table 3: Global High-purity Phosphine for Semiconductor Revenue million Forecast, by Types 2019 & 2032
- Table 4: Global High-purity Phosphine for Semiconductor Revenue million Forecast, by Region 2019 & 2032
- Table 5: Global High-purity Phosphine for Semiconductor Revenue million Forecast, by Application 2019 & 2032
- Table 6: Global High-purity Phosphine for Semiconductor Revenue million Forecast, by Types 2019 & 2032
- Table 7: Global High-purity Phosphine for Semiconductor Revenue million Forecast, by Country 2019 & 2032
- Table 8: United States High-purity Phosphine for Semiconductor Revenue (million) Forecast, by Application 2019 & 2032
- Table 9: Canada High-purity Phosphine for Semiconductor Revenue (million) Forecast, by Application 2019 & 2032
- Table 10: Mexico High-purity Phosphine for Semiconductor Revenue (million) Forecast, by Application 2019 & 2032
- Table 11: Global High-purity Phosphine for Semiconductor Revenue million Forecast, by Application 2019 & 2032
- Table 12: Global High-purity Phosphine for Semiconductor Revenue million Forecast, by Types 2019 & 2032
- Table 13: Global High-purity Phosphine for Semiconductor Revenue million Forecast, by Country 2019 & 2032
- Table 14: Brazil High-purity Phosphine for Semiconductor Revenue (million) Forecast, by Application 2019 & 2032
- Table 15: Argentina High-purity Phosphine for Semiconductor Revenue (million) Forecast, by Application 2019 & 2032
- Table 16: Rest of South America High-purity Phosphine for Semiconductor Revenue (million) Forecast, by Application 2019 & 2032
- Table 17: Global High-purity Phosphine for Semiconductor Revenue million Forecast, by Application 2019 & 2032
- Table 18: Global High-purity Phosphine for Semiconductor Revenue million Forecast, by Types 2019 & 2032
- Table 19: Global High-purity Phosphine for Semiconductor Revenue million Forecast, by Country 2019 & 2032
- Table 20: United Kingdom High-purity Phosphine for Semiconductor Revenue (million) Forecast, by Application 2019 & 2032
- Table 21: Germany High-purity Phosphine for Semiconductor Revenue (million) Forecast, by Application 2019 & 2032
- Table 22: France High-purity Phosphine for Semiconductor Revenue (million) Forecast, by Application 2019 & 2032
- Table 23: Italy High-purity Phosphine for Semiconductor Revenue (million) Forecast, by Application 2019 & 2032
- Table 24: Spain High-purity Phosphine for Semiconductor Revenue (million) Forecast, by Application 2019 & 2032
- Table 25: Russia High-purity Phosphine for Semiconductor Revenue (million) Forecast, by Application 2019 & 2032
- Table 26: Benelux High-purity Phosphine for Semiconductor Revenue (million) Forecast, by Application 2019 & 2032
- Table 27: Nordics High-purity Phosphine for Semiconductor Revenue (million) Forecast, by Application 2019 & 2032
- Table 28: Rest of Europe High-purity Phosphine for Semiconductor Revenue (million) Forecast, by Application 2019 & 2032
- Table 29: Global High-purity Phosphine for Semiconductor Revenue million Forecast, by Application 2019 & 2032
- Table 30: Global High-purity Phosphine for Semiconductor Revenue million Forecast, by Types 2019 & 2032
- Table 31: Global High-purity Phosphine for Semiconductor Revenue million Forecast, by Country 2019 & 2032
- Table 32: Turkey High-purity Phosphine for Semiconductor Revenue (million) Forecast, by Application 2019 & 2032
- Table 33: Israel High-purity Phosphine for Semiconductor Revenue (million) Forecast, by Application 2019 & 2032
- Table 34: GCC High-purity Phosphine for Semiconductor Revenue (million) Forecast, by Application 2019 & 2032
- Table 35: North Africa High-purity Phosphine for Semiconductor Revenue (million) Forecast, by Application 2019 & 2032
- Table 36: South Africa High-purity Phosphine for Semiconductor Revenue (million) Forecast, by Application 2019 & 2032
- Table 37: Rest of Middle East & Africa High-purity Phosphine for Semiconductor Revenue (million) Forecast, by Application 2019 & 2032
- Table 38: Global High-purity Phosphine for Semiconductor Revenue million Forecast, by Application 2019 & 2032
- Table 39: Global High-purity Phosphine for Semiconductor Revenue million Forecast, by Types 2019 & 2032
- Table 40: Global High-purity Phosphine for Semiconductor Revenue million Forecast, by Country 2019 & 2032
- Table 41: China High-purity Phosphine for Semiconductor Revenue (million) Forecast, by Application 2019 & 2032
- Table 42: India High-purity Phosphine for Semiconductor Revenue (million) Forecast, by Application 2019 & 2032
- Table 43: Japan High-purity Phosphine for Semiconductor Revenue (million) Forecast, by Application 2019 & 2032
- Table 44: South Korea High-purity Phosphine for Semiconductor Revenue (million) Forecast, by Application 2019 & 2032
- Table 45: ASEAN High-purity Phosphine for Semiconductor Revenue (million) Forecast, by Application 2019 & 2032
- Table 46: Oceania High-purity Phosphine for Semiconductor Revenue (million) Forecast, by Application 2019 & 2032
- Table 47: Rest of Asia Pacific High-purity Phosphine for Semiconductor Revenue (million) Forecast, by Application 2019 & 2032
Frequently Asked Questions
1. What is the projected Compound Annual Growth Rate (CAGR) of the High-purity Phosphine for Semiconductor?
The projected CAGR is approximately XX%.
2. Which companies are prominent players in the High-purity Phosphine for Semiconductor?
Key companies in the market include Entegris, Linde plc, Versum Materials, Taiyo Nippon Sanso, Solvay, Nata Opto-electronic, Shanghai GenTech.
3. What are the main segments of the High-purity Phosphine for Semiconductor?
The market segments include Application, Types.
4. Can you provide details about the market size?
The market size is estimated to be USD XXX million as of 2022.
5. What are some drivers contributing to market growth?
N/A
6. What are the notable trends driving market growth?
N/A
7. Are there any restraints impacting market growth?
N/A
8. Can you provide examples of recent developments in the market?
N/A
9. What pricing options are available for accessing the report?
Pricing options include single-user, multi-user, and enterprise licenses priced at USD 4900.00, USD 7350.00, and USD 9800.00 respectively.
10. Is the market size provided in terms of value or volume?
The market size is provided in terms of value, measured in million.
11. Are there any specific market keywords associated with the report?
Yes, the market keyword associated with the report is "High-purity Phosphine for Semiconductor," which aids in identifying and referencing the specific market segment covered.
12. How do I determine which pricing option suits my needs best?
The pricing options vary based on user requirements and access needs. Individual users may opt for single-user licenses, while businesses requiring broader access may choose multi-user or enterprise licenses for cost-effective access to the report.
13. Are there any additional resources or data provided in the High-purity Phosphine for Semiconductor report?
While the report offers comprehensive insights, it's advisable to review the specific contents or supplementary materials provided to ascertain if additional resources or data are available.
14. How can I stay updated on further developments or reports in the High-purity Phosphine for Semiconductor?
To stay informed about further developments, trends, and reports in the High-purity Phosphine for Semiconductor, consider subscribing to industry newsletters, following relevant companies and organizations, or regularly checking reputable industry news sources and publications.
Methodology
Step 1 - Identification of Relevant Samples Size from Population Database


Step 2 - Approaches for Defining Global Market Size (Value, Volume* & Price*)

Note*: In applicable scenarios
Step 3 - Data Sources
Primary Research
- Web Analytics
- Survey Reports
- Research Institute
- Latest Research Reports
- Opinion Leaders
Secondary Research
- Annual Reports
- White Paper
- Latest Press Release
- Industry Association
- Paid Database
- Investor Presentations

Step 4 - Data Triangulation
Involves using different sources of information in order to increase the validity of a study
These sources are likely to be stakeholders in a program - participants, other researchers, program staff, other community members, and so on.
Then we put all data in single framework & apply various statistical tools to find out the dynamic on the market.
During the analysis stage, feedback from the stakeholder groups would be compared to determine areas of agreement as well as areas of divergence
