

Key Insights
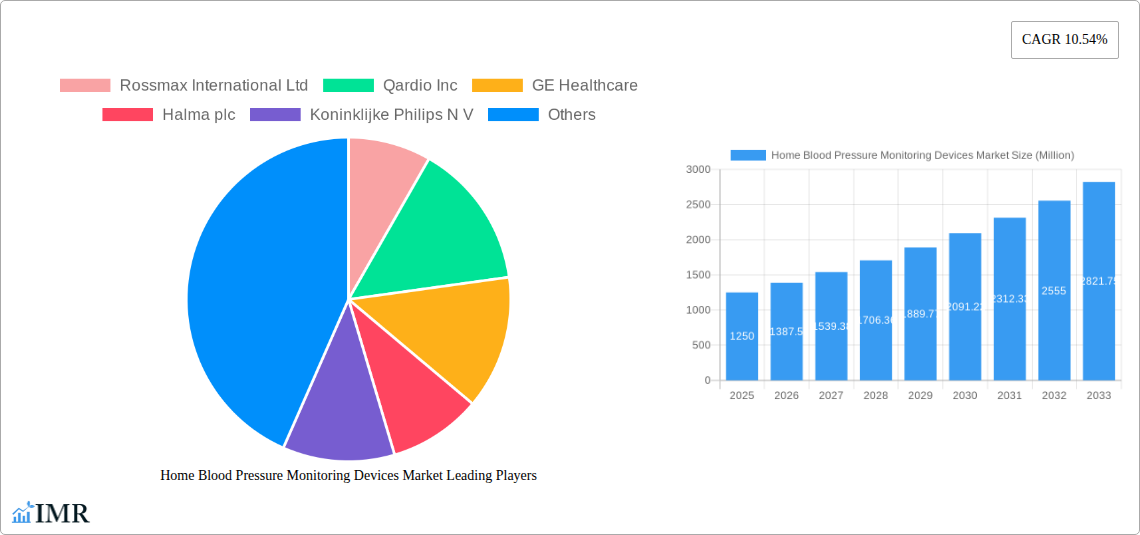
The global Home Blood Pressure Monitoring Devices market, valued at $1.25 billion in 2025, is projected to experience robust growth, driven by rising prevalence of hypertension, an aging global population, and increasing awareness of cardiovascular health. The market's Compound Annual Growth Rate (CAGR) of 10.54% from 2025 to 2033 signifies significant expansion opportunities. Key growth drivers include technological advancements leading to more accurate, user-friendly, and connected devices, coupled with a rising demand for convenient at-home healthcare solutions. The segment encompassing upper arm monitors maintains market dominance due to its established accuracy and reliability, although wrist monitors are gaining traction due to their portability and ease of use. Online pharmacies are emerging as a significant distribution channel, benefiting from e-commerce growth and consumer preference for convenient purchasing options. However, market growth may be tempered by factors such as the relatively high cost of some advanced devices, potential inaccuracies in readings from certain devices, and varying levels of healthcare literacy among consumers. Competitive landscape analysis reveals that key players like Omron, Philips, and others are actively involved in product innovation, strategic partnerships, and market expansion to maintain their positions. Future growth will likely be influenced by further technological advancements, such as integration with smart health platforms and artificial intelligence for personalized health management, alongside ongoing efforts to enhance consumer education on proper blood pressure monitoring techniques.
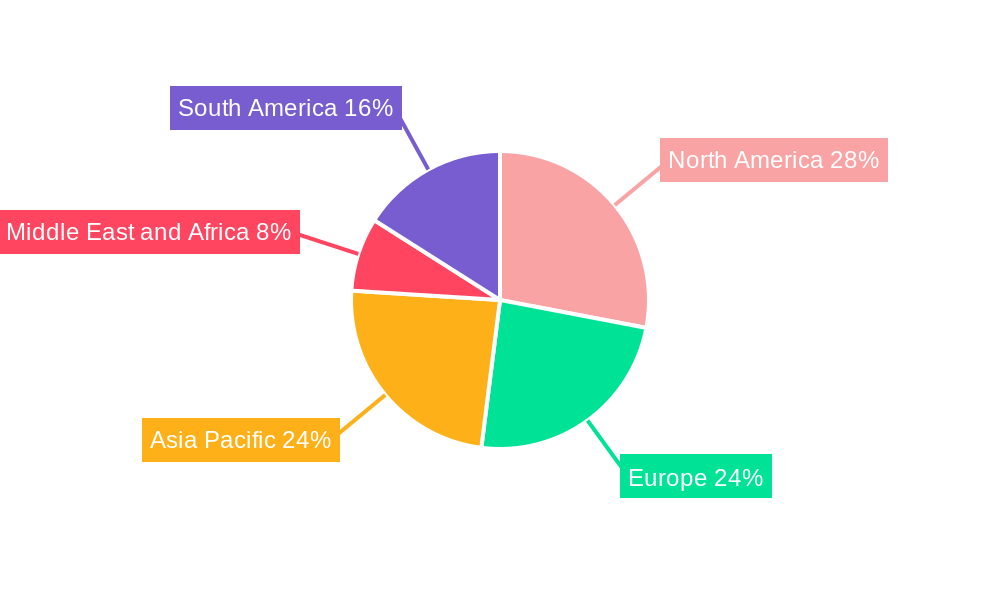
The market is geographically diverse, with North America and Europe representing significant market shares due to higher healthcare expenditure and awareness. However, the Asia-Pacific region is expected to show substantial growth in the coming years, driven by rapid economic development, increasing healthcare infrastructure, and a burgeoning elderly population. The forecast period (2025-2033) offers significant potential for both established players and new entrants. Strategic partnerships, product diversification, and targeted marketing campaigns will be crucial for sustained success within this dynamic and expanding market. Companies are focusing on developing compact and user-friendly devices, integrating telehealth capabilities, and expanding their distribution networks to capitalize on the growing demand for home-based healthcare.
Home Blood Pressure Monitoring Devices Market: A Comprehensive Report (2019-2033)
This in-depth report provides a comprehensive analysis of the Home Blood Pressure Monitoring Devices market, encompassing market dynamics, growth trends, regional segmentation, product landscape, and key player strategies. With a study period spanning 2019-2033, a base year of 2025, and a forecast period of 2025-2033, this report is an invaluable resource for industry professionals, investors, and strategic decision-makers. The report also covers the parent market of medical devices and the child market of home healthcare monitoring. The global market size is projected to reach xx Million units by 2033.
Home Blood Pressure Monitoring Devices Market Market Dynamics & Structure
This section analyzes the competitive landscape, technological advancements, regulatory influences, and market trends within the home blood pressure monitoring devices market. We explore market concentration, identifying key players and their market shares. The report also details the impact of technological innovations, such as cuff-less monitoring and improved accuracy, on market growth. Furthermore, it examines the regulatory landscape and its influence on product development and market access, alongside the impact of competitive substitutes and the evolving end-user demographics. The analysis includes a review of M&A activity within the sector, including the number and value of deals.
- Market Concentration: The market is characterized by a moderately consolidated structure, with the top 5 players holding approximately xx% of the market share in 2024. This is expected to remain relatively stable throughout the forecast period.
- Technological Innovation: Continuous improvements in sensor technology, wireless connectivity, and data analytics are driving market growth. Innovation barriers include high R&D costs and regulatory approvals.
- Regulatory Frameworks: Stringent regulatory requirements for medical devices vary across regions, influencing product approvals and market entry strategies.
- Competitive Substitutes: Alternative methods for blood pressure monitoring, such as those employed in healthcare facilities, represent a competitive pressure.
- End-User Demographics: The aging global population and increasing prevalence of hypertension are key drivers of market growth.
- M&A Trends: The past five years have witnessed xx M&A deals, primarily focused on expanding product portfolios and geographical reach.
Home Blood Pressure Monitoring Devices Market Growth Trends & Insights
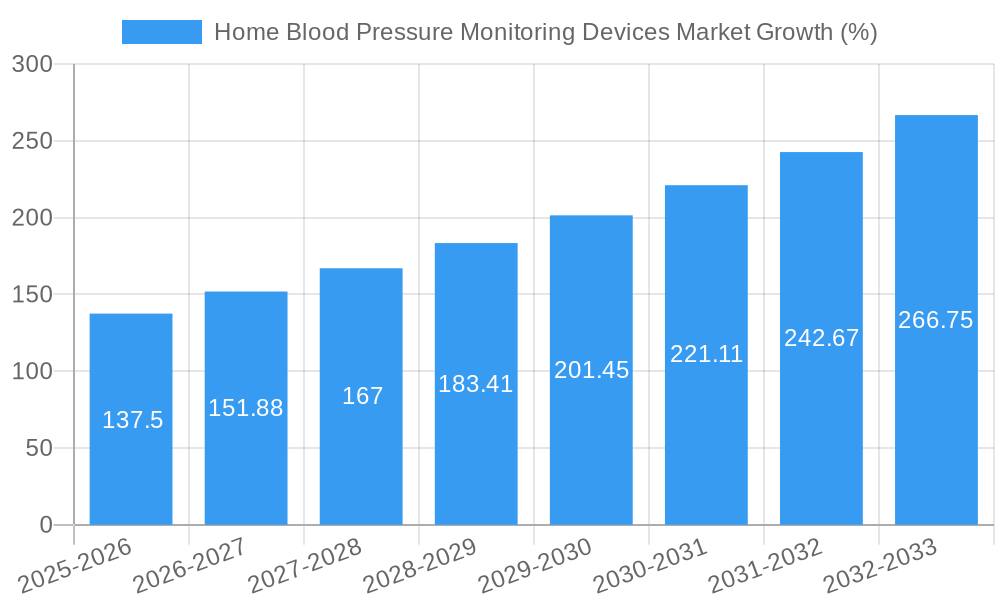
This section delves into the historical and projected growth of the home blood pressure monitoring devices market, leveraging extensive data analysis. We examine market size evolution, adoption rates across different regions, and the influence of technological advancements and consumer behavior shifts. Key metrics such as CAGR (Compound Annual Growth Rate) and market penetration rates are provided to offer detailed insights into the market's trajectory. The analysis covers factors such as increasing awareness of hypertension and the convenience of home monitoring.
Dominant Regions, Countries, or Segments in Home Blood Pressure Monitoring Devices Market
This section identifies the leading geographical regions, countries, and product/distribution segments driving market growth. We analyze the factors contributing to the dominance of specific regions, including economic policies, healthcare infrastructure, and consumer preferences. The market share and growth potential of each segment are carefully examined. The analysis will also highlight the differences in growth trajectories between regions due to factors such as healthcare spending, technological adoption, and public health initiatives.
- Leading Regions: North America and Europe are expected to maintain their dominance throughout the forecast period, driven by high healthcare expenditure and technological advancements. Asia-Pacific is projected to experience the fastest growth, fueled by increasing awareness of cardiovascular diseases and rising disposable incomes.
- Leading Product Segment: Upper arm monitors currently dominate the market, followed by wrist monitors and accessories. The market share of wrist monitors is anticipated to grow at a faster rate in the coming years.
- Leading Distribution Channel: Online pharmacies are witnessing significant growth due to their convenience and accessibility. Hospital pharmacies and other distribution channels maintain a sizable share of the market.
Home Blood Pressure Monitoring Devices Market Product Landscape
This section examines the range of products available in the market, focusing on product innovations, applications, and performance metrics. We discuss the unique selling propositions (USPs) of various devices and highlight technological advancements that improve accuracy, ease of use, and data connectivity. Specific examples of innovative features, such as Bluetooth connectivity and smartphone integration, will be covered.
Key Drivers, Barriers & Challenges in Home Blood Pressure Monitoring Devices Market
This section analyzes the key drivers and restraints shaping the market's growth trajectory. Drivers include increased prevalence of hypertension, growing awareness about cardiovascular health, technological advancements enabling accurate and convenient monitoring, and supportive government initiatives. Challenges include regulatory hurdles, competition from established players, price sensitivity, and the need for user education and compliance.
- Key Drivers: Rising prevalence of hypertension, technological advancements, increasing healthcare expenditure, and government initiatives promoting preventative healthcare.
- Key Barriers: High initial cost of devices, stringent regulatory requirements, potential for inaccurate readings if used incorrectly, and concerns about data privacy and security.
Emerging Opportunities in Home Blood Pressure Monitoring Devices Market
This section focuses on emerging trends and untapped opportunities, including expansion into underserved markets, the development of innovative applications such as remote patient monitoring, and the growing demand for personalized and connected healthcare solutions.
Growth Accelerators in the Home Blood Pressure Monitoring Devices Market Industry
This section highlights the factors expected to accelerate market growth in the long term. These include technological breakthroughs in sensor technology and data analytics, strategic partnerships between device manufacturers and healthcare providers, and the increasing adoption of telehealth and remote patient monitoring programs.
Key Players Shaping the Home Blood Pressure Monitoring Devices Market Market
- Rossmax International Ltd
- Qardio Inc
- GE Healthcare
- Halma plc
- Koninklijke Philips N V
- Spengler SAS
- A&D Medical
- Contec Medical
- Omron Healthcare Inc
- Welch Allyn Inc
- Beurer GmbH
- American Diagnostic Corporation
Notable Milestones in Home Blood Pressure Monitoring Devices Market Sector
- July 2022: LiveMetric launched LiveOne, a cuff-free wrist-worn blood pressure monitor offering real-time measurements. This innovation significantly enhances continuous monitoring capabilities for hypertension management.
- February 2022: InBody launched the InBody BP 170, an at-home automatic blood pressure monitor with a large, user-friendly display, improving accessibility and usability.
In-Depth Home Blood Pressure Monitoring Devices Market Market Outlook
The future of the home blood pressure monitoring devices market is bright, driven by ongoing technological advancements, growing adoption of connected healthcare, and the increasing need for convenient and accurate self-monitoring solutions. Strategic partnerships and innovative product launches will further propel market growth. The market is poised for significant expansion as technology continues to improve accuracy, user-friendliness, and data connectivity, creating opportunities for personalized healthcare solutions.
Home Blood Pressure Monitoring Devices Market Segmentation
-
1. Product
- 1.1. Upper Arm Monitors
- 1.2. Wrist Monitors
- 1.3. Accessories
-
2. Distribution Channel
- 2.1. Hospital Pharmacies
- 2.2. Online Pharmacies
- 2.3. Other Distribution Channels
Home Blood Pressure Monitoring Devices Market Segmentation By Geography
-
1. North America
- 1.1. United States
- 1.2. Canada
- 1.3. Mexico
-
2. Europe
- 2.1. Germany
- 2.2. United Kingdom
- 2.3. France
- 2.4. Italy
- 2.5. Spain
- 2.6. Rest of Europe
-
3. Asia Pacific
- 3.1. China
- 3.2. Japan
- 3.3. India
- 3.4. Australia
- 3.5. South Korea
- 3.6. Rest of Asia Pacific
-
4. Middle East and Africa
- 4.1. GCC
- 4.2. South Africa
- 4.3. Rest of Middle East and Africa
-
5. South America
- 5.1. Brazil
- 5.2. Argentina
- 5.3. Rest of South America
Home Blood Pressure Monitoring Devices Market REPORT HIGHLIGHTS
| Aspects | Details |
|---|---|
| Study Period | 2019-2033 |
| Base Year | 2024 |
| Estimated Year | 2025 |
| Forecast Period | 2025-2033 |
| Historical Period | 2019-2024 |
| Growth Rate | CAGR of 10.54% from 2019-2033 |
| Segmentation |
|
Table of Contents
- 1. Introduction
- 1.1. Research Scope
- 1.2. Market Segmentation
- 1.3. Research Methodology
- 1.4. Definitions and Assumptions
- 2. Executive Summary
- 2.1. Introduction
- 3. Market Dynamics
- 3.1. Introduction
- 3.2. Market Drivers
- 3.2.1. Growing Burden of Blood Pressure-Related Diseases; Rise in the Use of Home Blood Pressure Monitors and Active Promotions; Advancements in the Devices
- 3.3. Market Restrains
- 3.3.1. High Cost and Accuracy of Devices
- 3.4. Market Trends
- 3.4.1. Wrist Monitors Segment is Dominating the Home Blood Pressure Monitoring Devices Market
- 4. Market Factor Analysis
- 4.1. Porters Five Forces
- 4.2. Supply/Value Chain
- 4.3. PESTEL analysis
- 4.4. Market Entropy
- 4.5. Patent/Trademark Analysis
- 5. Global Home Blood Pressure Monitoring Devices Market Analysis, Insights and Forecast, 2019-2031
- 5.1. Market Analysis, Insights and Forecast - by Product
- 5.1.1. Upper Arm Monitors
- 5.1.2. Wrist Monitors
- 5.1.3. Accessories
- 5.2. Market Analysis, Insights and Forecast - by Distribution Channel
- 5.2.1. Hospital Pharmacies
- 5.2.2. Online Pharmacies
- 5.2.3. Other Distribution Channels
- 5.3. Market Analysis, Insights and Forecast - by Region
- 5.3.1. North America
- 5.3.2. Europe
- 5.3.3. Asia Pacific
- 5.3.4. Middle East and Africa
- 5.3.5. South America
- 5.1. Market Analysis, Insights and Forecast - by Product
- 6. North America Home Blood Pressure Monitoring Devices Market Analysis, Insights and Forecast, 2019-2031
- 6.1. Market Analysis, Insights and Forecast - by Product
- 6.1.1. Upper Arm Monitors
- 6.1.2. Wrist Monitors
- 6.1.3. Accessories
- 6.2. Market Analysis, Insights and Forecast - by Distribution Channel
- 6.2.1. Hospital Pharmacies
- 6.2.2. Online Pharmacies
- 6.2.3. Other Distribution Channels
- 6.1. Market Analysis, Insights and Forecast - by Product
- 7. Europe Home Blood Pressure Monitoring Devices Market Analysis, Insights and Forecast, 2019-2031
- 7.1. Market Analysis, Insights and Forecast - by Product
- 7.1.1. Upper Arm Monitors
- 7.1.2. Wrist Monitors
- 7.1.3. Accessories
- 7.2. Market Analysis, Insights and Forecast - by Distribution Channel
- 7.2.1. Hospital Pharmacies
- 7.2.2. Online Pharmacies
- 7.2.3. Other Distribution Channels
- 7.1. Market Analysis, Insights and Forecast - by Product
- 8. Asia Pacific Home Blood Pressure Monitoring Devices Market Analysis, Insights and Forecast, 2019-2031
- 8.1. Market Analysis, Insights and Forecast - by Product
- 8.1.1. Upper Arm Monitors
- 8.1.2. Wrist Monitors
- 8.1.3. Accessories
- 8.2. Market Analysis, Insights and Forecast - by Distribution Channel
- 8.2.1. Hospital Pharmacies
- 8.2.2. Online Pharmacies
- 8.2.3. Other Distribution Channels
- 8.1. Market Analysis, Insights and Forecast - by Product
- 9. Middle East and Africa Home Blood Pressure Monitoring Devices Market Analysis, Insights and Forecast, 2019-2031
- 9.1. Market Analysis, Insights and Forecast - by Product
- 9.1.1. Upper Arm Monitors
- 9.1.2. Wrist Monitors
- 9.1.3. Accessories
- 9.2. Market Analysis, Insights and Forecast - by Distribution Channel
- 9.2.1. Hospital Pharmacies
- 9.2.2. Online Pharmacies
- 9.2.3. Other Distribution Channels
- 9.1. Market Analysis, Insights and Forecast - by Product
- 10. South America Home Blood Pressure Monitoring Devices Market Analysis, Insights and Forecast, 2019-2031
- 10.1. Market Analysis, Insights and Forecast - by Product
- 10.1.1. Upper Arm Monitors
- 10.1.2. Wrist Monitors
- 10.1.3. Accessories
- 10.2. Market Analysis, Insights and Forecast - by Distribution Channel
- 10.2.1. Hospital Pharmacies
- 10.2.2. Online Pharmacies
- 10.2.3. Other Distribution Channels
- 10.1. Market Analysis, Insights and Forecast - by Product
- 11. North America Home Blood Pressure Monitoring Devices Market Analysis, Insights and Forecast, 2019-2031
- 11.1. Market Analysis, Insights and Forecast - By Country/Sub-region
- 11.1.1 United States
- 11.1.2 Canada
- 11.1.3 Mexico
- 12. Europe Home Blood Pressure Monitoring Devices Market Analysis, Insights and Forecast, 2019-2031
- 12.1. Market Analysis, Insights and Forecast - By Country/Sub-region
- 12.1.1 Germany
- 12.1.2 United Kingdom
- 12.1.3 France
- 12.1.4 Italy
- 12.1.5 Spain
- 12.1.6 Rest of Europe
- 13. Asia Pacific Home Blood Pressure Monitoring Devices Market Analysis, Insights and Forecast, 2019-2031
- 13.1. Market Analysis, Insights and Forecast - By Country/Sub-region
- 13.1.1 China
- 13.1.2 Japan
- 13.1.3 India
- 13.1.4 Australia
- 13.1.5 South Korea
- 13.1.6 Rest of Asia Pacific
- 14. Middle East and Africa Home Blood Pressure Monitoring Devices Market Analysis, Insights and Forecast, 2019-2031
- 14.1. Market Analysis, Insights and Forecast - By Country/Sub-region
- 14.1.1 GCC
- 14.1.2 South Africa
- 14.1.3 Rest of Middle East and Africa
- 15. South America Home Blood Pressure Monitoring Devices Market Analysis, Insights and Forecast, 2019-2031
- 15.1. Market Analysis, Insights and Forecast - By Country/Sub-region
- 15.1.1 Brazil
- 15.1.2 Argentina
- 15.1.3 Rest of South America
- 16. Competitive Analysis
- 16.1. Global Market Share Analysis 2024
- 16.2. Company Profiles
- 16.2.1 Rossmax International Ltd
- 16.2.1.1. Overview
- 16.2.1.2. Products
- 16.2.1.3. SWOT Analysis
- 16.2.1.4. Recent Developments
- 16.2.1.5. Financials (Based on Availability)
- 16.2.2 Qardio Inc
- 16.2.2.1. Overview
- 16.2.2.2. Products
- 16.2.2.3. SWOT Analysis
- 16.2.2.4. Recent Developments
- 16.2.2.5. Financials (Based on Availability)
- 16.2.3 GE Healthcare
- 16.2.3.1. Overview
- 16.2.3.2. Products
- 16.2.3.3. SWOT Analysis
- 16.2.3.4. Recent Developments
- 16.2.3.5. Financials (Based on Availability)
- 16.2.4 Halma plc
- 16.2.4.1. Overview
- 16.2.4.2. Products
- 16.2.4.3. SWOT Analysis
- 16.2.4.4. Recent Developments
- 16.2.4.5. Financials (Based on Availability)
- 16.2.5 Koninklijke Philips N V
- 16.2.5.1. Overview
- 16.2.5.2. Products
- 16.2.5.3. SWOT Analysis
- 16.2.5.4. Recent Developments
- 16.2.5.5. Financials (Based on Availability)
- 16.2.6 Spengler SAS
- 16.2.6.1. Overview
- 16.2.6.2. Products
- 16.2.6.3. SWOT Analysis
- 16.2.6.4. Recent Developments
- 16.2.6.5. Financials (Based on Availability)
- 16.2.7 A&D Medical
- 16.2.7.1. Overview
- 16.2.7.2. Products
- 16.2.7.3. SWOT Analysis
- 16.2.7.4. Recent Developments
- 16.2.7.5. Financials (Based on Availability)
- 16.2.8 Contec Medical
- 16.2.8.1. Overview
- 16.2.8.2. Products
- 16.2.8.3. SWOT Analysis
- 16.2.8.4. Recent Developments
- 16.2.8.5. Financials (Based on Availability)
- 16.2.9 Omron Healthcare Inc
- 16.2.9.1. Overview
- 16.2.9.2. Products
- 16.2.9.3. SWOT Analysis
- 16.2.9.4. Recent Developments
- 16.2.9.5. Financials (Based on Availability)
- 16.2.10 Welch Allyn Inc
- 16.2.10.1. Overview
- 16.2.10.2. Products
- 16.2.10.3. SWOT Analysis
- 16.2.10.4. Recent Developments
- 16.2.10.5. Financials (Based on Availability)
- 16.2.11 Beurer GmbH
- 16.2.11.1. Overview
- 16.2.11.2. Products
- 16.2.11.3. SWOT Analysis
- 16.2.11.4. Recent Developments
- 16.2.11.5. Financials (Based on Availability)
- 16.2.12 American Diagnostic Corporation
- 16.2.12.1. Overview
- 16.2.12.2. Products
- 16.2.12.3. SWOT Analysis
- 16.2.12.4. Recent Developments
- 16.2.12.5. Financials (Based on Availability)
- 16.2.1 Rossmax International Ltd
List of Figures
- Figure 1: Global Home Blood Pressure Monitoring Devices Market Revenue Breakdown (Million, %) by Region 2024 & 2032
- Figure 2: Global Home Blood Pressure Monitoring Devices Market Volume Breakdown (K Unit, %) by Region 2024 & 2032
- Figure 3: North America Home Blood Pressure Monitoring Devices Market Revenue (Million), by Country 2024 & 2032
- Figure 4: North America Home Blood Pressure Monitoring Devices Market Volume (K Unit), by Country 2024 & 2032
- Figure 5: North America Home Blood Pressure Monitoring Devices Market Revenue Share (%), by Country 2024 & 2032
- Figure 6: North America Home Blood Pressure Monitoring Devices Market Volume Share (%), by Country 2024 & 2032
- Figure 7: Europe Home Blood Pressure Monitoring Devices Market Revenue (Million), by Country 2024 & 2032
- Figure 8: Europe Home Blood Pressure Monitoring Devices Market Volume (K Unit), by Country 2024 & 2032
- Figure 9: Europe Home Blood Pressure Monitoring Devices Market Revenue Share (%), by Country 2024 & 2032
- Figure 10: Europe Home Blood Pressure Monitoring Devices Market Volume Share (%), by Country 2024 & 2032
- Figure 11: Asia Pacific Home Blood Pressure Monitoring Devices Market Revenue (Million), by Country 2024 & 2032
- Figure 12: Asia Pacific Home Blood Pressure Monitoring Devices Market Volume (K Unit), by Country 2024 & 2032
- Figure 13: Asia Pacific Home Blood Pressure Monitoring Devices Market Revenue Share (%), by Country 2024 & 2032
- Figure 14: Asia Pacific Home Blood Pressure Monitoring Devices Market Volume Share (%), by Country 2024 & 2032
- Figure 15: Middle East and Africa Home Blood Pressure Monitoring Devices Market Revenue (Million), by Country 2024 & 2032
- Figure 16: Middle East and Africa Home Blood Pressure Monitoring Devices Market Volume (K Unit), by Country 2024 & 2032
- Figure 17: Middle East and Africa Home Blood Pressure Monitoring Devices Market Revenue Share (%), by Country 2024 & 2032
- Figure 18: Middle East and Africa Home Blood Pressure Monitoring Devices Market Volume Share (%), by Country 2024 & 2032
- Figure 19: South America Home Blood Pressure Monitoring Devices Market Revenue (Million), by Country 2024 & 2032
- Figure 20: South America Home Blood Pressure Monitoring Devices Market Volume (K Unit), by Country 2024 & 2032
- Figure 21: South America Home Blood Pressure Monitoring Devices Market Revenue Share (%), by Country 2024 & 2032
- Figure 22: South America Home Blood Pressure Monitoring Devices Market Volume Share (%), by Country 2024 & 2032
- Figure 23: North America Home Blood Pressure Monitoring Devices Market Revenue (Million), by Product 2024 & 2032
- Figure 24: North America Home Blood Pressure Monitoring Devices Market Volume (K Unit), by Product 2024 & 2032
- Figure 25: North America Home Blood Pressure Monitoring Devices Market Revenue Share (%), by Product 2024 & 2032
- Figure 26: North America Home Blood Pressure Monitoring Devices Market Volume Share (%), by Product 2024 & 2032
- Figure 27: North America Home Blood Pressure Monitoring Devices Market Revenue (Million), by Distribution Channel 2024 & 2032
- Figure 28: North America Home Blood Pressure Monitoring Devices Market Volume (K Unit), by Distribution Channel 2024 & 2032
- Figure 29: North America Home Blood Pressure Monitoring Devices Market Revenue Share (%), by Distribution Channel 2024 & 2032
- Figure 30: North America Home Blood Pressure Monitoring Devices Market Volume Share (%), by Distribution Channel 2024 & 2032
- Figure 31: North America Home Blood Pressure Monitoring Devices Market Revenue (Million), by Country 2024 & 2032
- Figure 32: North America Home Blood Pressure Monitoring Devices Market Volume (K Unit), by Country 2024 & 2032
- Figure 33: North America Home Blood Pressure Monitoring Devices Market Revenue Share (%), by Country 2024 & 2032
- Figure 34: North America Home Blood Pressure Monitoring Devices Market Volume Share (%), by Country 2024 & 2032
- Figure 35: Europe Home Blood Pressure Monitoring Devices Market Revenue (Million), by Product 2024 & 2032
- Figure 36: Europe Home Blood Pressure Monitoring Devices Market Volume (K Unit), by Product 2024 & 2032
- Figure 37: Europe Home Blood Pressure Monitoring Devices Market Revenue Share (%), by Product 2024 & 2032
- Figure 38: Europe Home Blood Pressure Monitoring Devices Market Volume Share (%), by Product 2024 & 2032
- Figure 39: Europe Home Blood Pressure Monitoring Devices Market Revenue (Million), by Distribution Channel 2024 & 2032
- Figure 40: Europe Home Blood Pressure Monitoring Devices Market Volume (K Unit), by Distribution Channel 2024 & 2032
- Figure 41: Europe Home Blood Pressure Monitoring Devices Market Revenue Share (%), by Distribution Channel 2024 & 2032
- Figure 42: Europe Home Blood Pressure Monitoring Devices Market Volume Share (%), by Distribution Channel 2024 & 2032
- Figure 43: Europe Home Blood Pressure Monitoring Devices Market Revenue (Million), by Country 2024 & 2032
- Figure 44: Europe Home Blood Pressure Monitoring Devices Market Volume (K Unit), by Country 2024 & 2032
- Figure 45: Europe Home Blood Pressure Monitoring Devices Market Revenue Share (%), by Country 2024 & 2032
- Figure 46: Europe Home Blood Pressure Monitoring Devices Market Volume Share (%), by Country 2024 & 2032
- Figure 47: Asia Pacific Home Blood Pressure Monitoring Devices Market Revenue (Million), by Product 2024 & 2032
- Figure 48: Asia Pacific Home Blood Pressure Monitoring Devices Market Volume (K Unit), by Product 2024 & 2032
- Figure 49: Asia Pacific Home Blood Pressure Monitoring Devices Market Revenue Share (%), by Product 2024 & 2032
- Figure 50: Asia Pacific Home Blood Pressure Monitoring Devices Market Volume Share (%), by Product 2024 & 2032
- Figure 51: Asia Pacific Home Blood Pressure Monitoring Devices Market Revenue (Million), by Distribution Channel 2024 & 2032
- Figure 52: Asia Pacific Home Blood Pressure Monitoring Devices Market Volume (K Unit), by Distribution Channel 2024 & 2032
- Figure 53: Asia Pacific Home Blood Pressure Monitoring Devices Market Revenue Share (%), by Distribution Channel 2024 & 2032
- Figure 54: Asia Pacific Home Blood Pressure Monitoring Devices Market Volume Share (%), by Distribution Channel 2024 & 2032
- Figure 55: Asia Pacific Home Blood Pressure Monitoring Devices Market Revenue (Million), by Country 2024 & 2032
- Figure 56: Asia Pacific Home Blood Pressure Monitoring Devices Market Volume (K Unit), by Country 2024 & 2032
- Figure 57: Asia Pacific Home Blood Pressure Monitoring Devices Market Revenue Share (%), by Country 2024 & 2032
- Figure 58: Asia Pacific Home Blood Pressure Monitoring Devices Market Volume Share (%), by Country 2024 & 2032
- Figure 59: Middle East and Africa Home Blood Pressure Monitoring Devices Market Revenue (Million), by Product 2024 & 2032
- Figure 60: Middle East and Africa Home Blood Pressure Monitoring Devices Market Volume (K Unit), by Product 2024 & 2032
- Figure 61: Middle East and Africa Home Blood Pressure Monitoring Devices Market Revenue Share (%), by Product 2024 & 2032
- Figure 62: Middle East and Africa Home Blood Pressure Monitoring Devices Market Volume Share (%), by Product 2024 & 2032
- Figure 63: Middle East and Africa Home Blood Pressure Monitoring Devices Market Revenue (Million), by Distribution Channel 2024 & 2032
- Figure 64: Middle East and Africa Home Blood Pressure Monitoring Devices Market Volume (K Unit), by Distribution Channel 2024 & 2032
- Figure 65: Middle East and Africa Home Blood Pressure Monitoring Devices Market Revenue Share (%), by Distribution Channel 2024 & 2032
- Figure 66: Middle East and Africa Home Blood Pressure Monitoring Devices Market Volume Share (%), by Distribution Channel 2024 & 2032
- Figure 67: Middle East and Africa Home Blood Pressure Monitoring Devices Market Revenue (Million), by Country 2024 & 2032
- Figure 68: Middle East and Africa Home Blood Pressure Monitoring Devices Market Volume (K Unit), by Country 2024 & 2032
- Figure 69: Middle East and Africa Home Blood Pressure Monitoring Devices Market Revenue Share (%), by Country 2024 & 2032
- Figure 70: Middle East and Africa Home Blood Pressure Monitoring Devices Market Volume Share (%), by Country 2024 & 2032
- Figure 71: South America Home Blood Pressure Monitoring Devices Market Revenue (Million), by Product 2024 & 2032
- Figure 72: South America Home Blood Pressure Monitoring Devices Market Volume (K Unit), by Product 2024 & 2032
- Figure 73: South America Home Blood Pressure Monitoring Devices Market Revenue Share (%), by Product 2024 & 2032
- Figure 74: South America Home Blood Pressure Monitoring Devices Market Volume Share (%), by Product 2024 & 2032
- Figure 75: South America Home Blood Pressure Monitoring Devices Market Revenue (Million), by Distribution Channel 2024 & 2032
- Figure 76: South America Home Blood Pressure Monitoring Devices Market Volume (K Unit), by Distribution Channel 2024 & 2032
- Figure 77: South America Home Blood Pressure Monitoring Devices Market Revenue Share (%), by Distribution Channel 2024 & 2032
- Figure 78: South America Home Blood Pressure Monitoring Devices Market Volume Share (%), by Distribution Channel 2024 & 2032
- Figure 79: South America Home Blood Pressure Monitoring Devices Market Revenue (Million), by Country 2024 & 2032
- Figure 80: South America Home Blood Pressure Monitoring Devices Market Volume (K Unit), by Country 2024 & 2032
- Figure 81: South America Home Blood Pressure Monitoring Devices Market Revenue Share (%), by Country 2024 & 2032
- Figure 82: South America Home Blood Pressure Monitoring Devices Market Volume Share (%), by Country 2024 & 2032
List of Tables
- Table 1: Global Home Blood Pressure Monitoring Devices Market Revenue Million Forecast, by Region 2019 & 2032
- Table 2: Global Home Blood Pressure Monitoring Devices Market Volume K Unit Forecast, by Region 2019 & 2032
- Table 3: Global Home Blood Pressure Monitoring Devices Market Revenue Million Forecast, by Product 2019 & 2032
- Table 4: Global Home Blood Pressure Monitoring Devices Market Volume K Unit Forecast, by Product 2019 & 2032
- Table 5: Global Home Blood Pressure Monitoring Devices Market Revenue Million Forecast, by Distribution Channel 2019 & 2032
- Table 6: Global Home Blood Pressure Monitoring Devices Market Volume K Unit Forecast, by Distribution Channel 2019 & 2032
- Table 7: Global Home Blood Pressure Monitoring Devices Market Revenue Million Forecast, by Region 2019 & 2032
- Table 8: Global Home Blood Pressure Monitoring Devices Market Volume K Unit Forecast, by Region 2019 & 2032
- Table 9: Global Home Blood Pressure Monitoring Devices Market Revenue Million Forecast, by Country 2019 & 2032
- Table 10: Global Home Blood Pressure Monitoring Devices Market Volume K Unit Forecast, by Country 2019 & 2032
- Table 11: United States Home Blood Pressure Monitoring Devices Market Revenue (Million) Forecast, by Application 2019 & 2032
- Table 12: United States Home Blood Pressure Monitoring Devices Market Volume (K Unit) Forecast, by Application 2019 & 2032
- Table 13: Canada Home Blood Pressure Monitoring Devices Market Revenue (Million) Forecast, by Application 2019 & 2032
- Table 14: Canada Home Blood Pressure Monitoring Devices Market Volume (K Unit) Forecast, by Application 2019 & 2032
- Table 15: Mexico Home Blood Pressure Monitoring Devices Market Revenue (Million) Forecast, by Application 2019 & 2032
- Table 16: Mexico Home Blood Pressure Monitoring Devices Market Volume (K Unit) Forecast, by Application 2019 & 2032
- Table 17: Global Home Blood Pressure Monitoring Devices Market Revenue Million Forecast, by Country 2019 & 2032
- Table 18: Global Home Blood Pressure Monitoring Devices Market Volume K Unit Forecast, by Country 2019 & 2032
- Table 19: Germany Home Blood Pressure Monitoring Devices Market Revenue (Million) Forecast, by Application 2019 & 2032
- Table 20: Germany Home Blood Pressure Monitoring Devices Market Volume (K Unit) Forecast, by Application 2019 & 2032
- Table 21: United Kingdom Home Blood Pressure Monitoring Devices Market Revenue (Million) Forecast, by Application 2019 & 2032
- Table 22: United Kingdom Home Blood Pressure Monitoring Devices Market Volume (K Unit) Forecast, by Application 2019 & 2032
- Table 23: France Home Blood Pressure Monitoring Devices Market Revenue (Million) Forecast, by Application 2019 & 2032
- Table 24: France Home Blood Pressure Monitoring Devices Market Volume (K Unit) Forecast, by Application 2019 & 2032
- Table 25: Italy Home Blood Pressure Monitoring Devices Market Revenue (Million) Forecast, by Application 2019 & 2032
- Table 26: Italy Home Blood Pressure Monitoring Devices Market Volume (K Unit) Forecast, by Application 2019 & 2032
- Table 27: Spain Home Blood Pressure Monitoring Devices Market Revenue (Million) Forecast, by Application 2019 & 2032
- Table 28: Spain Home Blood Pressure Monitoring Devices Market Volume (K Unit) Forecast, by Application 2019 & 2032
- Table 29: Rest of Europe Home Blood Pressure Monitoring Devices Market Revenue (Million) Forecast, by Application 2019 & 2032
- Table 30: Rest of Europe Home Blood Pressure Monitoring Devices Market Volume (K Unit) Forecast, by Application 2019 & 2032
- Table 31: Global Home Blood Pressure Monitoring Devices Market Revenue Million Forecast, by Country 2019 & 2032
- Table 32: Global Home Blood Pressure Monitoring Devices Market Volume K Unit Forecast, by Country 2019 & 2032
- Table 33: China Home Blood Pressure Monitoring Devices Market Revenue (Million) Forecast, by Application 2019 & 2032
- Table 34: China Home Blood Pressure Monitoring Devices Market Volume (K Unit) Forecast, by Application 2019 & 2032
- Table 35: Japan Home Blood Pressure Monitoring Devices Market Revenue (Million) Forecast, by Application 2019 & 2032
- Table 36: Japan Home Blood Pressure Monitoring Devices Market Volume (K Unit) Forecast, by Application 2019 & 2032
- Table 37: India Home Blood Pressure Monitoring Devices Market Revenue (Million) Forecast, by Application 2019 & 2032
- Table 38: India Home Blood Pressure Monitoring Devices Market Volume (K Unit) Forecast, by Application 2019 & 2032
- Table 39: Australia Home Blood Pressure Monitoring Devices Market Revenue (Million) Forecast, by Application 2019 & 2032
- Table 40: Australia Home Blood Pressure Monitoring Devices Market Volume (K Unit) Forecast, by Application 2019 & 2032
- Table 41: South Korea Home Blood Pressure Monitoring Devices Market Revenue (Million) Forecast, by Application 2019 & 2032
- Table 42: South Korea Home Blood Pressure Monitoring Devices Market Volume (K Unit) Forecast, by Application 2019 & 2032
- Table 43: Rest of Asia Pacific Home Blood Pressure Monitoring Devices Market Revenue (Million) Forecast, by Application 2019 & 2032
- Table 44: Rest of Asia Pacific Home Blood Pressure Monitoring Devices Market Volume (K Unit) Forecast, by Application 2019 & 2032
- Table 45: Global Home Blood Pressure Monitoring Devices Market Revenue Million Forecast, by Country 2019 & 2032
- Table 46: Global Home Blood Pressure Monitoring Devices Market Volume K Unit Forecast, by Country 2019 & 2032
- Table 47: GCC Home Blood Pressure Monitoring Devices Market Revenue (Million) Forecast, by Application 2019 & 2032
- Table 48: GCC Home Blood Pressure Monitoring Devices Market Volume (K Unit) Forecast, by Application 2019 & 2032
- Table 49: South Africa Home Blood Pressure Monitoring Devices Market Revenue (Million) Forecast, by Application 2019 & 2032
- Table 50: South Africa Home Blood Pressure Monitoring Devices Market Volume (K Unit) Forecast, by Application 2019 & 2032
- Table 51: Rest of Middle East and Africa Home Blood Pressure Monitoring Devices Market Revenue (Million) Forecast, by Application 2019 & 2032
- Table 52: Rest of Middle East and Africa Home Blood Pressure Monitoring Devices Market Volume (K Unit) Forecast, by Application 2019 & 2032
- Table 53: Global Home Blood Pressure Monitoring Devices Market Revenue Million Forecast, by Country 2019 & 2032
- Table 54: Global Home Blood Pressure Monitoring Devices Market Volume K Unit Forecast, by Country 2019 & 2032
- Table 55: Brazil Home Blood Pressure Monitoring Devices Market Revenue (Million) Forecast, by Application 2019 & 2032
- Table 56: Brazil Home Blood Pressure Monitoring Devices Market Volume (K Unit) Forecast, by Application 2019 & 2032
- Table 57: Argentina Home Blood Pressure Monitoring Devices Market Revenue (Million) Forecast, by Application 2019 & 2032
- Table 58: Argentina Home Blood Pressure Monitoring Devices Market Volume (K Unit) Forecast, by Application 2019 & 2032
- Table 59: Rest of South America Home Blood Pressure Monitoring Devices Market Revenue (Million) Forecast, by Application 2019 & 2032
- Table 60: Rest of South America Home Blood Pressure Monitoring Devices Market Volume (K Unit) Forecast, by Application 2019 & 2032
- Table 61: Global Home Blood Pressure Monitoring Devices Market Revenue Million Forecast, by Product 2019 & 2032
- Table 62: Global Home Blood Pressure Monitoring Devices Market Volume K Unit Forecast, by Product 2019 & 2032
- Table 63: Global Home Blood Pressure Monitoring Devices Market Revenue Million Forecast, by Distribution Channel 2019 & 2032
- Table 64: Global Home Blood Pressure Monitoring Devices Market Volume K Unit Forecast, by Distribution Channel 2019 & 2032
- Table 65: Global Home Blood Pressure Monitoring Devices Market Revenue Million Forecast, by Country 2019 & 2032
- Table 66: Global Home Blood Pressure Monitoring Devices Market Volume K Unit Forecast, by Country 2019 & 2032
- Table 67: United States Home Blood Pressure Monitoring Devices Market Revenue (Million) Forecast, by Application 2019 & 2032
- Table 68: United States Home Blood Pressure Monitoring Devices Market Volume (K Unit) Forecast, by Application 2019 & 2032
- Table 69: Canada Home Blood Pressure Monitoring Devices Market Revenue (Million) Forecast, by Application 2019 & 2032
- Table 70: Canada Home Blood Pressure Monitoring Devices Market Volume (K Unit) Forecast, by Application 2019 & 2032
- Table 71: Mexico Home Blood Pressure Monitoring Devices Market Revenue (Million) Forecast, by Application 2019 & 2032
- Table 72: Mexico Home Blood Pressure Monitoring Devices Market Volume (K Unit) Forecast, by Application 2019 & 2032
- Table 73: Global Home Blood Pressure Monitoring Devices Market Revenue Million Forecast, by Product 2019 & 2032
- Table 74: Global Home Blood Pressure Monitoring Devices Market Volume K Unit Forecast, by Product 2019 & 2032
- Table 75: Global Home Blood Pressure Monitoring Devices Market Revenue Million Forecast, by Distribution Channel 2019 & 2032
- Table 76: Global Home Blood Pressure Monitoring Devices Market Volume K Unit Forecast, by Distribution Channel 2019 & 2032
- Table 77: Global Home Blood Pressure Monitoring Devices Market Revenue Million Forecast, by Country 2019 & 2032
- Table 78: Global Home Blood Pressure Monitoring Devices Market Volume K Unit Forecast, by Country 2019 & 2032
- Table 79: Germany Home Blood Pressure Monitoring Devices Market Revenue (Million) Forecast, by Application 2019 & 2032
- Table 80: Germany Home Blood Pressure Monitoring Devices Market Volume (K Unit) Forecast, by Application 2019 & 2032
- Table 81: United Kingdom Home Blood Pressure Monitoring Devices Market Revenue (Million) Forecast, by Application 2019 & 2032
- Table 82: United Kingdom Home Blood Pressure Monitoring Devices Market Volume (K Unit) Forecast, by Application 2019 & 2032
- Table 83: France Home Blood Pressure Monitoring Devices Market Revenue (Million) Forecast, by Application 2019 & 2032
- Table 84: France Home Blood Pressure Monitoring Devices Market Volume (K Unit) Forecast, by Application 2019 & 2032
- Table 85: Italy Home Blood Pressure Monitoring Devices Market Revenue (Million) Forecast, by Application 2019 & 2032
- Table 86: Italy Home Blood Pressure Monitoring Devices Market Volume (K Unit) Forecast, by Application 2019 & 2032
- Table 87: Spain Home Blood Pressure Monitoring Devices Market Revenue (Million) Forecast, by Application 2019 & 2032
- Table 88: Spain Home Blood Pressure Monitoring Devices Market Volume (K Unit) Forecast, by Application 2019 & 2032
- Table 89: Rest of Europe Home Blood Pressure Monitoring Devices Market Revenue (Million) Forecast, by Application 2019 & 2032
- Table 90: Rest of Europe Home Blood Pressure Monitoring Devices Market Volume (K Unit) Forecast, by Application 2019 & 2032
- Table 91: Global Home Blood Pressure Monitoring Devices Market Revenue Million Forecast, by Product 2019 & 2032
- Table 92: Global Home Blood Pressure Monitoring Devices Market Volume K Unit Forecast, by Product 2019 & 2032
- Table 93: Global Home Blood Pressure Monitoring Devices Market Revenue Million Forecast, by Distribution Channel 2019 & 2032
- Table 94: Global Home Blood Pressure Monitoring Devices Market Volume K Unit Forecast, by Distribution Channel 2019 & 2032
- Table 95: Global Home Blood Pressure Monitoring Devices Market Revenue Million Forecast, by Country 2019 & 2032
- Table 96: Global Home Blood Pressure Monitoring Devices Market Volume K Unit Forecast, by Country 2019 & 2032
- Table 97: China Home Blood Pressure Monitoring Devices Market Revenue (Million) Forecast, by Application 2019 & 2032
- Table 98: China Home Blood Pressure Monitoring Devices Market Volume (K Unit) Forecast, by Application 2019 & 2032
- Table 99: Japan Home Blood Pressure Monitoring Devices Market Revenue (Million) Forecast, by Application 2019 & 2032
- Table 100: Japan Home Blood Pressure Monitoring Devices Market Volume (K Unit) Forecast, by Application 2019 & 2032
- Table 101: India Home Blood Pressure Monitoring Devices Market Revenue (Million) Forecast, by Application 2019 & 2032
- Table 102: India Home Blood Pressure Monitoring Devices Market Volume (K Unit) Forecast, by Application 2019 & 2032
- Table 103: Australia Home Blood Pressure Monitoring Devices Market Revenue (Million) Forecast, by Application 2019 & 2032
- Table 104: Australia Home Blood Pressure Monitoring Devices Market Volume (K Unit) Forecast, by Application 2019 & 2032
- Table 105: South Korea Home Blood Pressure Monitoring Devices Market Revenue (Million) Forecast, by Application 2019 & 2032
- Table 106: South Korea Home Blood Pressure Monitoring Devices Market Volume (K Unit) Forecast, by Application 2019 & 2032
- Table 107: Rest of Asia Pacific Home Blood Pressure Monitoring Devices Market Revenue (Million) Forecast, by Application 2019 & 2032
- Table 108: Rest of Asia Pacific Home Blood Pressure Monitoring Devices Market Volume (K Unit) Forecast, by Application 2019 & 2032
- Table 109: Global Home Blood Pressure Monitoring Devices Market Revenue Million Forecast, by Product 2019 & 2032
- Table 110: Global Home Blood Pressure Monitoring Devices Market Volume K Unit Forecast, by Product 2019 & 2032
- Table 111: Global Home Blood Pressure Monitoring Devices Market Revenue Million Forecast, by Distribution Channel 2019 & 2032
- Table 112: Global Home Blood Pressure Monitoring Devices Market Volume K Unit Forecast, by Distribution Channel 2019 & 2032
- Table 113: Global Home Blood Pressure Monitoring Devices Market Revenue Million Forecast, by Country 2019 & 2032
- Table 114: Global Home Blood Pressure Monitoring Devices Market Volume K Unit Forecast, by Country 2019 & 2032
- Table 115: GCC Home Blood Pressure Monitoring Devices Market Revenue (Million) Forecast, by Application 2019 & 2032
- Table 116: GCC Home Blood Pressure Monitoring Devices Market Volume (K Unit) Forecast, by Application 2019 & 2032
- Table 117: South Africa Home Blood Pressure Monitoring Devices Market Revenue (Million) Forecast, by Application 2019 & 2032
- Table 118: South Africa Home Blood Pressure Monitoring Devices Market Volume (K Unit) Forecast, by Application 2019 & 2032
- Table 119: Rest of Middle East and Africa Home Blood Pressure Monitoring Devices Market Revenue (Million) Forecast, by Application 2019 & 2032
- Table 120: Rest of Middle East and Africa Home Blood Pressure Monitoring Devices Market Volume (K Unit) Forecast, by Application 2019 & 2032
- Table 121: Global Home Blood Pressure Monitoring Devices Market Revenue Million Forecast, by Product 2019 & 2032
- Table 122: Global Home Blood Pressure Monitoring Devices Market Volume K Unit Forecast, by Product 2019 & 2032
- Table 123: Global Home Blood Pressure Monitoring Devices Market Revenue Million Forecast, by Distribution Channel 2019 & 2032
- Table 124: Global Home Blood Pressure Monitoring Devices Market Volume K Unit Forecast, by Distribution Channel 2019 & 2032
- Table 125: Global Home Blood Pressure Monitoring Devices Market Revenue Million Forecast, by Country 2019 & 2032
- Table 126: Global Home Blood Pressure Monitoring Devices Market Volume K Unit Forecast, by Country 2019 & 2032
- Table 127: Brazil Home Blood Pressure Monitoring Devices Market Revenue (Million) Forecast, by Application 2019 & 2032
- Table 128: Brazil Home Blood Pressure Monitoring Devices Market Volume (K Unit) Forecast, by Application 2019 & 2032
- Table 129: Argentina Home Blood Pressure Monitoring Devices Market Revenue (Million) Forecast, by Application 2019 & 2032
- Table 130: Argentina Home Blood Pressure Monitoring Devices Market Volume (K Unit) Forecast, by Application 2019 & 2032
- Table 131: Rest of South America Home Blood Pressure Monitoring Devices Market Revenue (Million) Forecast, by Application 2019 & 2032
- Table 132: Rest of South America Home Blood Pressure Monitoring Devices Market Volume (K Unit) Forecast, by Application 2019 & 2032
Frequently Asked Questions
1. What is the projected Compound Annual Growth Rate (CAGR) of the Home Blood Pressure Monitoring Devices Market?
The projected CAGR is approximately 10.54%.
2. Which companies are prominent players in the Home Blood Pressure Monitoring Devices Market?
Key companies in the market include Rossmax International Ltd, Qardio Inc, GE Healthcare, Halma plc, Koninklijke Philips N V, Spengler SAS, A&D Medical, Contec Medical, Omron Healthcare Inc, Welch Allyn Inc, Beurer GmbH, American Diagnostic Corporation.
3. What are the main segments of the Home Blood Pressure Monitoring Devices Market?
The market segments include Product, Distribution Channel.
4. Can you provide details about the market size?
The market size is estimated to be USD 1.25 Million as of 2022.
5. What are some drivers contributing to market growth?
Growing Burden of Blood Pressure-Related Diseases; Rise in the Use of Home Blood Pressure Monitors and Active Promotions; Advancements in the Devices.
6. What are the notable trends driving market growth?
Wrist Monitors Segment is Dominating the Home Blood Pressure Monitoring Devices Market.
7. Are there any restraints impacting market growth?
High Cost and Accuracy of Devices.
8. Can you provide examples of recent developments in the market?
July 2022: LiveMetric launched LiveOne, a nano-sensor technology for monitoring blood pressure every 10 seconds. LiveOne is a wrist-worn, cuff-free solution that gives real-time measurements for better care and management of people with hypertension and cardiovascular disorders.
9. What pricing options are available for accessing the report?
Pricing options include single-user, multi-user, and enterprise licenses priced at USD 4750, USD 5250, and USD 8750 respectively.
10. Is the market size provided in terms of value or volume?
The market size is provided in terms of value, measured in Million and volume, measured in K Unit.
11. Are there any specific market keywords associated with the report?
Yes, the market keyword associated with the report is "Home Blood Pressure Monitoring Devices Market," which aids in identifying and referencing the specific market segment covered.
12. How do I determine which pricing option suits my needs best?
The pricing options vary based on user requirements and access needs. Individual users may opt for single-user licenses, while businesses requiring broader access may choose multi-user or enterprise licenses for cost-effective access to the report.
13. Are there any additional resources or data provided in the Home Blood Pressure Monitoring Devices Market report?
While the report offers comprehensive insights, it's advisable to review the specific contents or supplementary materials provided to ascertain if additional resources or data are available.
14. How can I stay updated on further developments or reports in the Home Blood Pressure Monitoring Devices Market?
To stay informed about further developments, trends, and reports in the Home Blood Pressure Monitoring Devices Market, consider subscribing to industry newsletters, following relevant companies and organizations, or regularly checking reputable industry news sources and publications.
Methodology
Step 1 - Identification of Relevant Samples Size from Population Database


Step 2 - Approaches for Defining Global Market Size (Value, Volume* & Price*)

Note*: In applicable scenarios
Step 3 - Data Sources
Primary Research
- Web Analytics
- Survey Reports
- Research Institute
- Latest Research Reports
- Opinion Leaders
Secondary Research
- Annual Reports
- White Paper
- Latest Press Release
- Industry Association
- Paid Database
- Investor Presentations

Step 4 - Data Triangulation
Involves using different sources of information in order to increase the validity of a study
These sources are likely to be stakeholders in a program - participants, other researchers, program staff, other community members, and so on.
Then we put all data in single framework & apply various statistical tools to find out the dynamic on the market.
During the analysis stage, feedback from the stakeholder groups would be compared to determine areas of agreement as well as areas of divergence
