

Key Insights
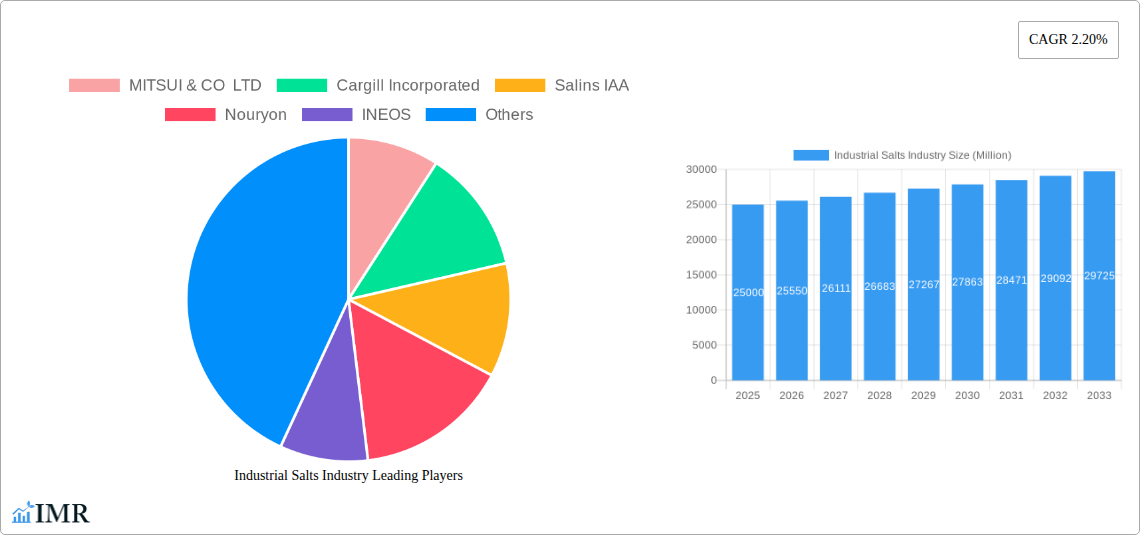
The global industrial salts market, valued at approximately $XX million in 2025, is projected to experience steady growth, driven primarily by increasing demand across diverse sectors. The Compound Annual Growth Rate (CAGR) of 2.20% from 2025 to 2033 indicates a sustained, albeit moderate, expansion. Key drivers include the burgeoning chemical processing industry, the escalating need for water treatment solutions in both developed and developing nations, and the rising utilization of de-icing salts in infrastructure management, particularly in regions with harsh winters. Furthermore, growth is fueled by increasing demand from the food processing, oil & gas, and agricultural sectors, where salt plays a crucial role in various processes and applications. While the market faces restraints such as fluctuating raw material prices and environmental concerns related to salt mining and its downstream impacts, innovative extraction techniques like solar evaporation and vacuum evaporation are expected to mitigate some of these challenges and enhance operational efficiency. The market segmentation, encompassing various sources (Rock Salt, Natural Brine) and applications, indicates a diversified landscape with opportunities for specialized salt products and tailored solutions.
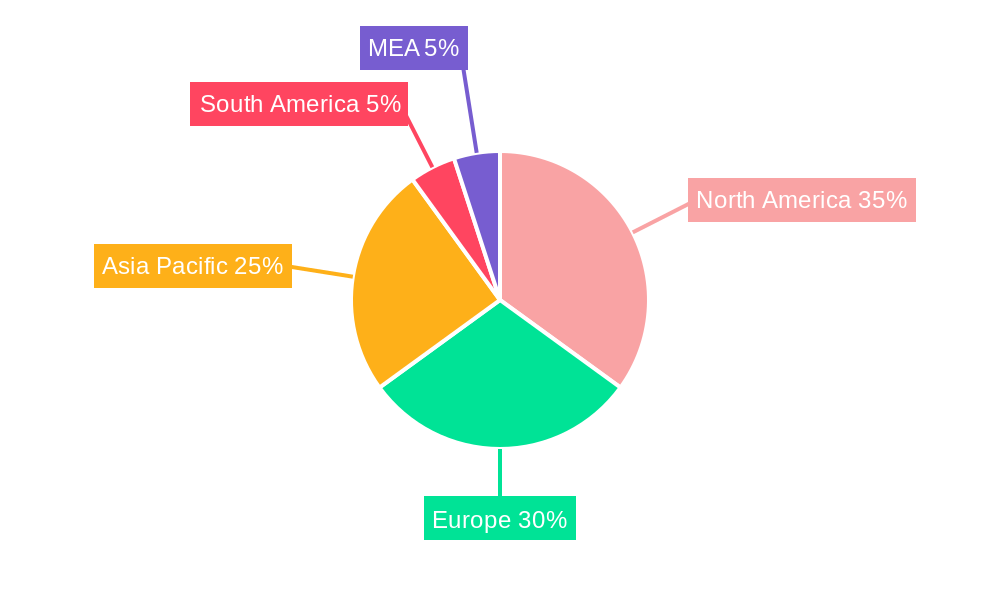
The market's regional distribution reveals significant contributions from North America and Europe, largely due to established industrial bases and robust infrastructure. However, Asia-Pacific is anticipated to exhibit substantial growth over the forecast period, driven by rapid industrialization and urbanization in countries like China and India. Competition in the market is intense, with major players such as Cargill, K+S, and Compass Minerals dominating the global landscape. These companies are strategically focusing on expansion, technological advancements, and strategic partnerships to secure a larger market share and cater to the evolving needs of diverse industries. The increasing emphasis on sustainability and environmentally friendly practices within the industry will likely shape future market dynamics, influencing both production processes and product development. This could lead to opportunities for companies adopting eco-friendly mining techniques and promoting responsible salt utilization across various applications.
Industrial Salts Industry Market Report: 2019-2033
This comprehensive report provides a detailed analysis of the global industrial salts market, encompassing market dynamics, growth trends, regional landscapes, product innovations, key players, and future outlook. The report covers the period from 2019 to 2033, with a focus on the forecast period of 2025-2033 and a base year of 2025. The analysis delves into various market segments including source (rock salt, natural brine), manufacturing process (solar evaporation, vacuum evaporation, conventional mining), and application (chemical processing, water treatment, de-icing, agriculture, food processing, oil and gas, other applications). This report is essential for industry professionals, investors, and researchers seeking a thorough understanding of this vital market.
Industrial Salts Industry Market Dynamics & Structure
The industrial salts market is characterized by a moderately concentrated structure with several major players holding significant market share. The market is driven by technological innovation in extraction and processing, particularly in enhancing efficiency and reducing environmental impact. Stringent regulatory frameworks concerning environmental protection and product purity influence production methods and market access. Competitive product substitutes, such as alternative de-icers and chemical reagents, present challenges. End-user demographics vary widely across applications, with chemical processing and de-icing segments representing significant volumes. Mergers and acquisitions (M&A) activity has played a role in market consolidation, with larger companies acquiring smaller players to expand their reach and production capacity.
- Market Concentration: xx% market share held by top 5 players (2025 estimate).
- Technological Innovation: Focus on automation, waste reduction, and energy efficiency in production processes.
- Regulatory Landscape: Stringent regulations on water usage and environmental pollution vary regionally.
- Competitive Substitutes: Emergence of alternative de-icers and specialized chemicals impacting certain segments.
- M&A Activity: xx major M&A deals in the last 5 years, indicating a trend toward consolidation. (Example: Tata Chemicals' intended acquisition of Archean Group's industrial salt unit).
Industrial Salts Industry Growth Trends & Insights
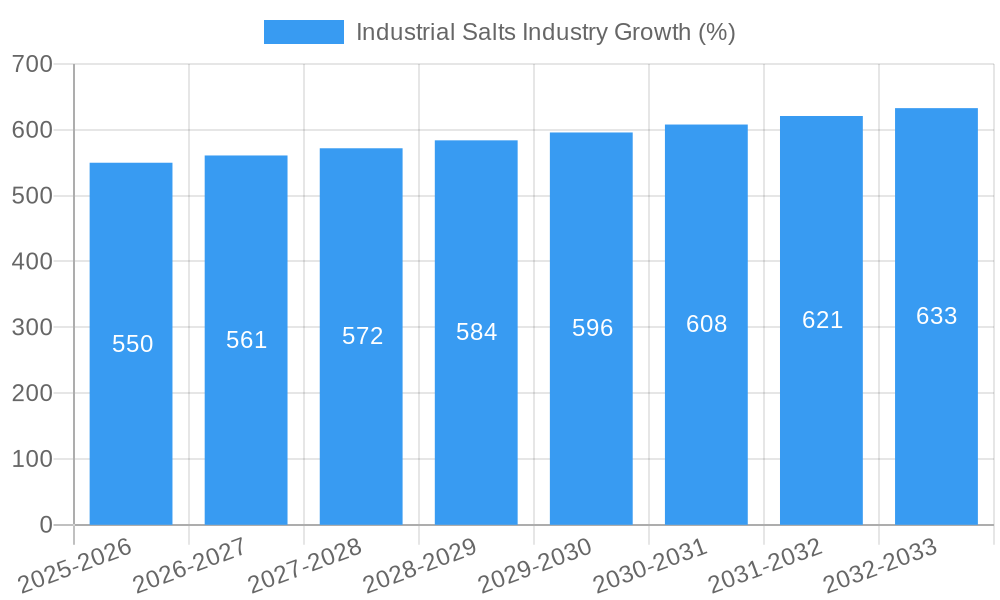
The global industrial salts market experienced robust growth during the historical period (2019-2024) and is projected to maintain a significant Compound Annual Growth Rate (CAGR) of xx% during the forecast period (2025-2033). This growth is driven by several factors, including rising demand from key end-use sectors such as chemical processing, water treatment, and de-icing, particularly in developing economies. Technological advancements in extraction techniques, and the increasing adoption of efficient and sustainable production methods are contributing to market expansion. Consumer behavior shifts towards environmentally friendly products are influencing the market positively. Market penetration is highest in developed economies, but significant growth potential exists in emerging markets with burgeoning infrastructure development and industrialization.
Dominant Regions, Countries, or Segments in Industrial Salts Industry
The industrial salts market exhibits regional variations driven by factors such as resource availability, industrial activity, and government policies. [Region X] currently dominates the global market, accounting for xx% of total volume in 2025, primarily due to its vast reserves of rock salt and a strong chemical processing industry. [Country Y] holds a significant position within this region, benefiting from established infrastructure and favorable economic conditions. The rock salt segment accounts for the largest portion (xx%) of the market, followed by brine (xx%). Within application segments, chemical processing and de-icing dominate, however, food processing and water treatment sectors are showing promising growth.
- Key Drivers: Abundant natural resources, robust industrial infrastructure, and supportive government policies driving growth in [Region X].
- Dominance Factors: High production capacity, established supply chains, and strong local demand.
- Growth Potential: Emerging markets in [Region Z] and [Country A] offer significant growth opportunities due to rapid industrialization and infrastructure development.
Industrial Salts Industry Product Landscape
The industrial salts market offers a range of products tailored to specific applications, with a focus on purity, particle size, and other performance characteristics. Technological advancements have led to the development of specialized salts with enhanced properties for particular applications, such as food-grade salts with specific mineral compositions or industrial salts with improved solubility. Innovation centers around improving efficiency and sustainability of production processes, reducing environmental impact, and meeting stricter regulatory requirements. Companies are focusing on value-added services like customized packaging and logistical solutions to cater to specific customer needs.
Key Drivers, Barriers & Challenges in Industrial Salts Industry
Key Drivers: The industrial salts market is propelled by the growing demand from various sectors, including chemical processing (xx Million tons projected in 2033), water treatment, and de-icing, fueled by industrialization and infrastructure development. Technological advancements in extraction and processing techniques enhance efficiency and reduce costs, further driving market growth. Favorable government policies in some regions promote the development of the industry.
Challenges: Supply chain disruptions, particularly in raw material sourcing and transportation, pose significant challenges. Strict environmental regulations and increasing energy costs can impact profitability. Intense competition among established players and the emergence of new entrants creates pressure on pricing and market share.
Emerging Opportunities in Industrial Salts Industry
The industrial salts market presents several emerging opportunities. The growing demand for specialized salts in niche applications like pharmaceuticals and cosmetics provides potential for growth. The development of sustainable and environmentally friendly production methods is becoming increasingly important, opening up opportunities for companies adopting green technologies. Untapped markets in developing countries with expanding industrial sectors offer significant growth prospects.
Growth Accelerators in the Industrial Salts Industry
Long-term growth in the industrial salts market will be driven by several factors. Continued technological advancements in extraction and processing methods will improve efficiency and reduce costs. Strategic partnerships between manufacturers and end-users can lead to innovation and market expansion. Government initiatives promoting sustainable practices within the industry can stimulate market growth. Expansion into new markets with growing demand for industrial salts, particularly in developing economies, offers significant potential.
Key Players Shaping the Industrial Salts Industry Market
- MITSUI & CO LTD
- Cargill Incorporated
- Salins IAA
- Nouryon
- INEOS
- Tata Chemicals Ltd
- Archean Group
- Donald Brown Group
- Rio Tinto
- Delmon Group of Companies
- K+S Aktiengesellschaft
- Morton Salt Inc
- Exportadora de Sal de CV
- Compass Minerals
- Dominion Salt Limited
Notable Milestones in Industrial Salts Industry Sector
- January 2021: Tata Chemicals Ltd intended to acquire Archean Group's industrial salt unit (3 million tons annual capacity).
- June 2018: INEOS Salt implemented a new salt handling system supplied by Ajax Equipment at their Runcorn facility, optimizing salt tablet production (up to 500 kilotons annually).
In-Depth Industrial Salts Industry Market Outlook
The industrial salts market is poised for continued growth, driven by increasing industrialization and urbanization globally. The focus on sustainable production methods, technological advancements, and strategic partnerships will shape the future market landscape. Expanding into new and emerging markets, particularly in developing economies with rapid industrialization, will present significant opportunities for growth and market share expansion. Companies that invest in innovation and adopt sustainable practices will be best positioned for success in this dynamic market.
Industrial Salts Industry Segmentation
-
1. Source
- 1.1. Rock Salt
- 1.2. Natural Brine
-
2. Manufacturing Process
- 2.1. Solar Evaporation
- 2.2. Vacuum Evaporation
- 2.3. Conventional Mining
-
3. Application
- 3.1. Chemical Processing
- 3.2. Water Treatment
- 3.3. De-icing
- 3.4. Agriculture
- 3.5. Food Processing
- 3.6. Oil and Gas
- 3.7. Other Applications
Industrial Salts Industry Segmentation By Geography
-
1. Asia Pacific
- 1.1. China
- 1.2. India
- 1.3. Japan
- 1.4. South Korea
- 1.5. Rest of Asia Pacific
-
2. North America
- 2.1. United States
- 2.2. Canada
- 2.3. Mexico
-
3. Europe
- 3.1. Germany
- 3.2. United Kingdom
- 3.3. France
- 3.4. Italy
- 3.5. Rest of Europe
-
4. South America
- 4.1. Brazil
- 4.2. Argentina
- 4.3. Rest of South America
-
5. Middle East and Africa
- 5.1. Saudi Arabia
- 5.2. South Africa
- 5.3. Rest of Middle East and Africa
Industrial Salts Industry REPORT HIGHLIGHTS
| Aspects | Details |
|---|---|
| Study Period | 2019-2033 |
| Base Year | 2024 |
| Estimated Year | 2025 |
| Forecast Period | 2025-2033 |
| Historical Period | 2019-2024 |
| Growth Rate | CAGR of 2.20% from 2019-2033 |
| Segmentation |
|
Table of Contents
- 1. Introduction
- 1.1. Research Scope
- 1.2. Market Segmentation
- 1.3. Research Methodology
- 1.4. Definitions and Assumptions
- 2. Executive Summary
- 2.1. Introduction
- 3. Market Dynamics
- 3.1. Introduction
- 3.2. Market Drivers
- 3.2.1. Increasing Demand in Chemical Processing; Growing Demand from Water Treatment
- 3.3. Market Restrains
- 3.3.1. Stringent Government Regulations; Unfavorable Conditions Arising due to the Impact of COVID-19
- 3.4. Market Trends
- 3.4.1. Increasing Demand from Chemicals Processing Application
- 4. Market Factor Analysis
- 4.1. Porters Five Forces
- 4.2. Supply/Value Chain
- 4.3. PESTEL analysis
- 4.4. Market Entropy
- 4.5. Patent/Trademark Analysis
- 5. Global Industrial Salts Industry Analysis, Insights and Forecast, 2019-2031
- 5.1. Market Analysis, Insights and Forecast - by Source
- 5.1.1. Rock Salt
- 5.1.2. Natural Brine
- 5.2. Market Analysis, Insights and Forecast - by Manufacturing Process
- 5.2.1. Solar Evaporation
- 5.2.2. Vacuum Evaporation
- 5.2.3. Conventional Mining
- 5.3. Market Analysis, Insights and Forecast - by Application
- 5.3.1. Chemical Processing
- 5.3.2. Water Treatment
- 5.3.3. De-icing
- 5.3.4. Agriculture
- 5.3.5. Food Processing
- 5.3.6. Oil and Gas
- 5.3.7. Other Applications
- 5.4. Market Analysis, Insights and Forecast - by Region
- 5.4.1. Asia Pacific
- 5.4.2. North America
- 5.4.3. Europe
- 5.4.4. South America
- 5.4.5. Middle East and Africa
- 5.1. Market Analysis, Insights and Forecast - by Source
- 6. Asia Pacific Industrial Salts Industry Analysis, Insights and Forecast, 2019-2031
- 6.1. Market Analysis, Insights and Forecast - by Source
- 6.1.1. Rock Salt
- 6.1.2. Natural Brine
- 6.2. Market Analysis, Insights and Forecast - by Manufacturing Process
- 6.2.1. Solar Evaporation
- 6.2.2. Vacuum Evaporation
- 6.2.3. Conventional Mining
- 6.3. Market Analysis, Insights and Forecast - by Application
- 6.3.1. Chemical Processing
- 6.3.2. Water Treatment
- 6.3.3. De-icing
- 6.3.4. Agriculture
- 6.3.5. Food Processing
- 6.3.6. Oil and Gas
- 6.3.7. Other Applications
- 6.1. Market Analysis, Insights and Forecast - by Source
- 7. North America Industrial Salts Industry Analysis, Insights and Forecast, 2019-2031
- 7.1. Market Analysis, Insights and Forecast - by Source
- 7.1.1. Rock Salt
- 7.1.2. Natural Brine
- 7.2. Market Analysis, Insights and Forecast - by Manufacturing Process
- 7.2.1. Solar Evaporation
- 7.2.2. Vacuum Evaporation
- 7.2.3. Conventional Mining
- 7.3. Market Analysis, Insights and Forecast - by Application
- 7.3.1. Chemical Processing
- 7.3.2. Water Treatment
- 7.3.3. De-icing
- 7.3.4. Agriculture
- 7.3.5. Food Processing
- 7.3.6. Oil and Gas
- 7.3.7. Other Applications
- 7.1. Market Analysis, Insights and Forecast - by Source
- 8. Europe Industrial Salts Industry Analysis, Insights and Forecast, 2019-2031
- 8.1. Market Analysis, Insights and Forecast - by Source
- 8.1.1. Rock Salt
- 8.1.2. Natural Brine
- 8.2. Market Analysis, Insights and Forecast - by Manufacturing Process
- 8.2.1. Solar Evaporation
- 8.2.2. Vacuum Evaporation
- 8.2.3. Conventional Mining
- 8.3. Market Analysis, Insights and Forecast - by Application
- 8.3.1. Chemical Processing
- 8.3.2. Water Treatment
- 8.3.3. De-icing
- 8.3.4. Agriculture
- 8.3.5. Food Processing
- 8.3.6. Oil and Gas
- 8.3.7. Other Applications
- 8.1. Market Analysis, Insights and Forecast - by Source
- 9. South America Industrial Salts Industry Analysis, Insights and Forecast, 2019-2031
- 9.1. Market Analysis, Insights and Forecast - by Source
- 9.1.1. Rock Salt
- 9.1.2. Natural Brine
- 9.2. Market Analysis, Insights and Forecast - by Manufacturing Process
- 9.2.1. Solar Evaporation
- 9.2.2. Vacuum Evaporation
- 9.2.3. Conventional Mining
- 9.3. Market Analysis, Insights and Forecast - by Application
- 9.3.1. Chemical Processing
- 9.3.2. Water Treatment
- 9.3.3. De-icing
- 9.3.4. Agriculture
- 9.3.5. Food Processing
- 9.3.6. Oil and Gas
- 9.3.7. Other Applications
- 9.1. Market Analysis, Insights and Forecast - by Source
- 10. Middle East and Africa Industrial Salts Industry Analysis, Insights and Forecast, 2019-2031
- 10.1. Market Analysis, Insights and Forecast - by Source
- 10.1.1. Rock Salt
- 10.1.2. Natural Brine
- 10.2. Market Analysis, Insights and Forecast - by Manufacturing Process
- 10.2.1. Solar Evaporation
- 10.2.2. Vacuum Evaporation
- 10.2.3. Conventional Mining
- 10.3. Market Analysis, Insights and Forecast - by Application
- 10.3.1. Chemical Processing
- 10.3.2. Water Treatment
- 10.3.3. De-icing
- 10.3.4. Agriculture
- 10.3.5. Food Processing
- 10.3.6. Oil and Gas
- 10.3.7. Other Applications
- 10.1. Market Analysis, Insights and Forecast - by Source
- 11. North America Industrial Salts Industry Analysis, Insights and Forecast, 2019-2031
- 11.1. Market Analysis, Insights and Forecast - By Country/Sub-region
- 11.1.1 United States
- 11.1.2 Canada
- 11.1.3 Mexico
- 12. Europe Industrial Salts Industry Analysis, Insights and Forecast, 2019-2031
- 12.1. Market Analysis, Insights and Forecast - By Country/Sub-region
- 12.1.1 Germany
- 12.1.2 France
- 12.1.3 Italy
- 12.1.4 United Kingdom
- 12.1.5 Netherlands
- 12.1.6 Rest of Europe
- 13. Asia Pacific Industrial Salts Industry Analysis, Insights and Forecast, 2019-2031
- 13.1. Market Analysis, Insights and Forecast - By Country/Sub-region
- 13.1.1 China
- 13.1.2 Japan
- 13.1.3 India
- 13.1.4 South Korea
- 13.1.5 Taiwan
- 13.1.6 Australia
- 13.1.7 Rest of Asia-Pacific
- 14. South America Industrial Salts Industry Analysis, Insights and Forecast, 2019-2031
- 14.1. Market Analysis, Insights and Forecast - By Country/Sub-region
- 14.1.1 Brazil
- 14.1.2 Argentina
- 14.1.3 Rest of South America
- 15. MEA Industrial Salts Industry Analysis, Insights and Forecast, 2019-2031
- 15.1. Market Analysis, Insights and Forecast - By Country/Sub-region
- 15.1.1 Middle East
- 15.1.2 Africa
- 16. Competitive Analysis
- 16.1. Global Market Share Analysis 2024
- 16.2. Company Profiles
- 16.2.1 MITSUI & CO LTD
- 16.2.1.1. Overview
- 16.2.1.2. Products
- 16.2.1.3. SWOT Analysis
- 16.2.1.4. Recent Developments
- 16.2.1.5. Financials (Based on Availability)
- 16.2.2 Cargill Incorporated
- 16.2.2.1. Overview
- 16.2.2.2. Products
- 16.2.2.3. SWOT Analysis
- 16.2.2.4. Recent Developments
- 16.2.2.5. Financials (Based on Availability)
- 16.2.3 Salins IAA
- 16.2.3.1. Overview
- 16.2.3.2. Products
- 16.2.3.3. SWOT Analysis
- 16.2.3.4. Recent Developments
- 16.2.3.5. Financials (Based on Availability)
- 16.2.4 Nouryon
- 16.2.4.1. Overview
- 16.2.4.2. Products
- 16.2.4.3. SWOT Analysis
- 16.2.4.4. Recent Developments
- 16.2.4.5. Financials (Based on Availability)
- 16.2.5 INEOS
- 16.2.5.1. Overview
- 16.2.5.2. Products
- 16.2.5.3. SWOT Analysis
- 16.2.5.4. Recent Developments
- 16.2.5.5. Financials (Based on Availability)
- 16.2.6 Tata Chemicals Ltd
- 16.2.6.1. Overview
- 16.2.6.2. Products
- 16.2.6.3. SWOT Analysis
- 16.2.6.4. Recent Developments
- 16.2.6.5. Financials (Based on Availability)
- 16.2.7 Archean Group
- 16.2.7.1. Overview
- 16.2.7.2. Products
- 16.2.7.3. SWOT Analysis
- 16.2.7.4. Recent Developments
- 16.2.7.5. Financials (Based on Availability)
- 16.2.8 Donald Brown Group
- 16.2.8.1. Overview
- 16.2.8.2. Products
- 16.2.8.3. SWOT Analysis
- 16.2.8.4. Recent Developments
- 16.2.8.5. Financials (Based on Availability)
- 16.2.9 Rio Tinto
- 16.2.9.1. Overview
- 16.2.9.2. Products
- 16.2.9.3. SWOT Analysis
- 16.2.9.4. Recent Developments
- 16.2.9.5. Financials (Based on Availability)
- 16.2.10 Delmon Group of Companies
- 16.2.10.1. Overview
- 16.2.10.2. Products
- 16.2.10.3. SWOT Analysis
- 16.2.10.4. Recent Developments
- 16.2.10.5. Financials (Based on Availability)
- 16.2.11 K+S Aktiengesellschaft
- 16.2.11.1. Overview
- 16.2.11.2. Products
- 16.2.11.3. SWOT Analysis
- 16.2.11.4. Recent Developments
- 16.2.11.5. Financials (Based on Availability)
- 16.2.12 Morton Salt Inc
- 16.2.12.1. Overview
- 16.2.12.2. Products
- 16.2.12.3. SWOT Analysis
- 16.2.12.4. Recent Developments
- 16.2.12.5. Financials (Based on Availability)
- 16.2.13 Exportadora de Sal de CV
- 16.2.13.1. Overview
- 16.2.13.2. Products
- 16.2.13.3. SWOT Analysis
- 16.2.13.4. Recent Developments
- 16.2.13.5. Financials (Based on Availability)
- 16.2.14 Compass Minerals
- 16.2.14.1. Overview
- 16.2.14.2. Products
- 16.2.14.3. SWOT Analysis
- 16.2.14.4. Recent Developments
- 16.2.14.5. Financials (Based on Availability)
- 16.2.15 Dominion Salt Limited
- 16.2.15.1. Overview
- 16.2.15.2. Products
- 16.2.15.3. SWOT Analysis
- 16.2.15.4. Recent Developments
- 16.2.15.5. Financials (Based on Availability)
- 16.2.1 MITSUI & CO LTD
List of Figures
- Figure 1: Global Industrial Salts Industry Revenue Breakdown (Million, %) by Region 2024 & 2032
- Figure 2: Global Industrial Salts Industry Volume Breakdown (K Tons, %) by Region 2024 & 2032
- Figure 3: North America Industrial Salts Industry Revenue (Million), by Country 2024 & 2032
- Figure 4: North America Industrial Salts Industry Volume (K Tons), by Country 2024 & 2032
- Figure 5: North America Industrial Salts Industry Revenue Share (%), by Country 2024 & 2032
- Figure 6: North America Industrial Salts Industry Volume Share (%), by Country 2024 & 2032
- Figure 7: Europe Industrial Salts Industry Revenue (Million), by Country 2024 & 2032
- Figure 8: Europe Industrial Salts Industry Volume (K Tons), by Country 2024 & 2032
- Figure 9: Europe Industrial Salts Industry Revenue Share (%), by Country 2024 & 2032
- Figure 10: Europe Industrial Salts Industry Volume Share (%), by Country 2024 & 2032
- Figure 11: Asia Pacific Industrial Salts Industry Revenue (Million), by Country 2024 & 2032
- Figure 12: Asia Pacific Industrial Salts Industry Volume (K Tons), by Country 2024 & 2032
- Figure 13: Asia Pacific Industrial Salts Industry Revenue Share (%), by Country 2024 & 2032
- Figure 14: Asia Pacific Industrial Salts Industry Volume Share (%), by Country 2024 & 2032
- Figure 15: South America Industrial Salts Industry Revenue (Million), by Country 2024 & 2032
- Figure 16: South America Industrial Salts Industry Volume (K Tons), by Country 2024 & 2032
- Figure 17: South America Industrial Salts Industry Revenue Share (%), by Country 2024 & 2032
- Figure 18: South America Industrial Salts Industry Volume Share (%), by Country 2024 & 2032
- Figure 19: MEA Industrial Salts Industry Revenue (Million), by Country 2024 & 2032
- Figure 20: MEA Industrial Salts Industry Volume (K Tons), by Country 2024 & 2032
- Figure 21: MEA Industrial Salts Industry Revenue Share (%), by Country 2024 & 2032
- Figure 22: MEA Industrial Salts Industry Volume Share (%), by Country 2024 & 2032
- Figure 23: Asia Pacific Industrial Salts Industry Revenue (Million), by Source 2024 & 2032
- Figure 24: Asia Pacific Industrial Salts Industry Volume (K Tons), by Source 2024 & 2032
- Figure 25: Asia Pacific Industrial Salts Industry Revenue Share (%), by Source 2024 & 2032
- Figure 26: Asia Pacific Industrial Salts Industry Volume Share (%), by Source 2024 & 2032
- Figure 27: Asia Pacific Industrial Salts Industry Revenue (Million), by Manufacturing Process 2024 & 2032
- Figure 28: Asia Pacific Industrial Salts Industry Volume (K Tons), by Manufacturing Process 2024 & 2032
- Figure 29: Asia Pacific Industrial Salts Industry Revenue Share (%), by Manufacturing Process 2024 & 2032
- Figure 30: Asia Pacific Industrial Salts Industry Volume Share (%), by Manufacturing Process 2024 & 2032
- Figure 31: Asia Pacific Industrial Salts Industry Revenue (Million), by Application 2024 & 2032
- Figure 32: Asia Pacific Industrial Salts Industry Volume (K Tons), by Application 2024 & 2032
- Figure 33: Asia Pacific Industrial Salts Industry Revenue Share (%), by Application 2024 & 2032
- Figure 34: Asia Pacific Industrial Salts Industry Volume Share (%), by Application 2024 & 2032
- Figure 35: Asia Pacific Industrial Salts Industry Revenue (Million), by Country 2024 & 2032
- Figure 36: Asia Pacific Industrial Salts Industry Volume (K Tons), by Country 2024 & 2032
- Figure 37: Asia Pacific Industrial Salts Industry Revenue Share (%), by Country 2024 & 2032
- Figure 38: Asia Pacific Industrial Salts Industry Volume Share (%), by Country 2024 & 2032
- Figure 39: North America Industrial Salts Industry Revenue (Million), by Source 2024 & 2032
- Figure 40: North America Industrial Salts Industry Volume (K Tons), by Source 2024 & 2032
- Figure 41: North America Industrial Salts Industry Revenue Share (%), by Source 2024 & 2032
- Figure 42: North America Industrial Salts Industry Volume Share (%), by Source 2024 & 2032
- Figure 43: North America Industrial Salts Industry Revenue (Million), by Manufacturing Process 2024 & 2032
- Figure 44: North America Industrial Salts Industry Volume (K Tons), by Manufacturing Process 2024 & 2032
- Figure 45: North America Industrial Salts Industry Revenue Share (%), by Manufacturing Process 2024 & 2032
- Figure 46: North America Industrial Salts Industry Volume Share (%), by Manufacturing Process 2024 & 2032
- Figure 47: North America Industrial Salts Industry Revenue (Million), by Application 2024 & 2032
- Figure 48: North America Industrial Salts Industry Volume (K Tons), by Application 2024 & 2032
- Figure 49: North America Industrial Salts Industry Revenue Share (%), by Application 2024 & 2032
- Figure 50: North America Industrial Salts Industry Volume Share (%), by Application 2024 & 2032
- Figure 51: North America Industrial Salts Industry Revenue (Million), by Country 2024 & 2032
- Figure 52: North America Industrial Salts Industry Volume (K Tons), by Country 2024 & 2032
- Figure 53: North America Industrial Salts Industry Revenue Share (%), by Country 2024 & 2032
- Figure 54: North America Industrial Salts Industry Volume Share (%), by Country 2024 & 2032
- Figure 55: Europe Industrial Salts Industry Revenue (Million), by Source 2024 & 2032
- Figure 56: Europe Industrial Salts Industry Volume (K Tons), by Source 2024 & 2032
- Figure 57: Europe Industrial Salts Industry Revenue Share (%), by Source 2024 & 2032
- Figure 58: Europe Industrial Salts Industry Volume Share (%), by Source 2024 & 2032
- Figure 59: Europe Industrial Salts Industry Revenue (Million), by Manufacturing Process 2024 & 2032
- Figure 60: Europe Industrial Salts Industry Volume (K Tons), by Manufacturing Process 2024 & 2032
- Figure 61: Europe Industrial Salts Industry Revenue Share (%), by Manufacturing Process 2024 & 2032
- Figure 62: Europe Industrial Salts Industry Volume Share (%), by Manufacturing Process 2024 & 2032
- Figure 63: Europe Industrial Salts Industry Revenue (Million), by Application 2024 & 2032
- Figure 64: Europe Industrial Salts Industry Volume (K Tons), by Application 2024 & 2032
- Figure 65: Europe Industrial Salts Industry Revenue Share (%), by Application 2024 & 2032
- Figure 66: Europe Industrial Salts Industry Volume Share (%), by Application 2024 & 2032
- Figure 67: Europe Industrial Salts Industry Revenue (Million), by Country 2024 & 2032
- Figure 68: Europe Industrial Salts Industry Volume (K Tons), by Country 2024 & 2032
- Figure 69: Europe Industrial Salts Industry Revenue Share (%), by Country 2024 & 2032
- Figure 70: Europe Industrial Salts Industry Volume Share (%), by Country 2024 & 2032
- Figure 71: South America Industrial Salts Industry Revenue (Million), by Source 2024 & 2032
- Figure 72: South America Industrial Salts Industry Volume (K Tons), by Source 2024 & 2032
- Figure 73: South America Industrial Salts Industry Revenue Share (%), by Source 2024 & 2032
- Figure 74: South America Industrial Salts Industry Volume Share (%), by Source 2024 & 2032
- Figure 75: South America Industrial Salts Industry Revenue (Million), by Manufacturing Process 2024 & 2032
- Figure 76: South America Industrial Salts Industry Volume (K Tons), by Manufacturing Process 2024 & 2032
- Figure 77: South America Industrial Salts Industry Revenue Share (%), by Manufacturing Process 2024 & 2032
- Figure 78: South America Industrial Salts Industry Volume Share (%), by Manufacturing Process 2024 & 2032
- Figure 79: South America Industrial Salts Industry Revenue (Million), by Application 2024 & 2032
- Figure 80: South America Industrial Salts Industry Volume (K Tons), by Application 2024 & 2032
- Figure 81: South America Industrial Salts Industry Revenue Share (%), by Application 2024 & 2032
- Figure 82: South America Industrial Salts Industry Volume Share (%), by Application 2024 & 2032
- Figure 83: South America Industrial Salts Industry Revenue (Million), by Country 2024 & 2032
- Figure 84: South America Industrial Salts Industry Volume (K Tons), by Country 2024 & 2032
- Figure 85: South America Industrial Salts Industry Revenue Share (%), by Country 2024 & 2032
- Figure 86: South America Industrial Salts Industry Volume Share (%), by Country 2024 & 2032
- Figure 87: Middle East and Africa Industrial Salts Industry Revenue (Million), by Source 2024 & 2032
- Figure 88: Middle East and Africa Industrial Salts Industry Volume (K Tons), by Source 2024 & 2032
- Figure 89: Middle East and Africa Industrial Salts Industry Revenue Share (%), by Source 2024 & 2032
- Figure 90: Middle East and Africa Industrial Salts Industry Volume Share (%), by Source 2024 & 2032
- Figure 91: Middle East and Africa Industrial Salts Industry Revenue (Million), by Manufacturing Process 2024 & 2032
- Figure 92: Middle East and Africa Industrial Salts Industry Volume (K Tons), by Manufacturing Process 2024 & 2032
- Figure 93: Middle East and Africa Industrial Salts Industry Revenue Share (%), by Manufacturing Process 2024 & 2032
- Figure 94: Middle East and Africa Industrial Salts Industry Volume Share (%), by Manufacturing Process 2024 & 2032
- Figure 95: Middle East and Africa Industrial Salts Industry Revenue (Million), by Application 2024 & 2032
- Figure 96: Middle East and Africa Industrial Salts Industry Volume (K Tons), by Application 2024 & 2032
- Figure 97: Middle East and Africa Industrial Salts Industry Revenue Share (%), by Application 2024 & 2032
- Figure 98: Middle East and Africa Industrial Salts Industry Volume Share (%), by Application 2024 & 2032
- Figure 99: Middle East and Africa Industrial Salts Industry Revenue (Million), by Country 2024 & 2032
- Figure 100: Middle East and Africa Industrial Salts Industry Volume (K Tons), by Country 2024 & 2032
- Figure 101: Middle East and Africa Industrial Salts Industry Revenue Share (%), by Country 2024 & 2032
- Figure 102: Middle East and Africa Industrial Salts Industry Volume Share (%), by Country 2024 & 2032
List of Tables
- Table 1: Global Industrial Salts Industry Revenue Million Forecast, by Region 2019 & 2032
- Table 2: Global Industrial Salts Industry Volume K Tons Forecast, by Region 2019 & 2032
- Table 3: Global Industrial Salts Industry Revenue Million Forecast, by Source 2019 & 2032
- Table 4: Global Industrial Salts Industry Volume K Tons Forecast, by Source 2019 & 2032
- Table 5: Global Industrial Salts Industry Revenue Million Forecast, by Manufacturing Process 2019 & 2032
- Table 6: Global Industrial Salts Industry Volume K Tons Forecast, by Manufacturing Process 2019 & 2032
- Table 7: Global Industrial Salts Industry Revenue Million Forecast, by Application 2019 & 2032
- Table 8: Global Industrial Salts Industry Volume K Tons Forecast, by Application 2019 & 2032
- Table 9: Global Industrial Salts Industry Revenue Million Forecast, by Region 2019 & 2032
- Table 10: Global Industrial Salts Industry Volume K Tons Forecast, by Region 2019 & 2032
- Table 11: Global Industrial Salts Industry Revenue Million Forecast, by Country 2019 & 2032
- Table 12: Global Industrial Salts Industry Volume K Tons Forecast, by Country 2019 & 2032
- Table 13: United States Industrial Salts Industry Revenue (Million) Forecast, by Application 2019 & 2032
- Table 14: United States Industrial Salts Industry Volume (K Tons) Forecast, by Application 2019 & 2032
- Table 15: Canada Industrial Salts Industry Revenue (Million) Forecast, by Application 2019 & 2032
- Table 16: Canada Industrial Salts Industry Volume (K Tons) Forecast, by Application 2019 & 2032
- Table 17: Mexico Industrial Salts Industry Revenue (Million) Forecast, by Application 2019 & 2032
- Table 18: Mexico Industrial Salts Industry Volume (K Tons) Forecast, by Application 2019 & 2032
- Table 19: Global Industrial Salts Industry Revenue Million Forecast, by Country 2019 & 2032
- Table 20: Global Industrial Salts Industry Volume K Tons Forecast, by Country 2019 & 2032
- Table 21: Germany Industrial Salts Industry Revenue (Million) Forecast, by Application 2019 & 2032
- Table 22: Germany Industrial Salts Industry Volume (K Tons) Forecast, by Application 2019 & 2032
- Table 23: France Industrial Salts Industry Revenue (Million) Forecast, by Application 2019 & 2032
- Table 24: France Industrial Salts Industry Volume (K Tons) Forecast, by Application 2019 & 2032
- Table 25: Italy Industrial Salts Industry Revenue (Million) Forecast, by Application 2019 & 2032
- Table 26: Italy Industrial Salts Industry Volume (K Tons) Forecast, by Application 2019 & 2032
- Table 27: United Kingdom Industrial Salts Industry Revenue (Million) Forecast, by Application 2019 & 2032
- Table 28: United Kingdom Industrial Salts Industry Volume (K Tons) Forecast, by Application 2019 & 2032
- Table 29: Netherlands Industrial Salts Industry Revenue (Million) Forecast, by Application 2019 & 2032
- Table 30: Netherlands Industrial Salts Industry Volume (K Tons) Forecast, by Application 2019 & 2032
- Table 31: Rest of Europe Industrial Salts Industry Revenue (Million) Forecast, by Application 2019 & 2032
- Table 32: Rest of Europe Industrial Salts Industry Volume (K Tons) Forecast, by Application 2019 & 2032
- Table 33: Global Industrial Salts Industry Revenue Million Forecast, by Country 2019 & 2032
- Table 34: Global Industrial Salts Industry Volume K Tons Forecast, by Country 2019 & 2032
- Table 35: China Industrial Salts Industry Revenue (Million) Forecast, by Application 2019 & 2032
- Table 36: China Industrial Salts Industry Volume (K Tons) Forecast, by Application 2019 & 2032
- Table 37: Japan Industrial Salts Industry Revenue (Million) Forecast, by Application 2019 & 2032
- Table 38: Japan Industrial Salts Industry Volume (K Tons) Forecast, by Application 2019 & 2032
- Table 39: India Industrial Salts Industry Revenue (Million) Forecast, by Application 2019 & 2032
- Table 40: India Industrial Salts Industry Volume (K Tons) Forecast, by Application 2019 & 2032
- Table 41: South Korea Industrial Salts Industry Revenue (Million) Forecast, by Application 2019 & 2032
- Table 42: South Korea Industrial Salts Industry Volume (K Tons) Forecast, by Application 2019 & 2032
- Table 43: Taiwan Industrial Salts Industry Revenue (Million) Forecast, by Application 2019 & 2032
- Table 44: Taiwan Industrial Salts Industry Volume (K Tons) Forecast, by Application 2019 & 2032
- Table 45: Australia Industrial Salts Industry Revenue (Million) Forecast, by Application 2019 & 2032
- Table 46: Australia Industrial Salts Industry Volume (K Tons) Forecast, by Application 2019 & 2032
- Table 47: Rest of Asia-Pacific Industrial Salts Industry Revenue (Million) Forecast, by Application 2019 & 2032
- Table 48: Rest of Asia-Pacific Industrial Salts Industry Volume (K Tons) Forecast, by Application 2019 & 2032
- Table 49: Global Industrial Salts Industry Revenue Million Forecast, by Country 2019 & 2032
- Table 50: Global Industrial Salts Industry Volume K Tons Forecast, by Country 2019 & 2032
- Table 51: Brazil Industrial Salts Industry Revenue (Million) Forecast, by Application 2019 & 2032
- Table 52: Brazil Industrial Salts Industry Volume (K Tons) Forecast, by Application 2019 & 2032
- Table 53: Argentina Industrial Salts Industry Revenue (Million) Forecast, by Application 2019 & 2032
- Table 54: Argentina Industrial Salts Industry Volume (K Tons) Forecast, by Application 2019 & 2032
- Table 55: Rest of South America Industrial Salts Industry Revenue (Million) Forecast, by Application 2019 & 2032
- Table 56: Rest of South America Industrial Salts Industry Volume (K Tons) Forecast, by Application 2019 & 2032
- Table 57: Global Industrial Salts Industry Revenue Million Forecast, by Country 2019 & 2032
- Table 58: Global Industrial Salts Industry Volume K Tons Forecast, by Country 2019 & 2032
- Table 59: Middle East Industrial Salts Industry Revenue (Million) Forecast, by Application 2019 & 2032
- Table 60: Middle East Industrial Salts Industry Volume (K Tons) Forecast, by Application 2019 & 2032
- Table 61: Africa Industrial Salts Industry Revenue (Million) Forecast, by Application 2019 & 2032
- Table 62: Africa Industrial Salts Industry Volume (K Tons) Forecast, by Application 2019 & 2032
- Table 63: Global Industrial Salts Industry Revenue Million Forecast, by Source 2019 & 2032
- Table 64: Global Industrial Salts Industry Volume K Tons Forecast, by Source 2019 & 2032
- Table 65: Global Industrial Salts Industry Revenue Million Forecast, by Manufacturing Process 2019 & 2032
- Table 66: Global Industrial Salts Industry Volume K Tons Forecast, by Manufacturing Process 2019 & 2032
- Table 67: Global Industrial Salts Industry Revenue Million Forecast, by Application 2019 & 2032
- Table 68: Global Industrial Salts Industry Volume K Tons Forecast, by Application 2019 & 2032
- Table 69: Global Industrial Salts Industry Revenue Million Forecast, by Country 2019 & 2032
- Table 70: Global Industrial Salts Industry Volume K Tons Forecast, by Country 2019 & 2032
- Table 71: China Industrial Salts Industry Revenue (Million) Forecast, by Application 2019 & 2032
- Table 72: China Industrial Salts Industry Volume (K Tons) Forecast, by Application 2019 & 2032
- Table 73: India Industrial Salts Industry Revenue (Million) Forecast, by Application 2019 & 2032
- Table 74: India Industrial Salts Industry Volume (K Tons) Forecast, by Application 2019 & 2032
- Table 75: Japan Industrial Salts Industry Revenue (Million) Forecast, by Application 2019 & 2032
- Table 76: Japan Industrial Salts Industry Volume (K Tons) Forecast, by Application 2019 & 2032
- Table 77: South Korea Industrial Salts Industry Revenue (Million) Forecast, by Application 2019 & 2032
- Table 78: South Korea Industrial Salts Industry Volume (K Tons) Forecast, by Application 2019 & 2032
- Table 79: Rest of Asia Pacific Industrial Salts Industry Revenue (Million) Forecast, by Application 2019 & 2032
- Table 80: Rest of Asia Pacific Industrial Salts Industry Volume (K Tons) Forecast, by Application 2019 & 2032
- Table 81: Global Industrial Salts Industry Revenue Million Forecast, by Source 2019 & 2032
- Table 82: Global Industrial Salts Industry Volume K Tons Forecast, by Source 2019 & 2032
- Table 83: Global Industrial Salts Industry Revenue Million Forecast, by Manufacturing Process 2019 & 2032
- Table 84: Global Industrial Salts Industry Volume K Tons Forecast, by Manufacturing Process 2019 & 2032
- Table 85: Global Industrial Salts Industry Revenue Million Forecast, by Application 2019 & 2032
- Table 86: Global Industrial Salts Industry Volume K Tons Forecast, by Application 2019 & 2032
- Table 87: Global Industrial Salts Industry Revenue Million Forecast, by Country 2019 & 2032
- Table 88: Global Industrial Salts Industry Volume K Tons Forecast, by Country 2019 & 2032
- Table 89: United States Industrial Salts Industry Revenue (Million) Forecast, by Application 2019 & 2032
- Table 90: United States Industrial Salts Industry Volume (K Tons) Forecast, by Application 2019 & 2032
- Table 91: Canada Industrial Salts Industry Revenue (Million) Forecast, by Application 2019 & 2032
- Table 92: Canada Industrial Salts Industry Volume (K Tons) Forecast, by Application 2019 & 2032
- Table 93: Mexico Industrial Salts Industry Revenue (Million) Forecast, by Application 2019 & 2032
- Table 94: Mexico Industrial Salts Industry Volume (K Tons) Forecast, by Application 2019 & 2032
- Table 95: Global Industrial Salts Industry Revenue Million Forecast, by Source 2019 & 2032
- Table 96: Global Industrial Salts Industry Volume K Tons Forecast, by Source 2019 & 2032
- Table 97: Global Industrial Salts Industry Revenue Million Forecast, by Manufacturing Process 2019 & 2032
- Table 98: Global Industrial Salts Industry Volume K Tons Forecast, by Manufacturing Process 2019 & 2032
- Table 99: Global Industrial Salts Industry Revenue Million Forecast, by Application 2019 & 2032
- Table 100: Global Industrial Salts Industry Volume K Tons Forecast, by Application 2019 & 2032
- Table 101: Global Industrial Salts Industry Revenue Million Forecast, by Country 2019 & 2032
- Table 102: Global Industrial Salts Industry Volume K Tons Forecast, by Country 2019 & 2032
- Table 103: Germany Industrial Salts Industry Revenue (Million) Forecast, by Application 2019 & 2032
- Table 104: Germany Industrial Salts Industry Volume (K Tons) Forecast, by Application 2019 & 2032
- Table 105: United Kingdom Industrial Salts Industry Revenue (Million) Forecast, by Application 2019 & 2032
- Table 106: United Kingdom Industrial Salts Industry Volume (K Tons) Forecast, by Application 2019 & 2032
- Table 107: France Industrial Salts Industry Revenue (Million) Forecast, by Application 2019 & 2032
- Table 108: France Industrial Salts Industry Volume (K Tons) Forecast, by Application 2019 & 2032
- Table 109: Italy Industrial Salts Industry Revenue (Million) Forecast, by Application 2019 & 2032
- Table 110: Italy Industrial Salts Industry Volume (K Tons) Forecast, by Application 2019 & 2032
- Table 111: Rest of Europe Industrial Salts Industry Revenue (Million) Forecast, by Application 2019 & 2032
- Table 112: Rest of Europe Industrial Salts Industry Volume (K Tons) Forecast, by Application 2019 & 2032
- Table 113: Global Industrial Salts Industry Revenue Million Forecast, by Source 2019 & 2032
- Table 114: Global Industrial Salts Industry Volume K Tons Forecast, by Source 2019 & 2032
- Table 115: Global Industrial Salts Industry Revenue Million Forecast, by Manufacturing Process 2019 & 2032
- Table 116: Global Industrial Salts Industry Volume K Tons Forecast, by Manufacturing Process 2019 & 2032
- Table 117: Global Industrial Salts Industry Revenue Million Forecast, by Application 2019 & 2032
- Table 118: Global Industrial Salts Industry Volume K Tons Forecast, by Application 2019 & 2032
- Table 119: Global Industrial Salts Industry Revenue Million Forecast, by Country 2019 & 2032
- Table 120: Global Industrial Salts Industry Volume K Tons Forecast, by Country 2019 & 2032
- Table 121: Brazil Industrial Salts Industry Revenue (Million) Forecast, by Application 2019 & 2032
- Table 122: Brazil Industrial Salts Industry Volume (K Tons) Forecast, by Application 2019 & 2032
- Table 123: Argentina Industrial Salts Industry Revenue (Million) Forecast, by Application 2019 & 2032
- Table 124: Argentina Industrial Salts Industry Volume (K Tons) Forecast, by Application 2019 & 2032
- Table 125: Rest of South America Industrial Salts Industry Revenue (Million) Forecast, by Application 2019 & 2032
- Table 126: Rest of South America Industrial Salts Industry Volume (K Tons) Forecast, by Application 2019 & 2032
- Table 127: Global Industrial Salts Industry Revenue Million Forecast, by Source 2019 & 2032
- Table 128: Global Industrial Salts Industry Volume K Tons Forecast, by Source 2019 & 2032
- Table 129: Global Industrial Salts Industry Revenue Million Forecast, by Manufacturing Process 2019 & 2032
- Table 130: Global Industrial Salts Industry Volume K Tons Forecast, by Manufacturing Process 2019 & 2032
- Table 131: Global Industrial Salts Industry Revenue Million Forecast, by Application 2019 & 2032
- Table 132: Global Industrial Salts Industry Volume K Tons Forecast, by Application 2019 & 2032
- Table 133: Global Industrial Salts Industry Revenue Million Forecast, by Country 2019 & 2032
- Table 134: Global Industrial Salts Industry Volume K Tons Forecast, by Country 2019 & 2032
- Table 135: Saudi Arabia Industrial Salts Industry Revenue (Million) Forecast, by Application 2019 & 2032
- Table 136: Saudi Arabia Industrial Salts Industry Volume (K Tons) Forecast, by Application 2019 & 2032
- Table 137: South Africa Industrial Salts Industry Revenue (Million) Forecast, by Application 2019 & 2032
- Table 138: South Africa Industrial Salts Industry Volume (K Tons) Forecast, by Application 2019 & 2032
- Table 139: Rest of Middle East and Africa Industrial Salts Industry Revenue (Million) Forecast, by Application 2019 & 2032
- Table 140: Rest of Middle East and Africa Industrial Salts Industry Volume (K Tons) Forecast, by Application 2019 & 2032
Frequently Asked Questions
1. What is the projected Compound Annual Growth Rate (CAGR) of the Industrial Salts Industry?
The projected CAGR is approximately 2.20%.
2. Which companies are prominent players in the Industrial Salts Industry?
Key companies in the market include MITSUI & CO LTD, Cargill Incorporated, Salins IAA, Nouryon, INEOS, Tata Chemicals Ltd, Archean Group, Donald Brown Group, Rio Tinto, Delmon Group of Companies, K+S Aktiengesellschaft, Morton Salt Inc, Exportadora de Sal de CV, Compass Minerals, Dominion Salt Limited.
3. What are the main segments of the Industrial Salts Industry?
The market segments include Source, Manufacturing Process, Application.
4. Can you provide details about the market size?
The market size is estimated to be USD XX Million as of 2022.
5. What are some drivers contributing to market growth?
Increasing Demand in Chemical Processing; Growing Demand from Water Treatment.
6. What are the notable trends driving market growth?
Increasing Demand from Chemicals Processing Application.
7. Are there any restraints impacting market growth?
Stringent Government Regulations; Unfavorable Conditions Arising due to the Impact of COVID-19.
8. Can you provide examples of recent developments in the market?
In January 2021, Tata Chemicals Ltd intended to acquire the industrial salt unit with an annual production capacity of 3 million tons of Archean Group, which would enhance the company's business.
9. What pricing options are available for accessing the report?
Pricing options include single-user, multi-user, and enterprise licenses priced at USD 4750, USD 5250, and USD 8750 respectively.
10. Is the market size provided in terms of value or volume?
The market size is provided in terms of value, measured in Million and volume, measured in K Tons.
11. Are there any specific market keywords associated with the report?
Yes, the market keyword associated with the report is "Industrial Salts Industry," which aids in identifying and referencing the specific market segment covered.
12. How do I determine which pricing option suits my needs best?
The pricing options vary based on user requirements and access needs. Individual users may opt for single-user licenses, while businesses requiring broader access may choose multi-user or enterprise licenses for cost-effective access to the report.
13. Are there any additional resources or data provided in the Industrial Salts Industry report?
While the report offers comprehensive insights, it's advisable to review the specific contents or supplementary materials provided to ascertain if additional resources or data are available.
14. How can I stay updated on further developments or reports in the Industrial Salts Industry?
To stay informed about further developments, trends, and reports in the Industrial Salts Industry, consider subscribing to industry newsletters, following relevant companies and organizations, or regularly checking reputable industry news sources and publications.
Methodology
Step 1 - Identification of Relevant Samples Size from Population Database


Step 2 - Approaches for Defining Global Market Size (Value, Volume* & Price*)

Note*: In applicable scenarios
Step 3 - Data Sources
Primary Research
- Web Analytics
- Survey Reports
- Research Institute
- Latest Research Reports
- Opinion Leaders
Secondary Research
- Annual Reports
- White Paper
- Latest Press Release
- Industry Association
- Paid Database
- Investor Presentations

Step 4 - Data Triangulation
Involves using different sources of information in order to increase the validity of a study
These sources are likely to be stakeholders in a program - participants, other researchers, program staff, other community members, and so on.
Then we put all data in single framework & apply various statistical tools to find out the dynamic on the market.
During the analysis stage, feedback from the stakeholder groups would be compared to determine areas of agreement as well as areas of divergence
