

Key Insights
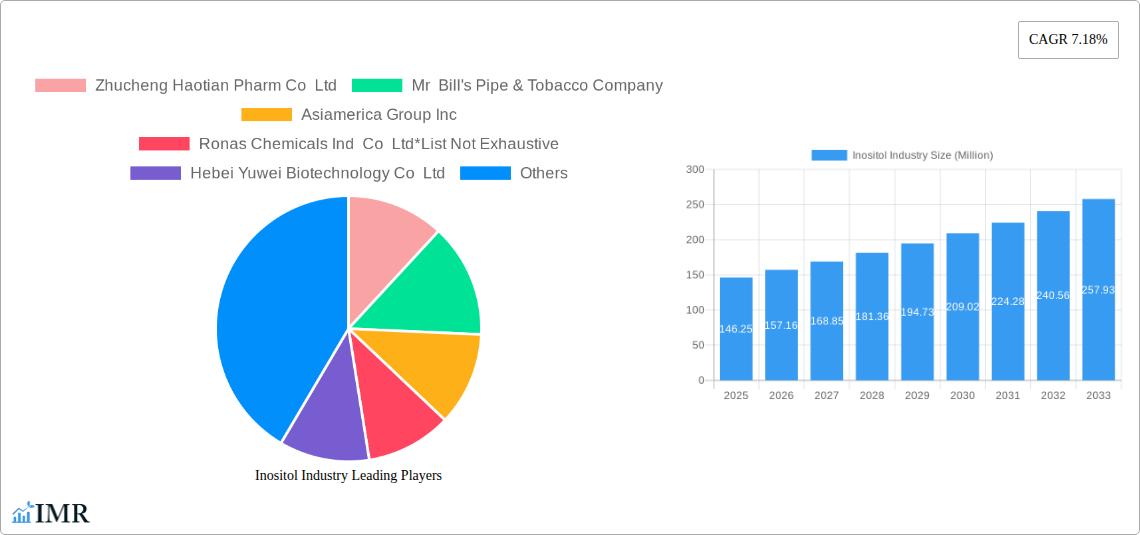
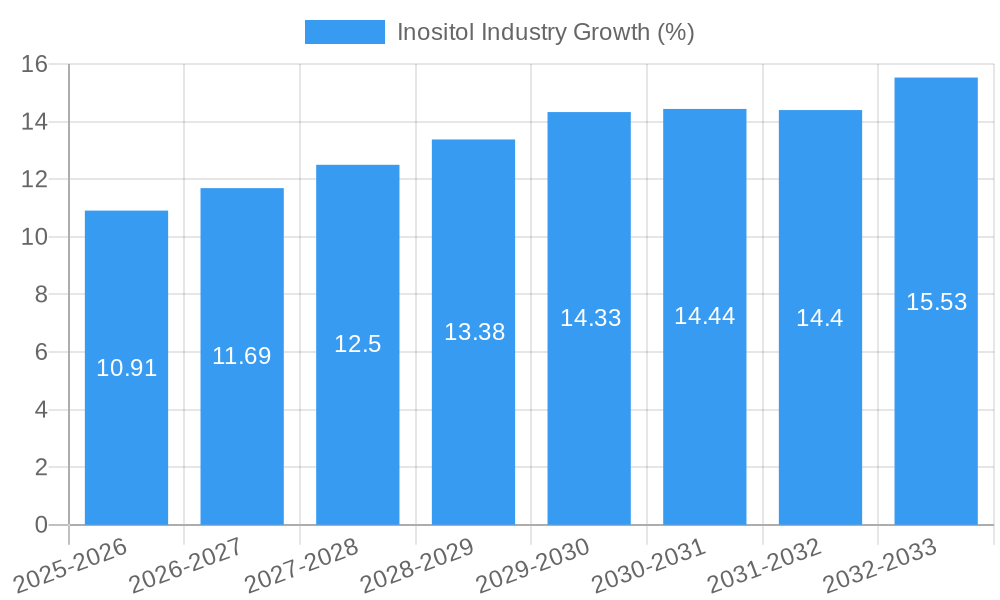
The global inositol market, valued at $146.25 million in 2025, is projected to experience robust growth, driven by increasing demand across diverse applications. A compound annual growth rate (CAGR) of 7.18% from 2025 to 2033 indicates a significant expansion of this market. Key drivers include the rising popularity of dietary supplements focused on mental wellness and improved metabolic function, coupled with growing applications in the food and beverage industry for enhanced nutritional value. The plant-based inositol segment is expected to dominate due to increasing consumer preference for natural ingredients. The pharmaceutical industry's utilization of inositol in various drug formulations further contributes to market expansion. However, potential restraints include price fluctuations in raw materials and the need for stringent quality control in manufacturing processes. Geographical analysis suggests strong growth in regions like North America and Asia Pacific, fueled by increasing health consciousness and rising disposable incomes. The competitive landscape features both established players and emerging companies, fostering innovation and driving market expansion. Specific applications, such as inositol’s role in treating insulin resistance and polycystic ovary syndrome (PCOS), are further fueling demand within the pharmaceutical segment. The feed industry's adoption of inositol as a nutritional supplement for livestock adds another layer of market growth, contributing to the overall expansion.
The forecast period of 2025-2033 presents significant opportunities for market players. Strategic partnerships and collaborations between manufacturers, distributors, and research institutions are crucial for accelerating market growth. Companies are focusing on product diversification and exploring new applications to broaden their market reach. The development of innovative delivery systems and formulations is also expected to drive market expansion, particularly in the dietary supplement sector. Further research and development in understanding the diverse benefits of inositol will undoubtedly solidify its position as a vital ingredient across various industries. Understanding consumer preferences regarding source (plant-based vs. synthetic) and application will be key for successful market penetration and sustained growth.
Inositol Industry Market Report: 2019-2033
This comprehensive report provides a detailed analysis of the Inositol industry, encompassing market dynamics, growth trends, regional dominance, product landscape, key players, and future outlook. The study period covers 2019-2033, with a base year of 2025 and a forecast period of 2025-2033. This report is an invaluable resource for industry professionals, investors, and researchers seeking to understand and capitalize on opportunities within this rapidly evolving market. The report examines both parent markets (Nutraceuticals, Pharmaceuticals) and child markets (Dietary Supplements, Beverages, Feed Industry) to provide a holistic view.
Inositol Industry Market Dynamics & Structure
This section analyzes the competitive landscape of the Inositol market, examining market concentration, technological advancements, regulatory frameworks, and competitive dynamics. The global Inositol market size in 2024 was valued at xx Million and is expected to reach xx Million by 2033, growing at a CAGR of xx% during the forecast period.
- Market Concentration: The market exhibits a moderately concentrated structure with several major players holding significant market share. The top 5 players account for approximately xx% of the global market.
- Technological Innovation: Technological advancements in extraction and synthesis methods are driving efficiency and cost reduction, impacting market dynamics. However, innovation barriers include high R&D costs and regulatory complexities.
- Regulatory Frameworks: Stringent regulations related to food safety and pharmaceutical approvals significantly impact market access and growth. Variances in regulations across different regions pose further challenges.
- Competitive Product Substitutes: Limited direct substitutes exist; however, other nutritional supplements and functional foods compete indirectly.
- M&A Trends: The past five years have witnessed xx M&A deals in the Inositol industry, primarily focused on expanding product portfolios and market reach. The average deal value was approximately xx Million.
- End-User Demographics: The primary end-users are in the nutraceutical, pharmaceutical, and feed industries, with the dietary supplement segment experiencing the highest growth.
Inositol Industry Growth Trends & Insights
The Inositol market is witnessing robust growth driven by increasing consumer awareness of its health benefits, particularly its role in improving mood, cognition, and metabolic health. The rise in prevalence of conditions like PCOS and insulin resistance is further fueling demand. The market is witnessing increasing adoption rates across various applications, especially in dietary supplements and functional beverages. The global market size is projected to expand significantly, driven by a CAGR of xx% during the forecast period. This growth is attributed to multiple factors including:
- Rising demand for dietary supplements: The growing popularity of health and wellness is positively impacting the demand for inositol-based supplements. Market penetration in this segment is currently at approximately xx%, with significant potential for expansion.
- Technological disruptions: Innovations in extraction and synthesis methods are enhancing product quality, reducing costs, and broadening market access.
- Shifting consumer preferences: Consumers are increasingly opting for natural and functional ingredients, driving the growth of plant-based inositol.
- Emerging applications: The exploration of inositol's potential in various therapeutic applications, such as the treatment of PCOS, is also driving market expansion.
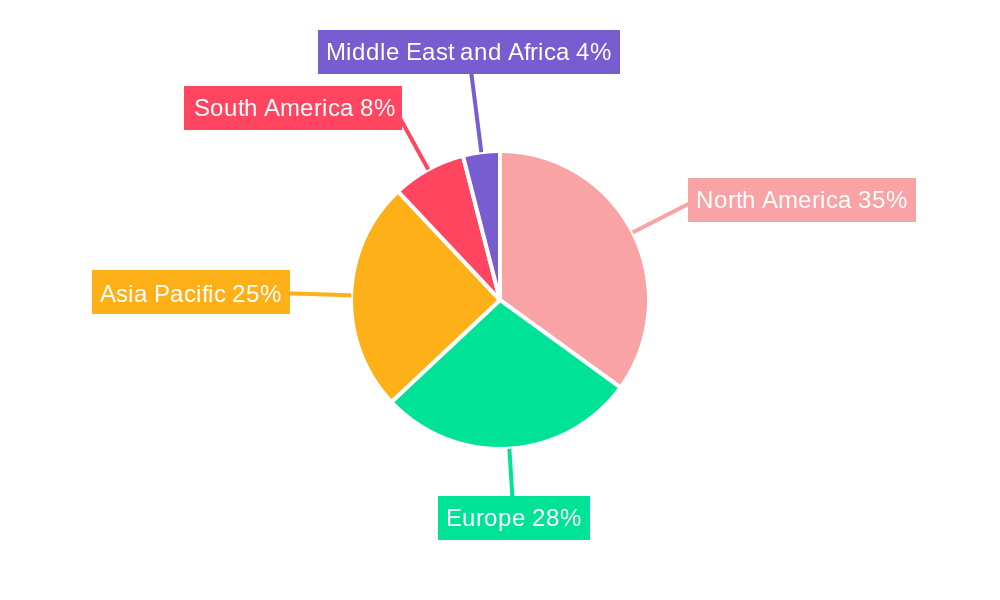
Dominant Regions, Countries, or Segments in Inositol Industry
North America currently dominates the Inositol market, holding approximately xx% of global market share, followed by Europe and Asia-Pacific. This dominance is primarily due to:
- High consumer awareness and adoption rates of dietary supplements: North America demonstrates high consumer awareness of health and wellness, leading to increased demand for inositol supplements.
- Strong regulatory frameworks and infrastructure: Established regulatory frameworks in North America facilitate market access and growth.
- High disposable income: High disposable income in North America contributes to greater spending on health and wellness products.
- Growing prevalence of chronic diseases: Increased prevalence of conditions like PCOS and insulin resistance fuels demand for inositol-based therapies.
Within the applications, the Dietary Supplement segment displays the highest growth rate, driven by consumer interest in natural health solutions. The Pharmaceutical Industry segment also shows strong growth potential due to the ongoing research into inositol’s therapeutic benefits. The Plant-based Inositol segment holds a larger market share currently but Synthetic Inositol is expected to witness faster growth due to cost-effectiveness and consistent quality.
Inositol Industry Product Landscape
The Inositol market offers a range of products, including myo-inositol, d-chiro-inositol, and other inositol isomers. Product innovation focuses on developing more bioavailable and efficacious formulations, such as liposomal inositol or targeted delivery systems. The key selling propositions include purity, efficacy, and source (plant-based vs. synthetic). Technological advancements are improving extraction methods, enhancing purity levels, and reducing production costs.
Key Drivers, Barriers & Challenges in Inositol Industry
Key Drivers:
- Increasing awareness of inositol's health benefits.
- Rising prevalence of metabolic disorders like PCOS and insulin resistance.
- Growing demand for natural and functional food ingredients.
- Technological advancements in extraction and synthesis methods.
Challenges & Restraints:
- Fluctuations in raw material prices and supply chain disruptions affecting production costs.
- Stringent regulatory approvals for pharmaceutical applications.
- Intense competition from other nutritional supplements and functional foods.
- Lack of consumer awareness in certain regions.
- xx Million in estimated lost revenue due to supply chain issues in 2022.
Emerging Opportunities in Inositol Industry
- Expanding into untapped markets in developing economies.
- Developing innovative applications for inositol in cosmetics and personal care.
- Leveraging the growing demand for personalized nutrition solutions.
- Exploring potential applications in animal feed and aquaculture.
- Collaborating with healthcare professionals to promote inositol's therapeutic benefits.
Growth Accelerators in the Inositol Industry
The Inositol market's long-term growth is driven by ongoing research into its health benefits, increasing consumer awareness, and expanding applications in various industries. Strategic partnerships between supplement manufacturers and healthcare providers are expected to accelerate market expansion. Further technological advancements in production and formulation will also enhance market growth.
Key Players Shaping the Inositol Industry Market
- Zhucheng Haotian Pharm Co Ltd
- Mr Bill's Pipe & Tobacco Company
- Asiamerica Group Inc
- Ronas Chemicals Ind Co Ltd
- Hebei Yuwei Biotechnology Co Ltd
- Charles Bowman & Company
- Koninklijke DSM NV
- Shandong Runde Biotechnology Co
- T J Clark & Company
- Jingkai Biotechnology
Notable Milestones in Inositol Industry Sector
- March 2023: MD Logic Health launched "Inositol by Cynthia Thurlow," highlighting inositol's role in mood and cognition regulation.
- March 2023: Veera Wellness launched VeeVital PCOS support, featuring clinically studied doses of myo-inositol for PCOS management.
- February 2023: Pro360 launched FemCare+ and HPHF product lines, incorporating myo-inositol for women's health benefits.
In-Depth Inositol Industry Market Outlook
The Inositol market presents significant future potential driven by increasing consumer health consciousness and scientific validation of its benefits. Strategic investments in R&D, expansion into new applications, and strategic partnerships will shape the market landscape. The focus on sustainable sourcing and transparent manufacturing practices will further strengthen market growth and consumer trust. The market is poised for continued expansion, presenting significant opportunities for businesses to capitalize on the growing demand for natural health solutions.
Inositol Industry Segmentation
-
1. Source
- 1.1. Plant-based Inositol
- 1.2. Synthetic Inositol
-
2. Application
- 2.1. Dietary Supplement
- 2.2. Beverage
- 2.3. Feed Industry
- 2.4. Pharmaceutical Industry
- 2.5. Other Applications
Inositol Industry Segmentation By Geography
-
1. North America
- 1.1. United States
- 1.2. Canada
- 1.3. Mexico
- 1.4. Rest of North America
-
2. Europe
- 2.1. United Kingdom
- 2.2. Germany
- 2.3. France
- 2.4. Russia
- 2.5. Italy
- 2.6. Spain
- 2.7. Rest of Europe
-
3. Asia Pacific
- 3.1. India
- 3.2. China
- 3.3. Japan
- 3.4. Australia
- 3.5. Rest of Asia Pacific
-
4. South America
- 4.1. Brazil
- 4.2. Argentina
- 4.3. Rest of South America
-
5. Middle East and Africa
- 5.1. South Africa
- 5.2. Saudi Arabia
- 5.3. Rest of Middle East and Africa
Inositol Industry REPORT HIGHLIGHTS
| Aspects | Details |
|---|---|
| Study Period | 2019-2033 |
| Base Year | 2024 |
| Estimated Year | 2025 |
| Forecast Period | 2025-2033 |
| Historical Period | 2019-2024 |
| Growth Rate | CAGR of 7.18% from 2019-2033 |
| Segmentation |
|
Table of Contents
- 1. Introduction
- 1.1. Research Scope
- 1.2. Market Segmentation
- 1.3. Research Methodology
- 1.4. Definitions and Assumptions
- 2. Executive Summary
- 2.1. Introduction
- 3. Market Dynamics
- 3.1. Introduction
- 3.2. Market Drivers
- 3.2.1. Increasing Demand for Clean Label Bakery Products; Increasing Popularity of Specialty Ingredients
- 3.3. Market Restrains
- 3.3.1. Risk of Allergies
- 3.4. Market Trends
- 3.4.1. Increasing Demand for Inositol in Pharmaceutical Industry
- 4. Market Factor Analysis
- 4.1. Porters Five Forces
- 4.2. Supply/Value Chain
- 4.3. PESTEL analysis
- 4.4. Market Entropy
- 4.5. Patent/Trademark Analysis
- 5. Global Inositol Industry Analysis, Insights and Forecast, 2019-2031
- 5.1. Market Analysis, Insights and Forecast - by Source
- 5.1.1. Plant-based Inositol
- 5.1.2. Synthetic Inositol
- 5.2. Market Analysis, Insights and Forecast - by Application
- 5.2.1. Dietary Supplement
- 5.2.2. Beverage
- 5.2.3. Feed Industry
- 5.2.4. Pharmaceutical Industry
- 5.2.5. Other Applications
- 5.3. Market Analysis, Insights and Forecast - by Region
- 5.3.1. North America
- 5.3.2. Europe
- 5.3.3. Asia Pacific
- 5.3.4. South America
- 5.3.5. Middle East and Africa
- 5.1. Market Analysis, Insights and Forecast - by Source
- 6. North America Inositol Industry Analysis, Insights and Forecast, 2019-2031
- 6.1. Market Analysis, Insights and Forecast - by Source
- 6.1.1. Plant-based Inositol
- 6.1.2. Synthetic Inositol
- 6.2. Market Analysis, Insights and Forecast - by Application
- 6.2.1. Dietary Supplement
- 6.2.2. Beverage
- 6.2.3. Feed Industry
- 6.2.4. Pharmaceutical Industry
- 6.2.5. Other Applications
- 6.1. Market Analysis, Insights and Forecast - by Source
- 7. Europe Inositol Industry Analysis, Insights and Forecast, 2019-2031
- 7.1. Market Analysis, Insights and Forecast - by Source
- 7.1.1. Plant-based Inositol
- 7.1.2. Synthetic Inositol
- 7.2. Market Analysis, Insights and Forecast - by Application
- 7.2.1. Dietary Supplement
- 7.2.2. Beverage
- 7.2.3. Feed Industry
- 7.2.4. Pharmaceutical Industry
- 7.2.5. Other Applications
- 7.1. Market Analysis, Insights and Forecast - by Source
- 8. Asia Pacific Inositol Industry Analysis, Insights and Forecast, 2019-2031
- 8.1. Market Analysis, Insights and Forecast - by Source
- 8.1.1. Plant-based Inositol
- 8.1.2. Synthetic Inositol
- 8.2. Market Analysis, Insights and Forecast - by Application
- 8.2.1. Dietary Supplement
- 8.2.2. Beverage
- 8.2.3. Feed Industry
- 8.2.4. Pharmaceutical Industry
- 8.2.5. Other Applications
- 8.1. Market Analysis, Insights and Forecast - by Source
- 9. South America Inositol Industry Analysis, Insights and Forecast, 2019-2031
- 9.1. Market Analysis, Insights and Forecast - by Source
- 9.1.1. Plant-based Inositol
- 9.1.2. Synthetic Inositol
- 9.2. Market Analysis, Insights and Forecast - by Application
- 9.2.1. Dietary Supplement
- 9.2.2. Beverage
- 9.2.3. Feed Industry
- 9.2.4. Pharmaceutical Industry
- 9.2.5. Other Applications
- 9.1. Market Analysis, Insights and Forecast - by Source
- 10. Middle East and Africa Inositol Industry Analysis, Insights and Forecast, 2019-2031
- 10.1. Market Analysis, Insights and Forecast - by Source
- 10.1.1. Plant-based Inositol
- 10.1.2. Synthetic Inositol
- 10.2. Market Analysis, Insights and Forecast - by Application
- 10.2.1. Dietary Supplement
- 10.2.2. Beverage
- 10.2.3. Feed Industry
- 10.2.4. Pharmaceutical Industry
- 10.2.5. Other Applications
- 10.1. Market Analysis, Insights and Forecast - by Source
- 11. North America Inositol Industry Analysis, Insights and Forecast, 2019-2031
- 11.1. Market Analysis, Insights and Forecast - By Country/Sub-region
- 11.1.1 United States
- 11.1.2 Canada
- 11.1.3 Mexico
- 11.1.4 Rest of North America
- 12. Europe Inositol Industry Analysis, Insights and Forecast, 2019-2031
- 12.1. Market Analysis, Insights and Forecast - By Country/Sub-region
- 12.1.1 United Kingdom
- 12.1.2 Germany
- 12.1.3 France
- 12.1.4 Russia
- 12.1.5 Italy
- 12.1.6 Spain
- 12.1.7 Rest of Europe
- 13. Asia Pacific Inositol Industry Analysis, Insights and Forecast, 2019-2031
- 13.1. Market Analysis, Insights and Forecast - By Country/Sub-region
- 13.1.1 India
- 13.1.2 China
- 13.1.3 Japan
- 13.1.4 Australia
- 13.1.5 Rest of Asia Pacific
- 14. South America Inositol Industry Analysis, Insights and Forecast, 2019-2031
- 14.1. Market Analysis, Insights and Forecast - By Country/Sub-region
- 14.1.1 Brazil
- 14.1.2 Argentina
- 14.1.3 Rest of South America
- 15. Middle East and Africa Inositol Industry Analysis, Insights and Forecast, 2019-2031
- 15.1. Market Analysis, Insights and Forecast - By Country/Sub-region
- 15.1.1 South Africa
- 15.1.2 Saudi Arabia
- 15.1.3 Rest of Middle East and Africa
- 16. Competitive Analysis
- 16.1. Global Market Share Analysis 2024
- 16.2. Company Profiles
- 16.2.1 Zhucheng Haotian Pharm Co Ltd
- 16.2.1.1. Overview
- 16.2.1.2. Products
- 16.2.1.3. SWOT Analysis
- 16.2.1.4. Recent Developments
- 16.2.1.5. Financials (Based on Availability)
- 16.2.2 Mr Bill's Pipe & Tobacco Company
- 16.2.2.1. Overview
- 16.2.2.2. Products
- 16.2.2.3. SWOT Analysis
- 16.2.2.4. Recent Developments
- 16.2.2.5. Financials (Based on Availability)
- 16.2.3 Asiamerica Group Inc
- 16.2.3.1. Overview
- 16.2.3.2. Products
- 16.2.3.3. SWOT Analysis
- 16.2.3.4. Recent Developments
- 16.2.3.5. Financials (Based on Availability)
- 16.2.4 Ronas Chemicals Ind Co Ltd*List Not Exhaustive
- 16.2.4.1. Overview
- 16.2.4.2. Products
- 16.2.4.3. SWOT Analysis
- 16.2.4.4. Recent Developments
- 16.2.4.5. Financials (Based on Availability)
- 16.2.5 Hebei Yuwei Biotechnology Co Ltd
- 16.2.5.1. Overview
- 16.2.5.2. Products
- 16.2.5.3. SWOT Analysis
- 16.2.5.4. Recent Developments
- 16.2.5.5. Financials (Based on Availability)
- 16.2.6 Charles Bowman & Company
- 16.2.6.1. Overview
- 16.2.6.2. Products
- 16.2.6.3. SWOT Analysis
- 16.2.6.4. Recent Developments
- 16.2.6.5. Financials (Based on Availability)
- 16.2.7 Koninklijke DSM NV
- 16.2.7.1. Overview
- 16.2.7.2. Products
- 16.2.7.3. SWOT Analysis
- 16.2.7.4. Recent Developments
- 16.2.7.5. Financials (Based on Availability)
- 16.2.8 Shandong Runde Biotechnology Co
- 16.2.8.1. Overview
- 16.2.8.2. Products
- 16.2.8.3. SWOT Analysis
- 16.2.8.4. Recent Developments
- 16.2.8.5. Financials (Based on Availability)
- 16.2.9 T J Clark & Company
- 16.2.9.1. Overview
- 16.2.9.2. Products
- 16.2.9.3. SWOT Analysis
- 16.2.9.4. Recent Developments
- 16.2.9.5. Financials (Based on Availability)
- 16.2.10 Jingkai Biotechnology
- 16.2.10.1. Overview
- 16.2.10.2. Products
- 16.2.10.3. SWOT Analysis
- 16.2.10.4. Recent Developments
- 16.2.10.5. Financials (Based on Availability)
- 16.2.1 Zhucheng Haotian Pharm Co Ltd
List of Figures
- Figure 1: Global Inositol Industry Revenue Breakdown (Million, %) by Region 2024 & 2032
- Figure 2: North America Inositol Industry Revenue (Million), by Country 2024 & 2032
- Figure 3: North America Inositol Industry Revenue Share (%), by Country 2024 & 2032
- Figure 4: Europe Inositol Industry Revenue (Million), by Country 2024 & 2032
- Figure 5: Europe Inositol Industry Revenue Share (%), by Country 2024 & 2032
- Figure 6: Asia Pacific Inositol Industry Revenue (Million), by Country 2024 & 2032
- Figure 7: Asia Pacific Inositol Industry Revenue Share (%), by Country 2024 & 2032
- Figure 8: South America Inositol Industry Revenue (Million), by Country 2024 & 2032
- Figure 9: South America Inositol Industry Revenue Share (%), by Country 2024 & 2032
- Figure 10: Middle East and Africa Inositol Industry Revenue (Million), by Country 2024 & 2032
- Figure 11: Middle East and Africa Inositol Industry Revenue Share (%), by Country 2024 & 2032
- Figure 12: North America Inositol Industry Revenue (Million), by Source 2024 & 2032
- Figure 13: North America Inositol Industry Revenue Share (%), by Source 2024 & 2032
- Figure 14: North America Inositol Industry Revenue (Million), by Application 2024 & 2032
- Figure 15: North America Inositol Industry Revenue Share (%), by Application 2024 & 2032
- Figure 16: North America Inositol Industry Revenue (Million), by Country 2024 & 2032
- Figure 17: North America Inositol Industry Revenue Share (%), by Country 2024 & 2032
- Figure 18: Europe Inositol Industry Revenue (Million), by Source 2024 & 2032
- Figure 19: Europe Inositol Industry Revenue Share (%), by Source 2024 & 2032
- Figure 20: Europe Inositol Industry Revenue (Million), by Application 2024 & 2032
- Figure 21: Europe Inositol Industry Revenue Share (%), by Application 2024 & 2032
- Figure 22: Europe Inositol Industry Revenue (Million), by Country 2024 & 2032
- Figure 23: Europe Inositol Industry Revenue Share (%), by Country 2024 & 2032
- Figure 24: Asia Pacific Inositol Industry Revenue (Million), by Source 2024 & 2032
- Figure 25: Asia Pacific Inositol Industry Revenue Share (%), by Source 2024 & 2032
- Figure 26: Asia Pacific Inositol Industry Revenue (Million), by Application 2024 & 2032
- Figure 27: Asia Pacific Inositol Industry Revenue Share (%), by Application 2024 & 2032
- Figure 28: Asia Pacific Inositol Industry Revenue (Million), by Country 2024 & 2032
- Figure 29: Asia Pacific Inositol Industry Revenue Share (%), by Country 2024 & 2032
- Figure 30: South America Inositol Industry Revenue (Million), by Source 2024 & 2032
- Figure 31: South America Inositol Industry Revenue Share (%), by Source 2024 & 2032
- Figure 32: South America Inositol Industry Revenue (Million), by Application 2024 & 2032
- Figure 33: South America Inositol Industry Revenue Share (%), by Application 2024 & 2032
- Figure 34: South America Inositol Industry Revenue (Million), by Country 2024 & 2032
- Figure 35: South America Inositol Industry Revenue Share (%), by Country 2024 & 2032
- Figure 36: Middle East and Africa Inositol Industry Revenue (Million), by Source 2024 & 2032
- Figure 37: Middle East and Africa Inositol Industry Revenue Share (%), by Source 2024 & 2032
- Figure 38: Middle East and Africa Inositol Industry Revenue (Million), by Application 2024 & 2032
- Figure 39: Middle East and Africa Inositol Industry Revenue Share (%), by Application 2024 & 2032
- Figure 40: Middle East and Africa Inositol Industry Revenue (Million), by Country 2024 & 2032
- Figure 41: Middle East and Africa Inositol Industry Revenue Share (%), by Country 2024 & 2032
List of Tables
- Table 1: Global Inositol Industry Revenue Million Forecast, by Region 2019 & 2032
- Table 2: Global Inositol Industry Revenue Million Forecast, by Source 2019 & 2032
- Table 3: Global Inositol Industry Revenue Million Forecast, by Application 2019 & 2032
- Table 4: Global Inositol Industry Revenue Million Forecast, by Region 2019 & 2032
- Table 5: Global Inositol Industry Revenue Million Forecast, by Country 2019 & 2032
- Table 6: United States Inositol Industry Revenue (Million) Forecast, by Application 2019 & 2032
- Table 7: Canada Inositol Industry Revenue (Million) Forecast, by Application 2019 & 2032
- Table 8: Mexico Inositol Industry Revenue (Million) Forecast, by Application 2019 & 2032
- Table 9: Rest of North America Inositol Industry Revenue (Million) Forecast, by Application 2019 & 2032
- Table 10: Global Inositol Industry Revenue Million Forecast, by Country 2019 & 2032
- Table 11: United Kingdom Inositol Industry Revenue (Million) Forecast, by Application 2019 & 2032
- Table 12: Germany Inositol Industry Revenue (Million) Forecast, by Application 2019 & 2032
- Table 13: France Inositol Industry Revenue (Million) Forecast, by Application 2019 & 2032
- Table 14: Russia Inositol Industry Revenue (Million) Forecast, by Application 2019 & 2032
- Table 15: Italy Inositol Industry Revenue (Million) Forecast, by Application 2019 & 2032
- Table 16: Spain Inositol Industry Revenue (Million) Forecast, by Application 2019 & 2032
- Table 17: Rest of Europe Inositol Industry Revenue (Million) Forecast, by Application 2019 & 2032
- Table 18: Global Inositol Industry Revenue Million Forecast, by Country 2019 & 2032
- Table 19: India Inositol Industry Revenue (Million) Forecast, by Application 2019 & 2032
- Table 20: China Inositol Industry Revenue (Million) Forecast, by Application 2019 & 2032
- Table 21: Japan Inositol Industry Revenue (Million) Forecast, by Application 2019 & 2032
- Table 22: Australia Inositol Industry Revenue (Million) Forecast, by Application 2019 & 2032
- Table 23: Rest of Asia Pacific Inositol Industry Revenue (Million) Forecast, by Application 2019 & 2032
- Table 24: Global Inositol Industry Revenue Million Forecast, by Country 2019 & 2032
- Table 25: Brazil Inositol Industry Revenue (Million) Forecast, by Application 2019 & 2032
- Table 26: Argentina Inositol Industry Revenue (Million) Forecast, by Application 2019 & 2032
- Table 27: Rest of South America Inositol Industry Revenue (Million) Forecast, by Application 2019 & 2032
- Table 28: Global Inositol Industry Revenue Million Forecast, by Country 2019 & 2032
- Table 29: South Africa Inositol Industry Revenue (Million) Forecast, by Application 2019 & 2032
- Table 30: Saudi Arabia Inositol Industry Revenue (Million) Forecast, by Application 2019 & 2032
- Table 31: Rest of Middle East and Africa Inositol Industry Revenue (Million) Forecast, by Application 2019 & 2032
- Table 32: Global Inositol Industry Revenue Million Forecast, by Source 2019 & 2032
- Table 33: Global Inositol Industry Revenue Million Forecast, by Application 2019 & 2032
- Table 34: Global Inositol Industry Revenue Million Forecast, by Country 2019 & 2032
- Table 35: United States Inositol Industry Revenue (Million) Forecast, by Application 2019 & 2032
- Table 36: Canada Inositol Industry Revenue (Million) Forecast, by Application 2019 & 2032
- Table 37: Mexico Inositol Industry Revenue (Million) Forecast, by Application 2019 & 2032
- Table 38: Rest of North America Inositol Industry Revenue (Million) Forecast, by Application 2019 & 2032
- Table 39: Global Inositol Industry Revenue Million Forecast, by Source 2019 & 2032
- Table 40: Global Inositol Industry Revenue Million Forecast, by Application 2019 & 2032
- Table 41: Global Inositol Industry Revenue Million Forecast, by Country 2019 & 2032
- Table 42: United Kingdom Inositol Industry Revenue (Million) Forecast, by Application 2019 & 2032
- Table 43: Germany Inositol Industry Revenue (Million) Forecast, by Application 2019 & 2032
- Table 44: France Inositol Industry Revenue (Million) Forecast, by Application 2019 & 2032
- Table 45: Russia Inositol Industry Revenue (Million) Forecast, by Application 2019 & 2032
- Table 46: Italy Inositol Industry Revenue (Million) Forecast, by Application 2019 & 2032
- Table 47: Spain Inositol Industry Revenue (Million) Forecast, by Application 2019 & 2032
- Table 48: Rest of Europe Inositol Industry Revenue (Million) Forecast, by Application 2019 & 2032
- Table 49: Global Inositol Industry Revenue Million Forecast, by Source 2019 & 2032
- Table 50: Global Inositol Industry Revenue Million Forecast, by Application 2019 & 2032
- Table 51: Global Inositol Industry Revenue Million Forecast, by Country 2019 & 2032
- Table 52: India Inositol Industry Revenue (Million) Forecast, by Application 2019 & 2032
- Table 53: China Inositol Industry Revenue (Million) Forecast, by Application 2019 & 2032
- Table 54: Japan Inositol Industry Revenue (Million) Forecast, by Application 2019 & 2032
- Table 55: Australia Inositol Industry Revenue (Million) Forecast, by Application 2019 & 2032
- Table 56: Rest of Asia Pacific Inositol Industry Revenue (Million) Forecast, by Application 2019 & 2032
- Table 57: Global Inositol Industry Revenue Million Forecast, by Source 2019 & 2032
- Table 58: Global Inositol Industry Revenue Million Forecast, by Application 2019 & 2032
- Table 59: Global Inositol Industry Revenue Million Forecast, by Country 2019 & 2032
- Table 60: Brazil Inositol Industry Revenue (Million) Forecast, by Application 2019 & 2032
- Table 61: Argentina Inositol Industry Revenue (Million) Forecast, by Application 2019 & 2032
- Table 62: Rest of South America Inositol Industry Revenue (Million) Forecast, by Application 2019 & 2032
- Table 63: Global Inositol Industry Revenue Million Forecast, by Source 2019 & 2032
- Table 64: Global Inositol Industry Revenue Million Forecast, by Application 2019 & 2032
- Table 65: Global Inositol Industry Revenue Million Forecast, by Country 2019 & 2032
- Table 66: South Africa Inositol Industry Revenue (Million) Forecast, by Application 2019 & 2032
- Table 67: Saudi Arabia Inositol Industry Revenue (Million) Forecast, by Application 2019 & 2032
- Table 68: Rest of Middle East and Africa Inositol Industry Revenue (Million) Forecast, by Application 2019 & 2032
Frequently Asked Questions
1. What is the projected Compound Annual Growth Rate (CAGR) of the Inositol Industry?
The projected CAGR is approximately 7.18%.
2. Which companies are prominent players in the Inositol Industry?
Key companies in the market include Zhucheng Haotian Pharm Co Ltd, Mr Bill's Pipe & Tobacco Company, Asiamerica Group Inc, Ronas Chemicals Ind Co Ltd*List Not Exhaustive, Hebei Yuwei Biotechnology Co Ltd, Charles Bowman & Company, Koninklijke DSM NV, Shandong Runde Biotechnology Co, T J Clark & Company, Jingkai Biotechnology.
3. What are the main segments of the Inositol Industry?
The market segments include Source, Application.
4. Can you provide details about the market size?
The market size is estimated to be USD 146.25 Million as of 2022.
5. What are some drivers contributing to market growth?
Increasing Demand for Clean Label Bakery Products; Increasing Popularity of Specialty Ingredients.
6. What are the notable trends driving market growth?
Increasing Demand for Inositol in Pharmaceutical Industry.
7. Are there any restraints impacting market growth?
Risk of Allergies.
8. Can you provide examples of recent developments in the market?
In March 2023, MD Logic Health, a leading provider of USA-made professional-grade nutraceuticals and physician-recommended dietary supplements, announced its second collaboration with Cynthia Thurlow, NP. The latest product developed under this collaboration is Inositol by Cynthia Thurlow, powered by MD Logic Health. Myo-inositol, a naturally occurring organic compound produced by the liver and kidney, is crucial in regulating the body's response and hormones associated with mood and cognition.
9. What pricing options are available for accessing the report?
Pricing options include single-user, multi-user, and enterprise licenses priced at USD 4750, USD 5250, and USD 8750 respectively.
10. Is the market size provided in terms of value or volume?
The market size is provided in terms of value, measured in Million.
11. Are there any specific market keywords associated with the report?
Yes, the market keyword associated with the report is "Inositol Industry," which aids in identifying and referencing the specific market segment covered.
12. How do I determine which pricing option suits my needs best?
The pricing options vary based on user requirements and access needs. Individual users may opt for single-user licenses, while businesses requiring broader access may choose multi-user or enterprise licenses for cost-effective access to the report.
13. Are there any additional resources or data provided in the Inositol Industry report?
While the report offers comprehensive insights, it's advisable to review the specific contents or supplementary materials provided to ascertain if additional resources or data are available.
14. How can I stay updated on further developments or reports in the Inositol Industry?
To stay informed about further developments, trends, and reports in the Inositol Industry, consider subscribing to industry newsletters, following relevant companies and organizations, or regularly checking reputable industry news sources and publications.
Methodology
Step 1 - Identification of Relevant Samples Size from Population Database


Step 2 - Approaches for Defining Global Market Size (Value, Volume* & Price*)

Note*: In applicable scenarios
Step 3 - Data Sources
Primary Research
- Web Analytics
- Survey Reports
- Research Institute
- Latest Research Reports
- Opinion Leaders
Secondary Research
- Annual Reports
- White Paper
- Latest Press Release
- Industry Association
- Paid Database
- Investor Presentations

Step 4 - Data Triangulation
Involves using different sources of information in order to increase the validity of a study
These sources are likely to be stakeholders in a program - participants, other researchers, program staff, other community members, and so on.
Then we put all data in single framework & apply various statistical tools to find out the dynamic on the market.
During the analysis stage, feedback from the stakeholder groups would be compared to determine areas of agreement as well as areas of divergence
