

Key Insights
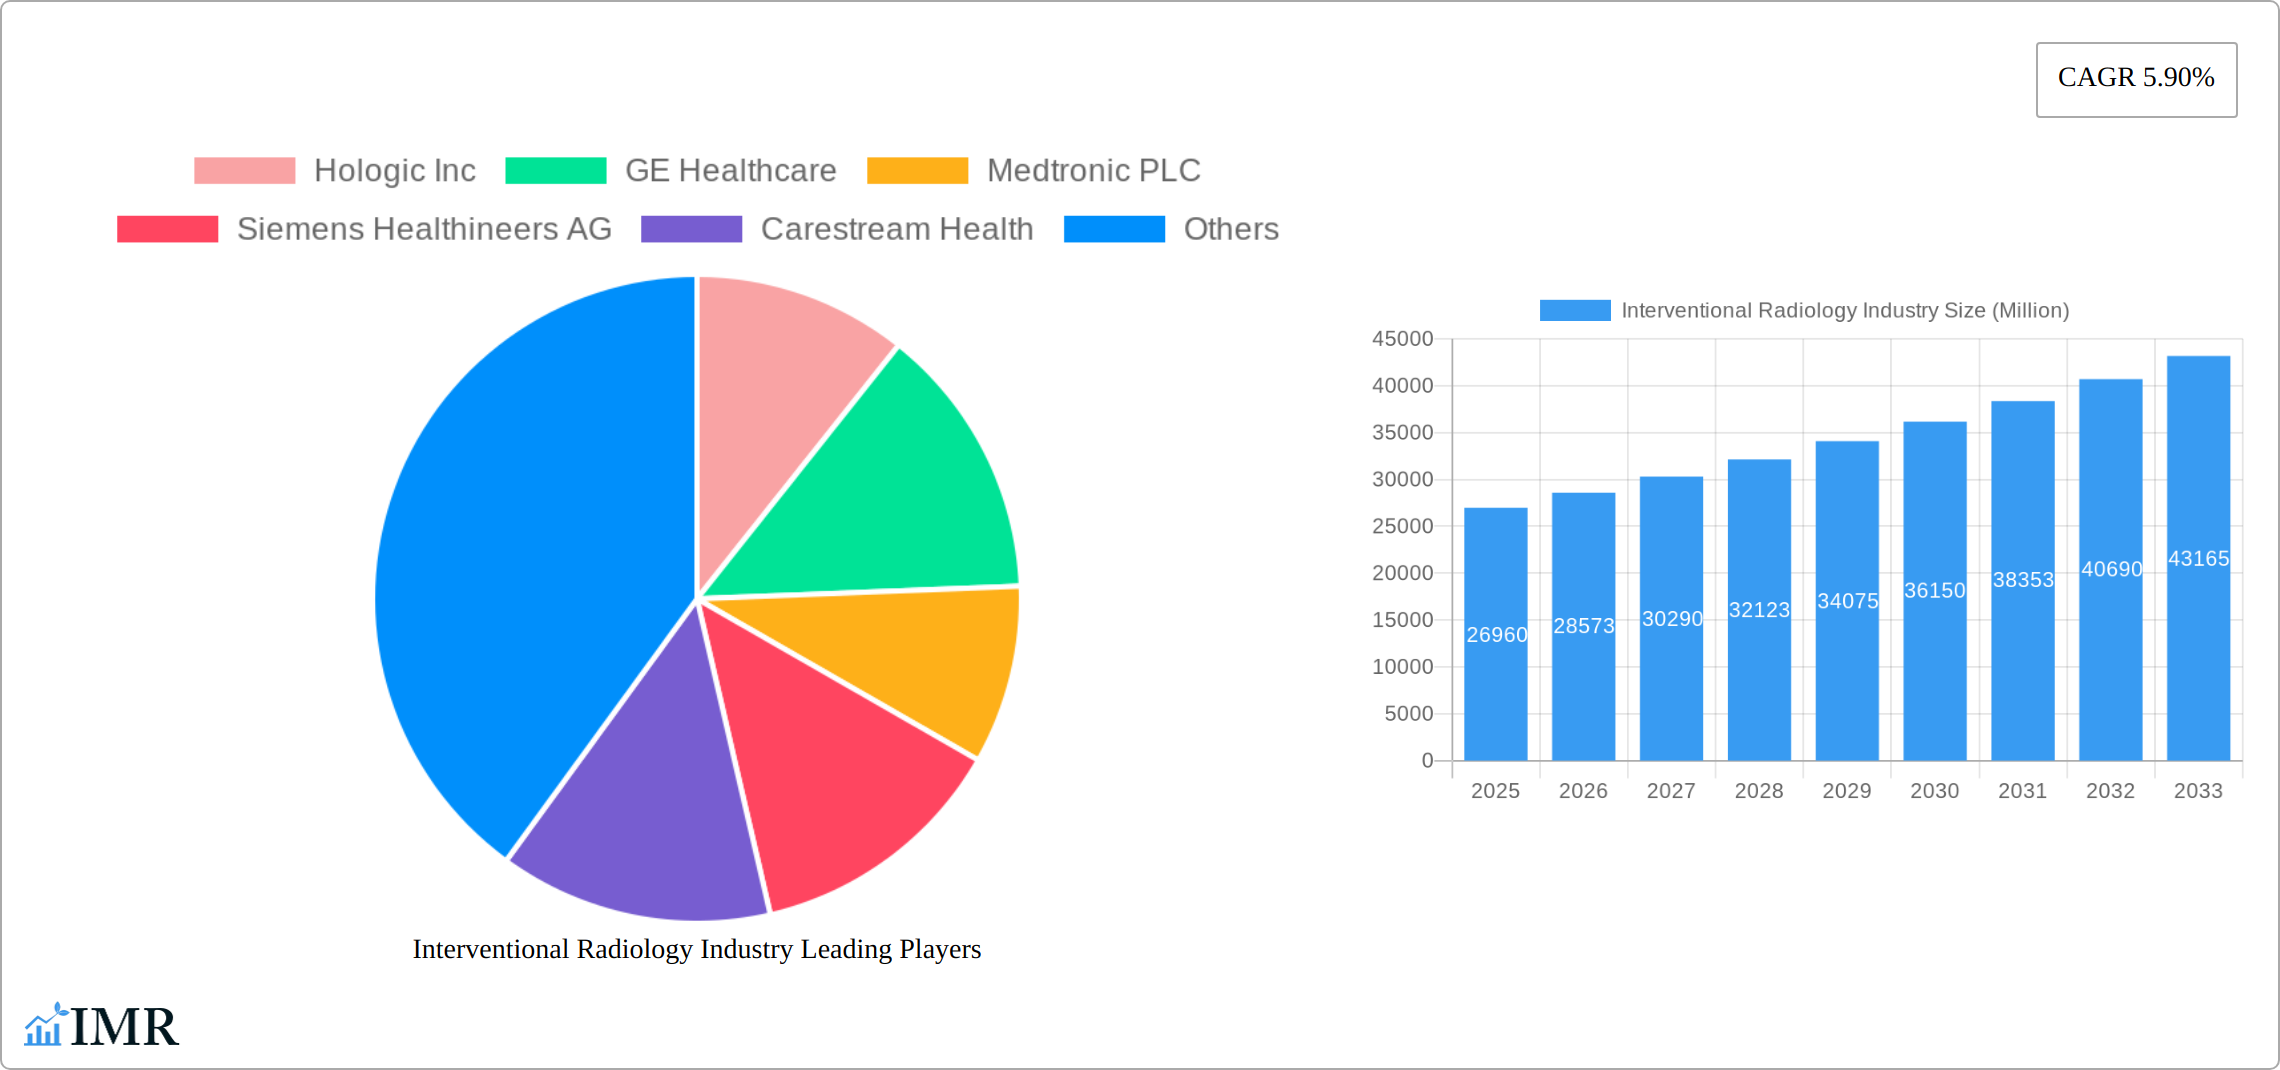
The interventional radiology market, valued at $26.96 billion in 2025, is projected to experience robust growth, driven by a compound annual growth rate (CAGR) of 5.90% from 2025 to 2033. This expansion is fueled by several key factors. Technological advancements, such as the development of minimally invasive procedures and sophisticated imaging systems like advanced MRI and CT scanners, are significantly enhancing diagnostic capabilities and treatment efficacy. The rising prevalence of chronic diseases, including cardiovascular conditions, cancer, and neurological disorders, is creating a substantial demand for interventional radiology procedures. Furthermore, the increasing adoption of image-guided therapies and the growing preference for less invasive procedures over traditional open surgeries are contributing to market growth. Growth is also spurred by an aging global population, leading to increased incidence of age-related illnesses requiring interventional radiology treatment.
Geographic expansion and a shift towards outpatient settings are also key market drivers. The North American region currently dominates the market due to advanced healthcare infrastructure and high adoption rates of advanced technologies. However, Asia-Pacific and other emerging markets are expected to witness significant growth over the forecast period, driven by increasing healthcare expenditure and rising awareness regarding minimally invasive procedures. Despite this positive outlook, challenges remain, including the high cost of equipment and procedures, stringent regulatory approvals, and the need for skilled professionals. Nevertheless, the continuous development of innovative technologies and the expanding scope of applications in various medical specialties are poised to propel market expansion throughout the forecast period. Competition among established players like GE Healthcare, Siemens Healthineers, and Philips, along with emerging market participants, will shape market dynamics.
Interventional Radiology Industry Market Report: 2019-2033
This comprehensive report provides an in-depth analysis of the Interventional Radiology industry, encompassing market dynamics, growth trends, regional analysis, product landscape, key players, and future outlook. With a focus on key segments like MRI Systems, Ultrasound Imaging Systems, and Angiography Systems, this report offers crucial insights for industry professionals, investors, and stakeholders seeking to navigate this dynamic market. The study period covers 2019-2033, with 2025 as the base and estimated year.
Study Period: 2019–2033 Base Year: 2025 Estimated Year: 2025 Forecast Period: 2025–2033 Historical Period: 2019–2024
Interventional Radiology Industry Market Dynamics & Structure
The Interventional Radiology market, valued at $xx million in 2024, is characterized by moderate concentration with several key players vying for market share. Technological innovation, particularly in image processing and minimally invasive procedures, is a primary growth driver. Stringent regulatory frameworks governing medical devices significantly impact market access and product development. The market faces competition from alternative diagnostic and therapeutic techniques. The end-user demographic comprises hospitals, specialized clinics, and ambulatory surgery centers. M&A activity remains moderate, with an estimated xx deals completed in 2024.
- Market Concentration: Moderately concentrated, with top 5 players holding approximately xx% market share.
- Technological Innovation: Focus on AI-powered image analysis, robotic-assisted interventions, and improved imaging resolution.
- Regulatory Framework: Stringent regulatory approvals (e.g., FDA, CE marking) create barriers to entry.
- Competitive Substitutes: Alternative therapies and diagnostic methods represent competitive pressures.
- End-User Demographics: Predominantly hospitals, followed by specialized clinics and ambulatory surgery centers.
- M&A Trends: Moderate level of M&A activity driven by consolidation and expansion into new markets.
Interventional Radiology Industry Growth Trends & Insights
The Interventional Radiology market exhibits a steady growth trajectory, driven by increasing prevalence of chronic diseases, technological advancements, and rising healthcare expenditure. The market size is projected to reach $xx million by 2033, exhibiting a CAGR of xx% during the forecast period. This growth is fueled by the adoption of minimally invasive techniques, improved diagnostic accuracy, and a shift towards outpatient procedures. Technological disruptions, such as AI-integrated image analysis, are further accelerating market penetration. Consumer behavior is shifting towards preference for less invasive procedures with faster recovery times.

Dominant Regions, Countries, or Segments in Interventional Radiology Industry
North America currently dominates the Interventional Radiology market, driven by high healthcare spending, technological advancements, and a large patient pool. Within product segments, Angiography Systems and Ultrasound Imaging Systems are leading, fueled by rising demand for minimally invasive cardiac and vascular procedures. Cardiology and Oncology applications contribute significantly to market growth. Europe follows as a major regional market, while Asia-Pacific is poised for significant growth in the coming years due to rising disposable incomes and healthcare infrastructure developments.
- Key Regional Drivers:
- North America: High healthcare expenditure, advanced healthcare infrastructure, and technological innovation.
- Europe: Growing adoption of advanced imaging technologies and increasing prevalence of chronic diseases.
- Asia-Pacific: Rising healthcare spending, growing awareness, and improving healthcare infrastructure.
- Leading Product Segments: Angiography Systems and Ultrasound Imaging Systems show highest growth potential.
- Dominant Applications: Cardiology and Oncology are major application areas driving market growth.
Interventional Radiology Industry Product Landscape
The Interventional Radiology product landscape is characterized by continuous innovation focused on enhancing image quality, improving procedural efficiency, and reducing invasiveness. Products like advanced angiography systems with integrated 3D imaging capabilities, high-resolution ultrasound systems with improved contrast resolution, and minimally invasive biopsy devices are gaining traction. Unique selling propositions focus on enhanced image quality, reduced procedure times, and improved patient outcomes. Technological advancements like AI-powered image analysis and robotic assistance are reshaping the product landscape.
Key Drivers, Barriers & Challenges in Interventional Radiology Industry
Key Drivers:
- Rising prevalence of chronic diseases requiring interventional procedures.
- Technological advancements leading to improved image quality and minimally invasive techniques.
- Increased healthcare expenditure and insurance coverage for interventional radiology procedures.
Key Challenges:
- High cost of equipment and procedures limiting market accessibility in certain regions.
- Stringent regulatory approvals creating barriers to entry for new players.
- Skilled workforce shortage limiting capacity and service availability.
Emerging Opportunities in Interventional Radiology Industry
- Expansion into untapped markets in developing economies with growing healthcare infrastructure.
- Development of innovative applications of AI and machine learning in image analysis and procedural guidance.
- Growing demand for minimally invasive procedures and personalized medicine approaches.
Growth Accelerators in the Interventional Radiology Industry
Technological breakthroughs, particularly in AI-powered image analysis and robotic assistance, are key catalysts for long-term growth. Strategic partnerships between device manufacturers and healthcare providers are facilitating market penetration. Expansion into new geographical markets and development of innovative applications are driving market expansion.
Key Players Shaping the Interventional Radiology Industry Market
- Hologic Inc
- GE Healthcare
- Medtronic PLC
- Siemens Healthineers AG
- Carestream Health
- Koninklijke Philips NV
- Canon Medical Systems Corporation
- Cook Medical
- Esaote SPA
- Shimadzu Corporation
- Samsung Medison (Samsung Electronics Co Ltd)
- Fujifilm Holdings Corporation
Notable Milestones in Interventional Radiology Industry Sector
- November 2022: Konica Minolta Healthcare Americas launched the Sonimage MX1 Platinum point-of-care ultrasound system.
- November 2022: Fujifilm Healthcare Americas Corporation launched the Scenaria View Focus Edition CT system with Cardio StillShot.
- October 2022: GE Healthcare launched the Omni Legend all-digital PET/CT platform.
In-Depth Interventional Radiology Industry Market Outlook
The Interventional Radiology market is poised for continued growth, driven by technological advancements, increasing prevalence of chronic diseases, and rising healthcare spending. Strategic partnerships, expansion into emerging markets, and the development of innovative applications will shape the future market landscape. The focus on minimally invasive procedures and personalized medicine will further fuel market expansion, presenting significant opportunities for players in the industry.
Interventional Radiology Industry Segmentation
-
1. Product
- 1.1. MRI Systems
- 1.2. Ultrasound Imaging Systems
- 1.3. CT Scanners
- 1.4. Angiography Systems
- 1.5. Fluoroscopy Systems
- 1.6. Biopsy Devices
- 1.7. Other Products
-
2. Application
- 2.1. Cardiology
- 2.2. Urology and Nephrology
- 2.3. Oncology
- 2.4. Gastroenterology
- 2.5. Other Applications
Interventional Radiology Industry Segmentation By Geography
-
1. North America
- 1.1. United States
- 1.2. Canada
- 1.3. Mexico
-
2. Europe
- 2.1. Germany
- 2.2. United Kingdom
- 2.3. France
- 2.4. Italy
- 2.5. Spain
- 2.6. Rest of Europe
-
3. Asia Pacific
- 3.1. China
- 3.2. Japan
- 3.3. India
- 3.4. Australia
- 3.5. South Korea
- 3.6. Rest of Asia Pacific
-
4. Middle East and Africa
- 4.1. GCC
- 4.2. South Africa
- 4.3. Rest of Middle East and Africa
-
5. South America
- 5.1. Brazil
- 5.2. Argentina
- 5.3. Rest of South America

Interventional Radiology Industry REPORT HIGHLIGHTS
| Aspects | Details |
|---|---|
| Study Period | 2019-2033 |
| Base Year | 2024 |
| Estimated Year | 2025 |
| Forecast Period | 2025-2033 |
| Historical Period | 2019-2024 |
| Growth Rate | CAGR of 5.90% from 2019-2033 |
| Segmentation |
|
Table of Contents
- 1. Introduction
- 1.1. Research Scope
- 1.2. Market Segmentation
- 1.3. Research Methodology
- 1.4. Definitions and Assumptions
- 2. Executive Summary
- 2.1. Introduction
- 3. Market Dynamics
- 3.1. Introduction
- 3.2. Market Drivers
- 3.2.1. Increasing Burden of Chronic Diseases; Technological Advancements in Interventional Radiology Devices
- 3.3. Market Restrains
- 3.3.1. Risk of High Radiation Exposure; High Cost of Equipment
- 3.4. Market Trends
- 3.4.1. The Cardiology Application is Expected to Witness High Growth Over the Forecast Period
- 4. Market Factor Analysis
- 4.1. Porters Five Forces
- 4.2. Supply/Value Chain
- 4.3. PESTEL analysis
- 4.4. Market Entropy
- 4.5. Patent/Trademark Analysis
- 5. Global Interventional Radiology Industry Analysis, Insights and Forecast, 2019-2031
- 5.1. Market Analysis, Insights and Forecast - by Product
- 5.1.1. MRI Systems
- 5.1.2. Ultrasound Imaging Systems
- 5.1.3. CT Scanners
- 5.1.4. Angiography Systems
- 5.1.5. Fluoroscopy Systems
- 5.1.6. Biopsy Devices
- 5.1.7. Other Products
- 5.2. Market Analysis, Insights and Forecast - by Application
- 5.2.1. Cardiology
- 5.2.2. Urology and Nephrology
- 5.2.3. Oncology
- 5.2.4. Gastroenterology
- 5.2.5. Other Applications
- 5.3. Market Analysis, Insights and Forecast - by Region
- 5.3.1. North America
- 5.3.2. Europe
- 5.3.3. Asia Pacific
- 5.3.4. Middle East and Africa
- 5.3.5. South America
- 5.1. Market Analysis, Insights and Forecast - by Product
- 6. North America Interventional Radiology Industry Analysis, Insights and Forecast, 2019-2031
- 6.1. Market Analysis, Insights and Forecast - by Product
- 6.1.1. MRI Systems
- 6.1.2. Ultrasound Imaging Systems
- 6.1.3. CT Scanners
- 6.1.4. Angiography Systems
- 6.1.5. Fluoroscopy Systems
- 6.1.6. Biopsy Devices
- 6.1.7. Other Products
- 6.2. Market Analysis, Insights and Forecast - by Application
- 6.2.1. Cardiology
- 6.2.2. Urology and Nephrology
- 6.2.3. Oncology
- 6.2.4. Gastroenterology
- 6.2.5. Other Applications
- 6.1. Market Analysis, Insights and Forecast - by Product
- 7. Europe Interventional Radiology Industry Analysis, Insights and Forecast, 2019-2031
- 7.1. Market Analysis, Insights and Forecast - by Product
- 7.1.1. MRI Systems
- 7.1.2. Ultrasound Imaging Systems
- 7.1.3. CT Scanners
- 7.1.4. Angiography Systems
- 7.1.5. Fluoroscopy Systems
- 7.1.6. Biopsy Devices
- 7.1.7. Other Products
- 7.2. Market Analysis, Insights and Forecast - by Application
- 7.2.1. Cardiology
- 7.2.2. Urology and Nephrology
- 7.2.3. Oncology
- 7.2.4. Gastroenterology
- 7.2.5. Other Applications
- 7.1. Market Analysis, Insights and Forecast - by Product
- 8. Asia Pacific Interventional Radiology Industry Analysis, Insights and Forecast, 2019-2031
- 8.1. Market Analysis, Insights and Forecast - by Product
- 8.1.1. MRI Systems
- 8.1.2. Ultrasound Imaging Systems
- 8.1.3. CT Scanners
- 8.1.4. Angiography Systems
- 8.1.5. Fluoroscopy Systems
- 8.1.6. Biopsy Devices
- 8.1.7. Other Products
- 8.2. Market Analysis, Insights and Forecast - by Application
- 8.2.1. Cardiology
- 8.2.2. Urology and Nephrology
- 8.2.3. Oncology
- 8.2.4. Gastroenterology
- 8.2.5. Other Applications
- 8.1. Market Analysis, Insights and Forecast - by Product
- 9. Middle East and Africa Interventional Radiology Industry Analysis, Insights and Forecast, 2019-2031
- 9.1. Market Analysis, Insights and Forecast - by Product
- 9.1.1. MRI Systems
- 9.1.2. Ultrasound Imaging Systems
- 9.1.3. CT Scanners
- 9.1.4. Angiography Systems
- 9.1.5. Fluoroscopy Systems
- 9.1.6. Biopsy Devices
- 9.1.7. Other Products
- 9.2. Market Analysis, Insights and Forecast - by Application
- 9.2.1. Cardiology
- 9.2.2. Urology and Nephrology
- 9.2.3. Oncology
- 9.2.4. Gastroenterology
- 9.2.5. Other Applications
- 9.1. Market Analysis, Insights and Forecast - by Product
- 10. South America Interventional Radiology Industry Analysis, Insights and Forecast, 2019-2031
- 10.1. Market Analysis, Insights and Forecast - by Product
- 10.1.1. MRI Systems
- 10.1.2. Ultrasound Imaging Systems
- 10.1.3. CT Scanners
- 10.1.4. Angiography Systems
- 10.1.5. Fluoroscopy Systems
- 10.1.6. Biopsy Devices
- 10.1.7. Other Products
- 10.2. Market Analysis, Insights and Forecast - by Application
- 10.2.1. Cardiology
- 10.2.2. Urology and Nephrology
- 10.2.3. Oncology
- 10.2.4. Gastroenterology
- 10.2.5. Other Applications
- 10.1. Market Analysis, Insights and Forecast - by Product
- 11. North America Interventional Radiology Industry Analysis, Insights and Forecast, 2019-2031
- 11.1. Market Analysis, Insights and Forecast - By Country/Sub-region
- 11.1.1 United States
- 11.1.2 Canada
- 11.1.3 Mexico
- 12. Europe Interventional Radiology Industry Analysis, Insights and Forecast, 2019-2031
- 12.1. Market Analysis, Insights and Forecast - By Country/Sub-region
- 12.1.1 Germany
- 12.1.2 United Kingdom
- 12.1.3 France
- 12.1.4 Italy
- 12.1.5 Spain
- 12.1.6 Rest of Europe
- 13. Asia Pacific Interventional Radiology Industry Analysis, Insights and Forecast, 2019-2031
- 13.1. Market Analysis, Insights and Forecast - By Country/Sub-region
- 13.1.1 China
- 13.1.2 Japan
- 13.1.3 India
- 13.1.4 Australia
- 13.1.5 South Korea
- 13.1.6 Rest of Asia Pacific
- 14. South America Interventional Radiology Industry Analysis, Insights and Forecast, 2019-2031
- 14.1. Market Analysis, Insights and Forecast - By Country/Sub-region
- 14.1.1 Brazil
- 14.1.2 Argentina
- 14.1.3 Rest of South America
- 15. Middle East and Africa Interventional Radiology Industry Analysis, Insights and Forecast, 2019-2031
- 15.1. Market Analysis, Insights and Forecast - By Country/Sub-region
- 15.1.1 GCC
- 15.1.2 South Africa
- 15.1.3 Rest of Middle East and Africa
- 16. Competitive Analysis
- 16.1. Global Market Share Analysis 2024
- 16.2. Company Profiles
- 16.2.1 Hologic Inc
- 16.2.1.1. Overview
- 16.2.1.2. Products
- 16.2.1.3. SWOT Analysis
- 16.2.1.4. Recent Developments
- 16.2.1.5. Financials (Based on Availability)
- 16.2.2 GE Healthcare
- 16.2.2.1. Overview
- 16.2.2.2. Products
- 16.2.2.3. SWOT Analysis
- 16.2.2.4. Recent Developments
- 16.2.2.5. Financials (Based on Availability)
- 16.2.3 Medtronic PLC
- 16.2.3.1. Overview
- 16.2.3.2. Products
- 16.2.3.3. SWOT Analysis
- 16.2.3.4. Recent Developments
- 16.2.3.5. Financials (Based on Availability)
- 16.2.4 Siemens Healthineers AG
- 16.2.4.1. Overview
- 16.2.4.2. Products
- 16.2.4.3. SWOT Analysis
- 16.2.4.4. Recent Developments
- 16.2.4.5. Financials (Based on Availability)
- 16.2.5 Carestream Health
- 16.2.5.1. Overview
- 16.2.5.2. Products
- 16.2.5.3. SWOT Analysis
- 16.2.5.4. Recent Developments
- 16.2.5.5. Financials (Based on Availability)
- 16.2.6 Koninklijke Philips NV
- 16.2.6.1. Overview
- 16.2.6.2. Products
- 16.2.6.3. SWOT Analysis
- 16.2.6.4. Recent Developments
- 16.2.6.5. Financials (Based on Availability)
- 16.2.7 Canon Medical Systems Corporation
- 16.2.7.1. Overview
- 16.2.7.2. Products
- 16.2.7.3. SWOT Analysis
- 16.2.7.4. Recent Developments
- 16.2.7.5. Financials (Based on Availability)
- 16.2.8 Cook Medical
- 16.2.8.1. Overview
- 16.2.8.2. Products
- 16.2.8.3. SWOT Analysis
- 16.2.8.4. Recent Developments
- 16.2.8.5. Financials (Based on Availability)
- 16.2.9 Esaote SPA
- 16.2.9.1. Overview
- 16.2.9.2. Products
- 16.2.9.3. SWOT Analysis
- 16.2.9.4. Recent Developments
- 16.2.9.5. Financials (Based on Availability)
- 16.2.10 Shimadzu Corporation
- 16.2.10.1. Overview
- 16.2.10.2. Products
- 16.2.10.3. SWOT Analysis
- 16.2.10.4. Recent Developments
- 16.2.10.5. Financials (Based on Availability)
- 16.2.11 Samsung Medison (Samsung Electronics Co Ltd)
- 16.2.11.1. Overview
- 16.2.11.2. Products
- 16.2.11.3. SWOT Analysis
- 16.2.11.4. Recent Developments
- 16.2.11.5. Financials (Based on Availability)
- 16.2.12 Fujifilm Holdings Corporation
- 16.2.12.1. Overview
- 16.2.12.2. Products
- 16.2.12.3. SWOT Analysis
- 16.2.12.4. Recent Developments
- 16.2.12.5. Financials (Based on Availability)
- 16.2.1 Hologic Inc
List of Figures
- Figure 1: Global Interventional Radiology Industry Revenue Breakdown (Million, %) by Region 2024 & 2032
- Figure 2: North America Interventional Radiology Industry Revenue (Million), by Country 2024 & 2032
- Figure 3: North America Interventional Radiology Industry Revenue Share (%), by Country 2024 & 2032
- Figure 4: Europe Interventional Radiology Industry Revenue (Million), by Country 2024 & 2032
- Figure 5: Europe Interventional Radiology Industry Revenue Share (%), by Country 2024 & 2032
- Figure 6: Asia Pacific Interventional Radiology Industry Revenue (Million), by Country 2024 & 2032
- Figure 7: Asia Pacific Interventional Radiology Industry Revenue Share (%), by Country 2024 & 2032
- Figure 8: South America Interventional Radiology Industry Revenue (Million), by Country 2024 & 2032
- Figure 9: South America Interventional Radiology Industry Revenue Share (%), by Country 2024 & 2032
- Figure 10: Middle East and Africa Interventional Radiology Industry Revenue (Million), by Country 2024 & 2032
- Figure 11: Middle East and Africa Interventional Radiology Industry Revenue Share (%), by Country 2024 & 2032
- Figure 12: North America Interventional Radiology Industry Revenue (Million), by Product 2024 & 2032
- Figure 13: North America Interventional Radiology Industry Revenue Share (%), by Product 2024 & 2032
- Figure 14: North America Interventional Radiology Industry Revenue (Million), by Application 2024 & 2032
- Figure 15: North America Interventional Radiology Industry Revenue Share (%), by Application 2024 & 2032
- Figure 16: North America Interventional Radiology Industry Revenue (Million), by Country 2024 & 2032
- Figure 17: North America Interventional Radiology Industry Revenue Share (%), by Country 2024 & 2032
- Figure 18: Europe Interventional Radiology Industry Revenue (Million), by Product 2024 & 2032
- Figure 19: Europe Interventional Radiology Industry Revenue Share (%), by Product 2024 & 2032
- Figure 20: Europe Interventional Radiology Industry Revenue (Million), by Application 2024 & 2032
- Figure 21: Europe Interventional Radiology Industry Revenue Share (%), by Application 2024 & 2032
- Figure 22: Europe Interventional Radiology Industry Revenue (Million), by Country 2024 & 2032
- Figure 23: Europe Interventional Radiology Industry Revenue Share (%), by Country 2024 & 2032
- Figure 24: Asia Pacific Interventional Radiology Industry Revenue (Million), by Product 2024 & 2032
- Figure 25: Asia Pacific Interventional Radiology Industry Revenue Share (%), by Product 2024 & 2032
- Figure 26: Asia Pacific Interventional Radiology Industry Revenue (Million), by Application 2024 & 2032
- Figure 27: Asia Pacific Interventional Radiology Industry Revenue Share (%), by Application 2024 & 2032
- Figure 28: Asia Pacific Interventional Radiology Industry Revenue (Million), by Country 2024 & 2032
- Figure 29: Asia Pacific Interventional Radiology Industry Revenue Share (%), by Country 2024 & 2032
- Figure 30: Middle East and Africa Interventional Radiology Industry Revenue (Million), by Product 2024 & 2032
- Figure 31: Middle East and Africa Interventional Radiology Industry Revenue Share (%), by Product 2024 & 2032
- Figure 32: Middle East and Africa Interventional Radiology Industry Revenue (Million), by Application 2024 & 2032
- Figure 33: Middle East and Africa Interventional Radiology Industry Revenue Share (%), by Application 2024 & 2032
- Figure 34: Middle East and Africa Interventional Radiology Industry Revenue (Million), by Country 2024 & 2032
- Figure 35: Middle East and Africa Interventional Radiology Industry Revenue Share (%), by Country 2024 & 2032
- Figure 36: South America Interventional Radiology Industry Revenue (Million), by Product 2024 & 2032
- Figure 37: South America Interventional Radiology Industry Revenue Share (%), by Product 2024 & 2032
- Figure 38: South America Interventional Radiology Industry Revenue (Million), by Application 2024 & 2032
- Figure 39: South America Interventional Radiology Industry Revenue Share (%), by Application 2024 & 2032
- Figure 40: South America Interventional Radiology Industry Revenue (Million), by Country 2024 & 2032
- Figure 41: South America Interventional Radiology Industry Revenue Share (%), by Country 2024 & 2032
List of Tables
- Table 1: Global Interventional Radiology Industry Revenue Million Forecast, by Region 2019 & 2032
- Table 2: Global Interventional Radiology Industry Revenue Million Forecast, by Product 2019 & 2032
- Table 3: Global Interventional Radiology Industry Revenue Million Forecast, by Application 2019 & 2032
- Table 4: Global Interventional Radiology Industry Revenue Million Forecast, by Region 2019 & 2032
- Table 5: Global Interventional Radiology Industry Revenue Million Forecast, by Country 2019 & 2032
- Table 6: United States Interventional Radiology Industry Revenue (Million) Forecast, by Application 2019 & 2032
- Table 7: Canada Interventional Radiology Industry Revenue (Million) Forecast, by Application 2019 & 2032
- Table 8: Mexico Interventional Radiology Industry Revenue (Million) Forecast, by Application 2019 & 2032
- Table 9: Global Interventional Radiology Industry Revenue Million Forecast, by Country 2019 & 2032
- Table 10: Germany Interventional Radiology Industry Revenue (Million) Forecast, by Application 2019 & 2032
- Table 11: United Kingdom Interventional Radiology Industry Revenue (Million) Forecast, by Application 2019 & 2032
- Table 12: France Interventional Radiology Industry Revenue (Million) Forecast, by Application 2019 & 2032
- Table 13: Italy Interventional Radiology Industry Revenue (Million) Forecast, by Application 2019 & 2032
- Table 14: Spain Interventional Radiology Industry Revenue (Million) Forecast, by Application 2019 & 2032
- Table 15: Rest of Europe Interventional Radiology Industry Revenue (Million) Forecast, by Application 2019 & 2032
- Table 16: Global Interventional Radiology Industry Revenue Million Forecast, by Country 2019 & 2032
- Table 17: China Interventional Radiology Industry Revenue (Million) Forecast, by Application 2019 & 2032
- Table 18: Japan Interventional Radiology Industry Revenue (Million) Forecast, by Application 2019 & 2032
- Table 19: India Interventional Radiology Industry Revenue (Million) Forecast, by Application 2019 & 2032
- Table 20: Australia Interventional Radiology Industry Revenue (Million) Forecast, by Application 2019 & 2032
- Table 21: South Korea Interventional Radiology Industry Revenue (Million) Forecast, by Application 2019 & 2032
- Table 22: Rest of Asia Pacific Interventional Radiology Industry Revenue (Million) Forecast, by Application 2019 & 2032
- Table 23: Global Interventional Radiology Industry Revenue Million Forecast, by Country 2019 & 2032
- Table 24: Brazil Interventional Radiology Industry Revenue (Million) Forecast, by Application 2019 & 2032
- Table 25: Argentina Interventional Radiology Industry Revenue (Million) Forecast, by Application 2019 & 2032
- Table 26: Rest of South America Interventional Radiology Industry Revenue (Million) Forecast, by Application 2019 & 2032
- Table 27: Global Interventional Radiology Industry Revenue Million Forecast, by Country 2019 & 2032
- Table 28: GCC Interventional Radiology Industry Revenue (Million) Forecast, by Application 2019 & 2032
- Table 29: South Africa Interventional Radiology Industry Revenue (Million) Forecast, by Application 2019 & 2032
- Table 30: Rest of Middle East and Africa Interventional Radiology Industry Revenue (Million) Forecast, by Application 2019 & 2032
- Table 31: Global Interventional Radiology Industry Revenue Million Forecast, by Product 2019 & 2032
- Table 32: Global Interventional Radiology Industry Revenue Million Forecast, by Application 2019 & 2032
- Table 33: Global Interventional Radiology Industry Revenue Million Forecast, by Country 2019 & 2032
- Table 34: United States Interventional Radiology Industry Revenue (Million) Forecast, by Application 2019 & 2032
- Table 35: Canada Interventional Radiology Industry Revenue (Million) Forecast, by Application 2019 & 2032
- Table 36: Mexico Interventional Radiology Industry Revenue (Million) Forecast, by Application 2019 & 2032
- Table 37: Global Interventional Radiology Industry Revenue Million Forecast, by Product 2019 & 2032
- Table 38: Global Interventional Radiology Industry Revenue Million Forecast, by Application 2019 & 2032
- Table 39: Global Interventional Radiology Industry Revenue Million Forecast, by Country 2019 & 2032
- Table 40: Germany Interventional Radiology Industry Revenue (Million) Forecast, by Application 2019 & 2032
- Table 41: United Kingdom Interventional Radiology Industry Revenue (Million) Forecast, by Application 2019 & 2032
- Table 42: France Interventional Radiology Industry Revenue (Million) Forecast, by Application 2019 & 2032
- Table 43: Italy Interventional Radiology Industry Revenue (Million) Forecast, by Application 2019 & 2032
- Table 44: Spain Interventional Radiology Industry Revenue (Million) Forecast, by Application 2019 & 2032
- Table 45: Rest of Europe Interventional Radiology Industry Revenue (Million) Forecast, by Application 2019 & 2032
- Table 46: Global Interventional Radiology Industry Revenue Million Forecast, by Product 2019 & 2032
- Table 47: Global Interventional Radiology Industry Revenue Million Forecast, by Application 2019 & 2032
- Table 48: Global Interventional Radiology Industry Revenue Million Forecast, by Country 2019 & 2032
- Table 49: China Interventional Radiology Industry Revenue (Million) Forecast, by Application 2019 & 2032
- Table 50: Japan Interventional Radiology Industry Revenue (Million) Forecast, by Application 2019 & 2032
- Table 51: India Interventional Radiology Industry Revenue (Million) Forecast, by Application 2019 & 2032
- Table 52: Australia Interventional Radiology Industry Revenue (Million) Forecast, by Application 2019 & 2032
- Table 53: South Korea Interventional Radiology Industry Revenue (Million) Forecast, by Application 2019 & 2032
- Table 54: Rest of Asia Pacific Interventional Radiology Industry Revenue (Million) Forecast, by Application 2019 & 2032
- Table 55: Global Interventional Radiology Industry Revenue Million Forecast, by Product 2019 & 2032
- Table 56: Global Interventional Radiology Industry Revenue Million Forecast, by Application 2019 & 2032
- Table 57: Global Interventional Radiology Industry Revenue Million Forecast, by Country 2019 & 2032
- Table 58: GCC Interventional Radiology Industry Revenue (Million) Forecast, by Application 2019 & 2032
- Table 59: South Africa Interventional Radiology Industry Revenue (Million) Forecast, by Application 2019 & 2032
- Table 60: Rest of Middle East and Africa Interventional Radiology Industry Revenue (Million) Forecast, by Application 2019 & 2032
- Table 61: Global Interventional Radiology Industry Revenue Million Forecast, by Product 2019 & 2032
- Table 62: Global Interventional Radiology Industry Revenue Million Forecast, by Application 2019 & 2032
- Table 63: Global Interventional Radiology Industry Revenue Million Forecast, by Country 2019 & 2032
- Table 64: Brazil Interventional Radiology Industry Revenue (Million) Forecast, by Application 2019 & 2032
- Table 65: Argentina Interventional Radiology Industry Revenue (Million) Forecast, by Application 2019 & 2032
- Table 66: Rest of South America Interventional Radiology Industry Revenue (Million) Forecast, by Application 2019 & 2032
Frequently Asked Questions
1. What is the projected Compound Annual Growth Rate (CAGR) of the Interventional Radiology Industry?
The projected CAGR is approximately 5.90%.
2. Which companies are prominent players in the Interventional Radiology Industry?
Key companies in the market include Hologic Inc, GE Healthcare, Medtronic PLC, Siemens Healthineers AG, Carestream Health, Koninklijke Philips NV, Canon Medical Systems Corporation, Cook Medical, Esaote SPA, Shimadzu Corporation, Samsung Medison (Samsung Electronics Co Ltd), Fujifilm Holdings Corporation.
3. What are the main segments of the Interventional Radiology Industry?
The market segments include Product, Application.
4. Can you provide details about the market size?
The market size is estimated to be USD 26.96 Million as of 2022.
5. What are some drivers contributing to market growth?
Increasing Burden of Chronic Diseases; Technological Advancements in Interventional Radiology Devices.
6. What are the notable trends driving market growth?
The Cardiology Application is Expected to Witness High Growth Over the Forecast Period.
7. Are there any restraints impacting market growth?
Risk of High Radiation Exposure; High Cost of Equipment.
8. Can you provide examples of recent developments in the market?
November 2022: Konica Minolta Healthcare Americas launched a new point-of-care ultrasound system called Sonimage MX1 Platinum.
9. What pricing options are available for accessing the report?
Pricing options include single-user, multi-user, and enterprise licenses priced at USD 4750, USD 5250, and USD 8750 respectively.
10. Is the market size provided in terms of value or volume?
The market size is provided in terms of value, measured in Million.
11. Are there any specific market keywords associated with the report?
Yes, the market keyword associated with the report is "Interventional Radiology Industry," which aids in identifying and referencing the specific market segment covered.
12. How do I determine which pricing option suits my needs best?
The pricing options vary based on user requirements and access needs. Individual users may opt for single-user licenses, while businesses requiring broader access may choose multi-user or enterprise licenses for cost-effective access to the report.
13. Are there any additional resources or data provided in the Interventional Radiology Industry report?
While the report offers comprehensive insights, it's advisable to review the specific contents or supplementary materials provided to ascertain if additional resources or data are available.
14. How can I stay updated on further developments or reports in the Interventional Radiology Industry?
To stay informed about further developments, trends, and reports in the Interventional Radiology Industry, consider subscribing to industry newsletters, following relevant companies and organizations, or regularly checking reputable industry news sources and publications.
Methodology
Step 1 - Identification of Relevant Samples Size from Population Database


Step 2 - Approaches for Defining Global Market Size (Value, Volume* & Price*)

Note*: In applicable scenarios
Step 3 - Data Sources
Primary Research
- Web Analytics
- Survey Reports
- Research Institute
- Latest Research Reports
- Opinion Leaders
Secondary Research
- Annual Reports
- White Paper
- Latest Press Release
- Industry Association
- Paid Database
- Investor Presentations

Step 4 - Data Triangulation
Involves using different sources of information in order to increase the validity of a study
These sources are likely to be stakeholders in a program - participants, other researchers, program staff, other community members, and so on.
Then we put all data in single framework & apply various statistical tools to find out the dynamic on the market.
During the analysis stage, feedback from the stakeholder groups would be compared to determine areas of agreement as well as areas of divergence
