

Key Insights
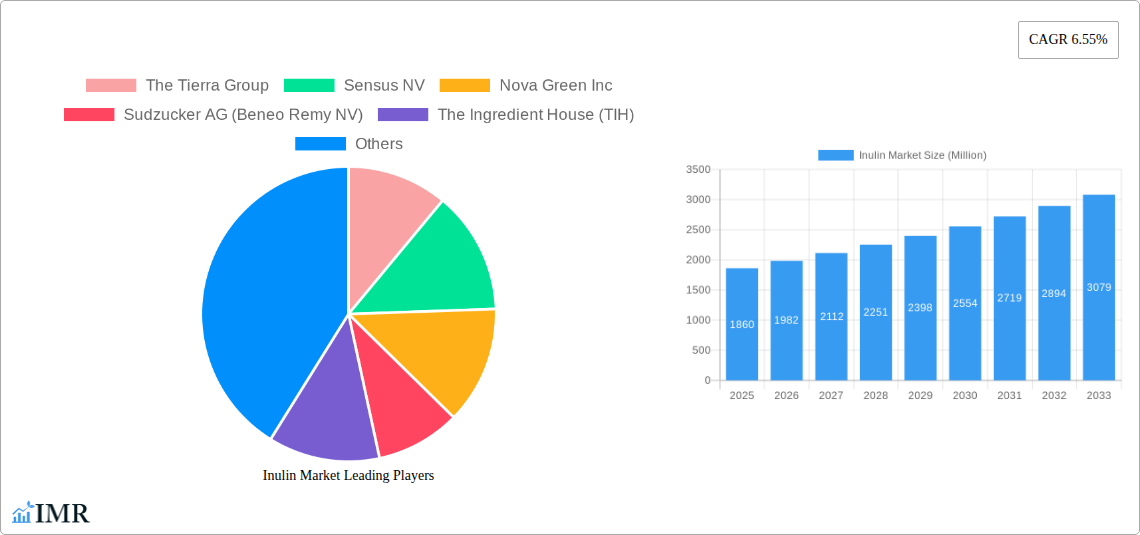
The global inulin market, valued at $1.86 billion in 2025, is projected to experience robust growth, driven by increasing consumer demand for healthier food and beverage options. A Compound Annual Growth Rate (CAGR) of 6.55% from 2025 to 2033 indicates a significant expansion of this market. This growth is fueled by several key factors. The rising prevalence of chronic diseases like diabetes and obesity is driving consumer interest in functional foods and dietary supplements containing prebiotics like inulin, which promotes gut health. Furthermore, the food and beverage industry's increasing focus on clean label products, along with inulin's versatile functionality as a texturizer, sweetener, and fiber source, contributes significantly to its market expansion. Dietary supplements represent a strong growth segment, reflecting consumers' proactive approach to health management. The pharmaceutical industry also utilizes inulin for its prebiotic properties in specific formulations. While supply chain challenges and fluctuations in raw material prices may pose some constraints, the overall market outlook remains positive due to the enduring demand for health-beneficial ingredients.
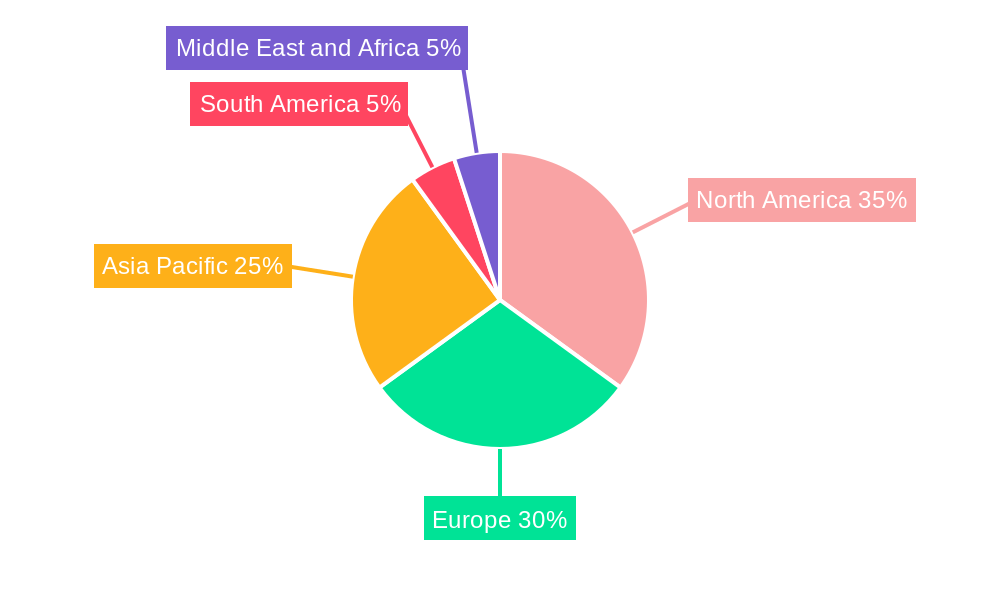
Geographical distribution reveals strong market presence across North America and Europe, driven by high consumer awareness and established markets. However, Asia-Pacific is expected to witness significant growth in the coming years, fuelled by rising disposable incomes, increasing health consciousness, and expanding distribution channels. Key players like Cargill, Beneo (Sudzucker AG), and Cosucra are actively investing in research and development to enhance inulin production and expand application areas, fostering innovation and competition within the market. The diverse range of applications across food and beverages, dietary supplements, and pharmaceuticals ensures the inulin market's long-term growth potential. The focus on sustainability and the increasing availability of organic and sustainably sourced inulin are expected to further boost the market's trajectory in the coming years.
Inulin Market: A Comprehensive Market Report (2019-2033)
This comprehensive report provides an in-depth analysis of the Inulin market, encompassing market dynamics, growth trends, regional dominance, product landscape, key players, and future outlook. The study period covers 2019-2033, with a base year of 2025 and a forecast period of 2025-2033. The report segments the market by application, including Food and Beverage, Other Foods and Beverages, Dietary Supplements, and Pharmaceuticals, providing granular insights into each segment's growth trajectory. The estimated market size in 2025 is xx Million.
Inulin Market Dynamics & Structure
This section analyzes the competitive landscape of the inulin market, focusing on market concentration, technological advancements, regulatory aspects, and market forces impacting growth. The inulin market is characterized by a moderately concentrated structure, with several key players holding significant market share. Technological innovation, particularly in extraction and processing methods, is a major driver, while regulatory frameworks concerning food additives and health claims influence market dynamics. The increasing demand for natural prebiotics and functional foods fuels market expansion, while substitute sweeteners and other fiber sources pose competitive pressures. M&A activity, such as the EUR 30 million investment by Beneo in 2021, reflects the industry's consolidation and growth ambitions.
- Market Concentration: Moderately concentrated, with top 5 players holding xx% market share in 2024.
- Technological Innovation: Focus on improving extraction efficiency and product purity.
- Regulatory Frameworks: Varying regulations across regions influence product labeling and claims.
- Competitive Substitutes: Other prebiotics, dietary fibers, and sweeteners compete for market share.
- M&A Activity: Significant investments and acquisitions indicate industry consolidation and expansion. Total M&A deal value in 2024 estimated at xx Million.
- End-User Demographics: Growing health-conscious consumer base driving demand for functional foods and supplements.
Inulin Market Growth Trends & Insights
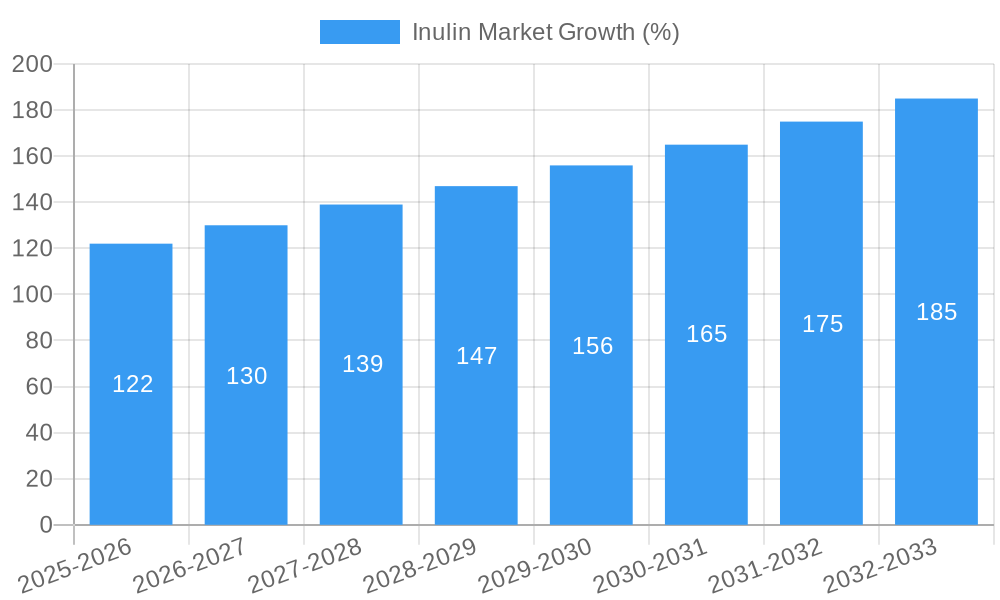
The global inulin market exhibits robust growth, driven by increasing health awareness, rising demand for functional foods, and the growing popularity of plant-based diets. The market witnessed significant expansion during the historical period (2019-2024), with a CAGR of xx%, reaching xx Million in 2024. This growth is expected to continue during the forecast period (2025-2033), with a projected CAGR of xx%, reaching xx Million by 2033. Technological advancements in extraction and processing, coupled with consumer preference shifts towards natural and healthier ingredients, contribute to this positive growth trajectory. Market penetration is particularly high in developed regions, but developing economies show significant growth potential. Adoption rates are increasing across various applications, especially in the food and beverage and dietary supplement sectors.
Dominant Regions, Countries, or Segments in Inulin Market
North America and Europe currently dominate the inulin market, driven by high consumer awareness of health benefits and established regulatory frameworks. However, Asia-Pacific is experiencing rapid growth due to increasing disposable incomes and changing dietary habits. The Food and Beverage segment holds the largest market share, followed by Dietary Supplements. Key drivers for regional dominance include strong economic growth, favorable government policies supporting the functional food industry, and well-developed infrastructure for food processing and distribution.
- North America: High consumer awareness of health benefits, strong regulatory framework.
- Europe: Established market with high consumption of functional foods and supplements.
- Asia-Pacific: Rapid growth potential driven by increasing disposable incomes and dietary changes.
- Food & Beverage: Largest application segment, driven by increased use in food products as a prebiotic fiber.
- Dietary Supplements: Significant growth due to rising demand for natural health solutions.
Inulin Market Product Landscape
The inulin market offers a range of products, including various grades and forms tailored to different applications. Innovations focus on improving solubility, functionality, and taste profiles to enhance product appeal. Key improvements include the development of highly soluble inulin for incorporation into beverages and the creation of inulin blends to optimize specific functionalities. These advancements address consumer preferences for convenient and flavorful products.
Key Drivers, Barriers & Challenges in Inulin Market
Key Drivers:
- Growing health consciousness and demand for prebiotics.
- Increasing adoption of plant-based foods and supplements.
- Technological advancements improving inulin production and quality.
- Favorable regulatory support in certain regions.
Key Barriers & Challenges:
- Price volatility of raw materials (chicory root).
- Competition from alternative fiber sources.
- Stringent regulatory requirements for food and supplement applications.
- Potential supply chain disruptions impacting availability.
Emerging Opportunities in Inulin Market
- Untapped markets in developing economies.
- Novel applications in areas like pet food and cosmetics.
- Growing demand for personalized nutrition solutions utilizing inulin.
- Development of inulin-based products with improved taste and texture.
Growth Accelerators in the Inulin Market Industry
Strategic partnerships between inulin producers and food manufacturers are crucial for accelerating market growth. Technological breakthroughs in production processes are continuously reducing costs and enhancing product quality, making inulin a more attractive ingredient. Market expansion into emerging economies through strategic alliances and distribution channels is another key accelerator.
Key Players Shaping the Inulin Market Market
- The Tierra Group
- Sensus NV
- Nova Green Inc
- Sudzucker AG (Beneo Remy NV)
- The Ingredient House (TIH)
- Ciranda Inc
- Adept Impex Private Limited
- Cosucra Groupe Warcoing SA
- Cargill Inc
- The Green Labs LLC
Notable Milestones in Inulin Market Sector
- March 2022: Sensus announces expansion plans for chicory root fiber (inulin) production.
- December 2021: Beneo invests EUR 30 million (USD 33.9 million) to expand inulin production capacity.
- March 2020: AgranaStarke GmbH acquires Marroquin Organic International Inc., expanding its organic product portfolio.
In-Depth Inulin Market Outlook
The inulin market is poised for sustained growth, driven by increasing consumer demand for healthy and natural ingredients. Strategic partnerships, technological advancements, and market expansion into emerging economies will be key factors driving future market potential. The focus on product innovation and the development of novel applications will further fuel market expansion, creating lucrative opportunities for industry players.
Inulin Market Segmentation
-
1. Application
-
1.1. Food and Beverage
- 1.1.1. Bakery and Confectionery
- 1.1.2. Dairy Products
- 1.1.3. Meat Products
- 1.1.4. Other Foods and Beverages
- 1.2. Dietary Supplements
- 1.3. Pharmaceuticals
-
1.1. Food and Beverage
Inulin Market Segmentation By Geography
-
1. North America
- 1.1. United States
- 1.2. Canada
- 1.3. Mexico
- 1.4. Rest of North America
-
2. Europe
- 2.1. United Kindgom
- 2.2. France
- 2.3. Germany
- 2.4. Spain
- 2.5. Rest of Europe
-
3. Asia Pacific
- 3.1. China
- 3.2. Japan
- 3.3. Australia
- 3.4. India
- 3.5. Rest of Asia Pacific
-
4. South America
- 4.1. Brazil
- 4.2. Argentina
- 4.3. Rest of South America
-
5. Middle East and Africa
- 5.1. South Africa
- 5.2. Saudi Arabia
- 5.3. Rest of Middle East and Africa
Inulin Market REPORT HIGHLIGHTS
| Aspects | Details |
|---|---|
| Study Period | 2019-2033 |
| Base Year | 2024 |
| Estimated Year | 2025 |
| Forecast Period | 2025-2033 |
| Historical Period | 2019-2024 |
| Growth Rate | CAGR of 6.55% from 2019-2033 |
| Segmentation |
|
Table of Contents
- 1. Introduction
- 1.1. Research Scope
- 1.2. Market Segmentation
- 1.3. Research Methodology
- 1.4. Definitions and Assumptions
- 2. Executive Summary
- 2.1. Introduction
- 3. Market Dynamics
- 3.1. Introduction
- 3.2. Market Drivers
- 3.2.1. Wide Applications and Functionality; Demand For Gluten-Free Products
- 3.3. Market Restrains
- 3.3.1. Easy Availability of Economically Feasible Alternatives
- 3.4. Market Trends
- 3.4.1. Growing Consumers’ Interest in Prebiotics
- 4. Market Factor Analysis
- 4.1. Porters Five Forces
- 4.2. Supply/Value Chain
- 4.3. PESTEL analysis
- 4.4. Market Entropy
- 4.5. Patent/Trademark Analysis
- 5. Global Inulin Market Analysis, Insights and Forecast, 2019-2031
- 5.1. Market Analysis, Insights and Forecast - by Application
- 5.1.1. Food and Beverage
- 5.1.1.1. Bakery and Confectionery
- 5.1.1.2. Dairy Products
- 5.1.1.3. Meat Products
- 5.1.1.4. Other Foods and Beverages
- 5.1.2. Dietary Supplements
- 5.1.3. Pharmaceuticals
- 5.1.1. Food and Beverage
- 5.2. Market Analysis, Insights and Forecast - by Region
- 5.2.1. North America
- 5.2.2. Europe
- 5.2.3. Asia Pacific
- 5.2.4. South America
- 5.2.5. Middle East and Africa
- 5.1. Market Analysis, Insights and Forecast - by Application
- 6. North America Inulin Market Analysis, Insights and Forecast, 2019-2031
- 6.1. Market Analysis, Insights and Forecast - by Application
- 6.1.1. Food and Beverage
- 6.1.1.1. Bakery and Confectionery
- 6.1.1.2. Dairy Products
- 6.1.1.3. Meat Products
- 6.1.1.4. Other Foods and Beverages
- 6.1.2. Dietary Supplements
- 6.1.3. Pharmaceuticals
- 6.1.1. Food and Beverage
- 6.1. Market Analysis, Insights and Forecast - by Application
- 7. Europe Inulin Market Analysis, Insights and Forecast, 2019-2031
- 7.1. Market Analysis, Insights and Forecast - by Application
- 7.1.1. Food and Beverage
- 7.1.1.1. Bakery and Confectionery
- 7.1.1.2. Dairy Products
- 7.1.1.3. Meat Products
- 7.1.1.4. Other Foods and Beverages
- 7.1.2. Dietary Supplements
- 7.1.3. Pharmaceuticals
- 7.1.1. Food and Beverage
- 7.1. Market Analysis, Insights and Forecast - by Application
- 8. Asia Pacific Inulin Market Analysis, Insights and Forecast, 2019-2031
- 8.1. Market Analysis, Insights and Forecast - by Application
- 8.1.1. Food and Beverage
- 8.1.1.1. Bakery and Confectionery
- 8.1.1.2. Dairy Products
- 8.1.1.3. Meat Products
- 8.1.1.4. Other Foods and Beverages
- 8.1.2. Dietary Supplements
- 8.1.3. Pharmaceuticals
- 8.1.1. Food and Beverage
- 8.1. Market Analysis, Insights and Forecast - by Application
- 9. South America Inulin Market Analysis, Insights and Forecast, 2019-2031
- 9.1. Market Analysis, Insights and Forecast - by Application
- 9.1.1. Food and Beverage
- 9.1.1.1. Bakery and Confectionery
- 9.1.1.2. Dairy Products
- 9.1.1.3. Meat Products
- 9.1.1.4. Other Foods and Beverages
- 9.1.2. Dietary Supplements
- 9.1.3. Pharmaceuticals
- 9.1.1. Food and Beverage
- 9.1. Market Analysis, Insights and Forecast - by Application
- 10. Middle East and Africa Inulin Market Analysis, Insights and Forecast, 2019-2031
- 10.1. Market Analysis, Insights and Forecast - by Application
- 10.1.1. Food and Beverage
- 10.1.1.1. Bakery and Confectionery
- 10.1.1.2. Dairy Products
- 10.1.1.3. Meat Products
- 10.1.1.4. Other Foods and Beverages
- 10.1.2. Dietary Supplements
- 10.1.3. Pharmaceuticals
- 10.1.1. Food and Beverage
- 10.1. Market Analysis, Insights and Forecast - by Application
- 11. North America Inulin Market Analysis, Insights and Forecast, 2019-2031
- 11.1. Market Analysis, Insights and Forecast - By Country/Sub-region
- 11.1.1 United States
- 11.1.2 Canada
- 11.1.3 Mexico
- 11.1.4 Rest of North America
- 12. Europe Inulin Market Analysis, Insights and Forecast, 2019-2031
- 12.1. Market Analysis, Insights and Forecast - By Country/Sub-region
- 12.1.1 United Kindgom
- 12.1.2 France
- 12.1.3 Germany
- 12.1.4 Spain
- 12.1.5 Rest of Europe
- 13. Asia Pacific Inulin Market Analysis, Insights and Forecast, 2019-2031
- 13.1. Market Analysis, Insights and Forecast - By Country/Sub-region
- 13.1.1 China
- 13.1.2 Japan
- 13.1.3 Australia
- 13.1.4 India
- 13.1.5 Rest of Asia Pacific
- 14. South America Inulin Market Analysis, Insights and Forecast, 2019-2031
- 14.1. Market Analysis, Insights and Forecast - By Country/Sub-region
- 14.1.1 Brazil
- 14.1.2 Argentina
- 14.1.3 Rest of South America
- 15. Middle East and Africa Inulin Market Analysis, Insights and Forecast, 2019-2031
- 15.1. Market Analysis, Insights and Forecast - By Country/Sub-region
- 15.1.1 South Africa
- 15.1.2 Saudi Arabia
- 15.1.3 Rest of Middle East and Africa
- 16. Competitive Analysis
- 16.1. Global Market Share Analysis 2024
- 16.2. Company Profiles
- 16.2.1 The Tierra Group
- 16.2.1.1. Overview
- 16.2.1.2. Products
- 16.2.1.3. SWOT Analysis
- 16.2.1.4. Recent Developments
- 16.2.1.5. Financials (Based on Availability)
- 16.2.2 Sensus NV
- 16.2.2.1. Overview
- 16.2.2.2. Products
- 16.2.2.3. SWOT Analysis
- 16.2.2.4. Recent Developments
- 16.2.2.5. Financials (Based on Availability)
- 16.2.3 Nova Green Inc
- 16.2.3.1. Overview
- 16.2.3.2. Products
- 16.2.3.3. SWOT Analysis
- 16.2.3.4. Recent Developments
- 16.2.3.5. Financials (Based on Availability)
- 16.2.4 Sudzucker AG (Beneo Remy NV)
- 16.2.4.1. Overview
- 16.2.4.2. Products
- 16.2.4.3. SWOT Analysis
- 16.2.4.4. Recent Developments
- 16.2.4.5. Financials (Based on Availability)
- 16.2.5 The Ingredient House (TIH)
- 16.2.5.1. Overview
- 16.2.5.2. Products
- 16.2.5.3. SWOT Analysis
- 16.2.5.4. Recent Developments
- 16.2.5.5. Financials (Based on Availability)
- 16.2.6 Ciranda Inc
- 16.2.6.1. Overview
- 16.2.6.2. Products
- 16.2.6.3. SWOT Analysis
- 16.2.6.4. Recent Developments
- 16.2.6.5. Financials (Based on Availability)
- 16.2.7 Adept Impex Private Limited
- 16.2.7.1. Overview
- 16.2.7.2. Products
- 16.2.7.3. SWOT Analysis
- 16.2.7.4. Recent Developments
- 16.2.7.5. Financials (Based on Availability)
- 16.2.8 Cosucra Groupe Warcoing SA
- 16.2.8.1. Overview
- 16.2.8.2. Products
- 16.2.8.3. SWOT Analysis
- 16.2.8.4. Recent Developments
- 16.2.8.5. Financials (Based on Availability)
- 16.2.9 Cargill Inc
- 16.2.9.1. Overview
- 16.2.9.2. Products
- 16.2.9.3. SWOT Analysis
- 16.2.9.4. Recent Developments
- 16.2.9.5. Financials (Based on Availability)
- 16.2.10 The Green Labs LLC*List Not Exhaustive
- 16.2.10.1. Overview
- 16.2.10.2. Products
- 16.2.10.3. SWOT Analysis
- 16.2.10.4. Recent Developments
- 16.2.10.5. Financials (Based on Availability)
- 16.2.1 The Tierra Group
List of Figures
- Figure 1: Global Inulin Market Revenue Breakdown (Million, %) by Region 2024 & 2032
- Figure 2: North America Inulin Market Revenue (Million), by Country 2024 & 2032
- Figure 3: North America Inulin Market Revenue Share (%), by Country 2024 & 2032
- Figure 4: Europe Inulin Market Revenue (Million), by Country 2024 & 2032
- Figure 5: Europe Inulin Market Revenue Share (%), by Country 2024 & 2032
- Figure 6: Asia Pacific Inulin Market Revenue (Million), by Country 2024 & 2032
- Figure 7: Asia Pacific Inulin Market Revenue Share (%), by Country 2024 & 2032
- Figure 8: South America Inulin Market Revenue (Million), by Country 2024 & 2032
- Figure 9: South America Inulin Market Revenue Share (%), by Country 2024 & 2032
- Figure 10: Middle East and Africa Inulin Market Revenue (Million), by Country 2024 & 2032
- Figure 11: Middle East and Africa Inulin Market Revenue Share (%), by Country 2024 & 2032
- Figure 12: North America Inulin Market Revenue (Million), by Application 2024 & 2032
- Figure 13: North America Inulin Market Revenue Share (%), by Application 2024 & 2032
- Figure 14: North America Inulin Market Revenue (Million), by Country 2024 & 2032
- Figure 15: North America Inulin Market Revenue Share (%), by Country 2024 & 2032
- Figure 16: Europe Inulin Market Revenue (Million), by Application 2024 & 2032
- Figure 17: Europe Inulin Market Revenue Share (%), by Application 2024 & 2032
- Figure 18: Europe Inulin Market Revenue (Million), by Country 2024 & 2032
- Figure 19: Europe Inulin Market Revenue Share (%), by Country 2024 & 2032
- Figure 20: Asia Pacific Inulin Market Revenue (Million), by Application 2024 & 2032
- Figure 21: Asia Pacific Inulin Market Revenue Share (%), by Application 2024 & 2032
- Figure 22: Asia Pacific Inulin Market Revenue (Million), by Country 2024 & 2032
- Figure 23: Asia Pacific Inulin Market Revenue Share (%), by Country 2024 & 2032
- Figure 24: South America Inulin Market Revenue (Million), by Application 2024 & 2032
- Figure 25: South America Inulin Market Revenue Share (%), by Application 2024 & 2032
- Figure 26: South America Inulin Market Revenue (Million), by Country 2024 & 2032
- Figure 27: South America Inulin Market Revenue Share (%), by Country 2024 & 2032
- Figure 28: Middle East and Africa Inulin Market Revenue (Million), by Application 2024 & 2032
- Figure 29: Middle East and Africa Inulin Market Revenue Share (%), by Application 2024 & 2032
- Figure 30: Middle East and Africa Inulin Market Revenue (Million), by Country 2024 & 2032
- Figure 31: Middle East and Africa Inulin Market Revenue Share (%), by Country 2024 & 2032
List of Tables
- Table 1: Global Inulin Market Revenue Million Forecast, by Region 2019 & 2032
- Table 2: Global Inulin Market Revenue Million Forecast, by Application 2019 & 2032
- Table 3: Global Inulin Market Revenue Million Forecast, by Region 2019 & 2032
- Table 4: Global Inulin Market Revenue Million Forecast, by Country 2019 & 2032
- Table 5: United States Inulin Market Revenue (Million) Forecast, by Application 2019 & 2032
- Table 6: Canada Inulin Market Revenue (Million) Forecast, by Application 2019 & 2032
- Table 7: Mexico Inulin Market Revenue (Million) Forecast, by Application 2019 & 2032
- Table 8: Rest of North America Inulin Market Revenue (Million) Forecast, by Application 2019 & 2032
- Table 9: Global Inulin Market Revenue Million Forecast, by Country 2019 & 2032
- Table 10: United Kindgom Inulin Market Revenue (Million) Forecast, by Application 2019 & 2032
- Table 11: France Inulin Market Revenue (Million) Forecast, by Application 2019 & 2032
- Table 12: Germany Inulin Market Revenue (Million) Forecast, by Application 2019 & 2032
- Table 13: Spain Inulin Market Revenue (Million) Forecast, by Application 2019 & 2032
- Table 14: Rest of Europe Inulin Market Revenue (Million) Forecast, by Application 2019 & 2032
- Table 15: Global Inulin Market Revenue Million Forecast, by Country 2019 & 2032
- Table 16: China Inulin Market Revenue (Million) Forecast, by Application 2019 & 2032
- Table 17: Japan Inulin Market Revenue (Million) Forecast, by Application 2019 & 2032
- Table 18: Australia Inulin Market Revenue (Million) Forecast, by Application 2019 & 2032
- Table 19: India Inulin Market Revenue (Million) Forecast, by Application 2019 & 2032
- Table 20: Rest of Asia Pacific Inulin Market Revenue (Million) Forecast, by Application 2019 & 2032
- Table 21: Global Inulin Market Revenue Million Forecast, by Country 2019 & 2032
- Table 22: Brazil Inulin Market Revenue (Million) Forecast, by Application 2019 & 2032
- Table 23: Argentina Inulin Market Revenue (Million) Forecast, by Application 2019 & 2032
- Table 24: Rest of South America Inulin Market Revenue (Million) Forecast, by Application 2019 & 2032
- Table 25: Global Inulin Market Revenue Million Forecast, by Country 2019 & 2032
- Table 26: South Africa Inulin Market Revenue (Million) Forecast, by Application 2019 & 2032
- Table 27: Saudi Arabia Inulin Market Revenue (Million) Forecast, by Application 2019 & 2032
- Table 28: Rest of Middle East and Africa Inulin Market Revenue (Million) Forecast, by Application 2019 & 2032
- Table 29: Global Inulin Market Revenue Million Forecast, by Application 2019 & 2032
- Table 30: Global Inulin Market Revenue Million Forecast, by Country 2019 & 2032
- Table 31: United States Inulin Market Revenue (Million) Forecast, by Application 2019 & 2032
- Table 32: Canada Inulin Market Revenue (Million) Forecast, by Application 2019 & 2032
- Table 33: Mexico Inulin Market Revenue (Million) Forecast, by Application 2019 & 2032
- Table 34: Rest of North America Inulin Market Revenue (Million) Forecast, by Application 2019 & 2032
- Table 35: Global Inulin Market Revenue Million Forecast, by Application 2019 & 2032
- Table 36: Global Inulin Market Revenue Million Forecast, by Country 2019 & 2032
- Table 37: United Kindgom Inulin Market Revenue (Million) Forecast, by Application 2019 & 2032
- Table 38: France Inulin Market Revenue (Million) Forecast, by Application 2019 & 2032
- Table 39: Germany Inulin Market Revenue (Million) Forecast, by Application 2019 & 2032
- Table 40: Spain Inulin Market Revenue (Million) Forecast, by Application 2019 & 2032
- Table 41: Rest of Europe Inulin Market Revenue (Million) Forecast, by Application 2019 & 2032
- Table 42: Global Inulin Market Revenue Million Forecast, by Application 2019 & 2032
- Table 43: Global Inulin Market Revenue Million Forecast, by Country 2019 & 2032
- Table 44: China Inulin Market Revenue (Million) Forecast, by Application 2019 & 2032
- Table 45: Japan Inulin Market Revenue (Million) Forecast, by Application 2019 & 2032
- Table 46: Australia Inulin Market Revenue (Million) Forecast, by Application 2019 & 2032
- Table 47: India Inulin Market Revenue (Million) Forecast, by Application 2019 & 2032
- Table 48: Rest of Asia Pacific Inulin Market Revenue (Million) Forecast, by Application 2019 & 2032
- Table 49: Global Inulin Market Revenue Million Forecast, by Application 2019 & 2032
- Table 50: Global Inulin Market Revenue Million Forecast, by Country 2019 & 2032
- Table 51: Brazil Inulin Market Revenue (Million) Forecast, by Application 2019 & 2032
- Table 52: Argentina Inulin Market Revenue (Million) Forecast, by Application 2019 & 2032
- Table 53: Rest of South America Inulin Market Revenue (Million) Forecast, by Application 2019 & 2032
- Table 54: Global Inulin Market Revenue Million Forecast, by Application 2019 & 2032
- Table 55: Global Inulin Market Revenue Million Forecast, by Country 2019 & 2032
- Table 56: South Africa Inulin Market Revenue (Million) Forecast, by Application 2019 & 2032
- Table 57: Saudi Arabia Inulin Market Revenue (Million) Forecast, by Application 2019 & 2032
- Table 58: Rest of Middle East and Africa Inulin Market Revenue (Million) Forecast, by Application 2019 & 2032
Frequently Asked Questions
1. What is the projected Compound Annual Growth Rate (CAGR) of the Inulin Market?
The projected CAGR is approximately 6.55%.
2. Which companies are prominent players in the Inulin Market?
Key companies in the market include The Tierra Group, Sensus NV, Nova Green Inc, Sudzucker AG (Beneo Remy NV), The Ingredient House (TIH), Ciranda Inc, Adept Impex Private Limited, Cosucra Groupe Warcoing SA, Cargill Inc, The Green Labs LLC*List Not Exhaustive.
3. What are the main segments of the Inulin Market?
The market segments include Application.
4. Can you provide details about the market size?
The market size is estimated to be USD 1.86 Million as of 2022.
5. What are some drivers contributing to market growth?
Wide Applications and Functionality; Demand For Gluten-Free Products.
6. What are the notable trends driving market growth?
Growing Consumers’ Interest in Prebiotics.
7. Are there any restraints impacting market growth?
Easy Availability of Economically Feasible Alternatives.
8. Can you provide examples of recent developments in the market?
March 2022: Sensus, a Dutch co-op member, announced its plans to expand the production of chicory root fiber (inulin) to meet the growing demand for natural prebiotics in plant-based foods and supplements.
9. What pricing options are available for accessing the report?
Pricing options include single-user, multi-user, and enterprise licenses priced at USD 4750, USD 5250, and USD 8750 respectively.
10. Is the market size provided in terms of value or volume?
The market size is provided in terms of value, measured in Million.
11. Are there any specific market keywords associated with the report?
Yes, the market keyword associated with the report is "Inulin Market," which aids in identifying and referencing the specific market segment covered.
12. How do I determine which pricing option suits my needs best?
The pricing options vary based on user requirements and access needs. Individual users may opt for single-user licenses, while businesses requiring broader access may choose multi-user or enterprise licenses for cost-effective access to the report.
13. Are there any additional resources or data provided in the Inulin Market report?
While the report offers comprehensive insights, it's advisable to review the specific contents or supplementary materials provided to ascertain if additional resources or data are available.
14. How can I stay updated on further developments or reports in the Inulin Market?
To stay informed about further developments, trends, and reports in the Inulin Market, consider subscribing to industry newsletters, following relevant companies and organizations, or regularly checking reputable industry news sources and publications.
Methodology
Step 1 - Identification of Relevant Samples Size from Population Database


Step 2 - Approaches for Defining Global Market Size (Value, Volume* & Price*)

Note*: In applicable scenarios
Step 3 - Data Sources
Primary Research
- Web Analytics
- Survey Reports
- Research Institute
- Latest Research Reports
- Opinion Leaders
Secondary Research
- Annual Reports
- White Paper
- Latest Press Release
- Industry Association
- Paid Database
- Investor Presentations

Step 4 - Data Triangulation
Involves using different sources of information in order to increase the validity of a study
These sources are likely to be stakeholders in a program - participants, other researchers, program staff, other community members, and so on.
Then we put all data in single framework & apply various statistical tools to find out the dynamic on the market.
During the analysis stage, feedback from the stakeholder groups would be compared to determine areas of agreement as well as areas of divergence
