

Key Insights
The global low-calorie sweeteners market is experiencing robust growth, driven by the increasing prevalence of diabetes, obesity, and other health concerns globally. Consumers are increasingly seeking healthier alternatives to traditional sugar, fueling demand for products like sucralose, stevia, and aspartame across various applications. The market's expansion is further propelled by the rising popularity of diet and sugar-free beverages and foods, particularly in developed regions like North America and Europe. While natural sweeteners like stevia are gaining traction due to their perceived health benefits, synthetic options like sucralose and aspartame continue to hold significant market share owing to their cost-effectiveness and widespread availability. Market segmentation reveals that the food and beverage industries are major consumers, though the pharmaceutical and other niche applications are also showing growth potential. Key players like Cargill, ADM, and others are engaging in strategic partnerships and product innovations to cater to the evolving consumer preferences and maintain a competitive edge. The market is expected to witness continuous growth over the forecast period (2025-2033), although regulatory changes and concerns regarding the long-term health effects of some artificial sweeteners may present some challenges.
Despite the overall positive growth trajectory, the market faces certain restraints. Fluctuations in raw material prices, stringent regulations surrounding the use of artificial sweeteners in different regions, and ongoing consumer debates about the health implications of specific low-calorie sweeteners could affect market growth. The competitive landscape is characterized by both large multinational corporations and smaller specialized companies. This dynamic necessitates constant innovation and strategic marketing to cater to diverse consumer needs and preferences across various geographic markets. Future growth will likely be influenced by advancements in sweetener technology, increased consumer awareness of health and wellness, and the introduction of innovative product formulations in food and beverage sectors. The market exhibits a geographical concentration, with North America and Europe dominating presently, although Asia Pacific is expected to show significant growth driven by rising disposable incomes and changing lifestyles in developing economies.
Low-Calorie Sweeteners Market: A Comprehensive Market Report (2019-2033)
This comprehensive report provides an in-depth analysis of the Low-Calorie Sweeteners Market, encompassing its parent market (Sweeteners Market) and child markets (e.g., Food Additives Market, Beverage Additives Market). The study period spans from 2019 to 2033, with 2025 serving as the base and estimated year. The report forecasts market trends from 2025 to 2033, leveraging data from the historical period (2019-2024). Valued at xx Million units in 2025, the market is poised for significant growth. This report is essential for industry professionals, investors, and stakeholders seeking to understand the market dynamics and future opportunities within this rapidly evolving sector.
Low-Calorie Sweeteners Market Dynamics & Structure
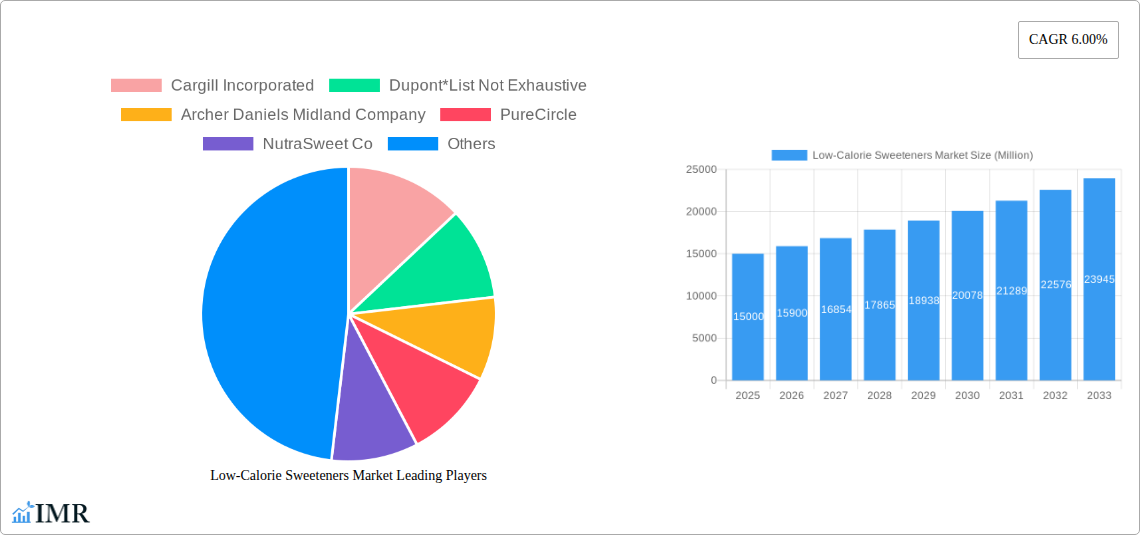
The Low-Calorie Sweeteners Market is characterized by a moderately concentrated landscape, with key players including Cargill Incorporated, DuPont, Archer Daniels Midland Company, PureCircle, NutraSweet Co, Ingredion Incorporated, JK Sucralose Inc, Roquette Freres, Ajinomoto Health & Nutrition North America Inc, and Tate & Lyle. However, the market also features several smaller players and emerging entrants, creating a dynamic competitive environment.
Technological innovation is a key driver, with ongoing research and development focusing on improving the taste, texture, and functionality of low-calorie sweeteners. Regulatory frameworks, particularly concerning labeling and health claims, significantly influence market dynamics. The market faces competition from other sweeteners, including sugar substitutes and natural alternatives. Consumer preferences are shifting towards healthier options, boosting demand for low-calorie sweeteners. M&A activity is notable, with several strategic partnerships and acquisitions shaping the competitive landscape. The historical period witnessed xx M&A deals, projecting to xx deals during the forecast period.
- Market Concentration: Moderately concentrated, with top 10 players holding xx% market share in 2025.
- Technological Innovation: Focus on improving taste, texture, and functionality; development of novel sweetener types.
- Regulatory Framework: Stringent regulations concerning labeling and health claims; varying regulations across geographies.
- Competitive Substitutes: Sugar, other natural and artificial sweeteners.
- End-User Demographics: Growing health-conscious population, increasing demand from food & beverage and pharmaceutical industries.
- M&A Trends: Strategic acquisitions and partnerships to expand product portfolios and market reach.
Low-Calorie Sweeteners Market Growth Trends & Insights
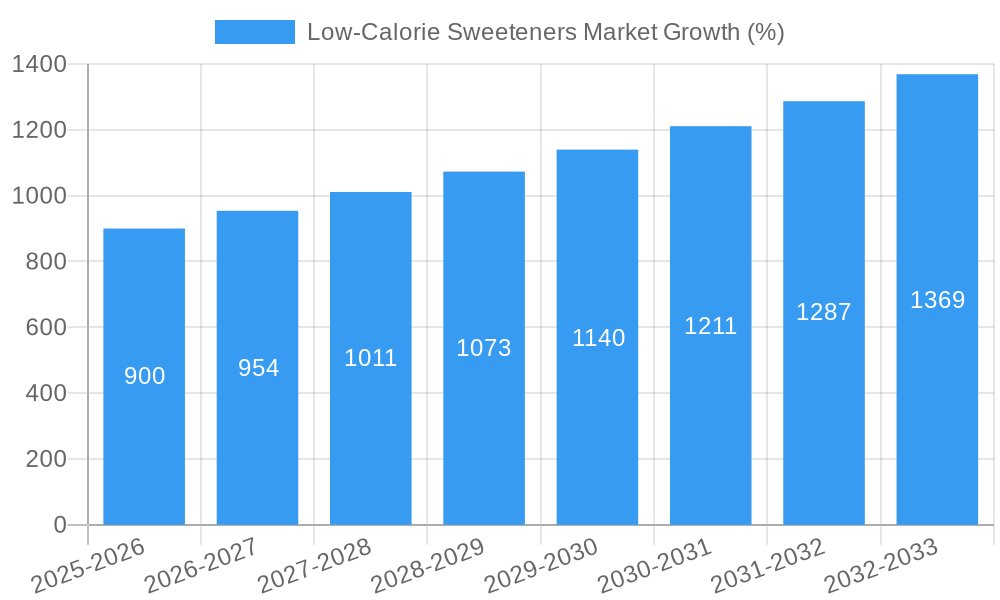
The Low-Calorie Sweeteners Market experienced a CAGR of xx% during the historical period (2019-2024), driven by increasing health consciousness among consumers, stringent regulations on sugar consumption, and the rising prevalence of lifestyle diseases. The market is projected to grow at a CAGR of xx% during the forecast period (2025-2033). This growth is primarily attributed to the expanding food and beverage industry, especially in developing economies. Technological disruptions, such as the development of new sweetener types with improved properties, are expected to accelerate market growth. Consumer behavior is shifting toward healthier food options, fueling demand for natural low-calorie sweeteners, like stevia. Market penetration is expected to increase significantly, reaching xx% by 2033.
Dominant Regions, Countries, or Segments in Low-Calorie Sweeteners Market
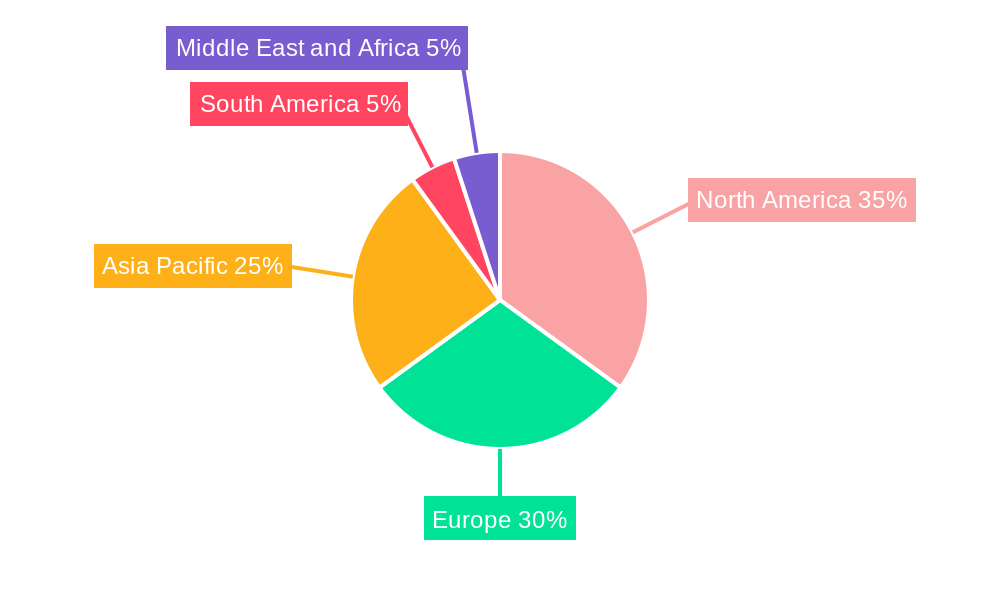
North America currently dominates the Low-Calorie Sweeteners Market, driven by high consumer demand for healthier food options and a strong presence of key players. Europe follows closely, reflecting a similar trend towards healthier eating habits and regulatory pressure for sugar reduction. The Asia-Pacific region is expected to witness the fastest growth rate during the forecast period, fueled by rising disposable incomes, increasing urbanization, and changing dietary habits.
By Source: The natural segment is experiencing higher growth due to increasing consumer preference for natural and clean-label products.
By Type: Stevia holds significant market share, driven by its natural origin and improved taste profiles. Sucralose and Aspartame maintain considerable market share due to their established presence and widespread application.
By Application: The food and beverage industry represents the largest segment, with increasing demand from processed food manufacturers, confectionery, and beverage producers. The pharmaceutical and healthcare sectors also contribute significantly.
- North America: Strong consumer demand for healthy products; established players.
- Europe: Growing adoption of healthier eating habits; regulatory push for sugar reduction.
- Asia-Pacific: Rapid growth potential due to rising disposable incomes and changing dietary habits.
- Natural Segment: High growth due to consumer preference for natural ingredients.
- Stevia Type: Dominant share due to its natural origin and improved taste.
- Food & Beverage Application: Largest segment, driven by high product demand.
Low-Calorie Sweeteners Market Product Landscape
The Low-Calorie Sweeteners Market offers a diverse range of products, including various types of artificial and natural sweeteners. Recent innovations have focused on improving the taste and functionality of these sweeteners, addressing some of the drawbacks of earlier generations. For example, liquid stevia-based sweeteners have been developed to enhance solubility and provide a cleaner taste. The focus is on providing natural alternatives with improved flavor profiles and comparable functionality to traditional sugars. Manufacturers are increasingly emphasizing clean-label ingredients and natural origins to cater to health-conscious consumers.
Key Drivers, Barriers & Challenges in Low-Calorie Sweeteners Market
Key Drivers:
- Growing health consciousness among consumers, leading to increased demand for low-calorie options.
- Stringent regulations on sugar consumption in several countries.
- Rising prevalence of obesity and related health issues.
- Technological innovations improving the taste and functionality of low-calorie sweeteners.
Key Challenges & Restraints:
- The aftertaste associated with some artificial sweeteners continues to affect consumer adoption.
- Concerns regarding the long-term health effects of certain artificial sweeteners create hesitancy.
- The relatively higher cost of some low-calorie sweeteners compared to sugar can limit their wide use.
- Supply chain disruptions, fluctuating raw material prices, and regulatory hurdles can create uncertainty.
Emerging Opportunities in Low-Calorie Sweeteners Market
- Expansion into developing markets: Untapped potential in emerging economies with rapidly growing populations and increasing disposable incomes.
- Development of novel sweetener types: Creating new sweeteners with improved taste, texture, and functionality can tap into existing and new consumer groups.
- Focus on natural and clean-label products: Meeting consumer demand for products that align with their health-conscious preferences.
- Development of tailored applications: Creating customized low-calorie sweeteners for specific food and beverage applications.
Growth Accelerators in the Low-Calorie Sweeteners Market Industry
The Low-Calorie Sweeteners Market is poised for sustained growth, driven by continuous technological advancements leading to the development of improved sweetener products. Strategic partnerships and collaborations among manufacturers, food processors, and research institutions facilitate the introduction of novel products and expand market reach. Market expansion strategies targeting developing countries with increasing health concerns create new avenues for growth.
Key Players Shaping the Low-Calorie Sweeteners Market Market
- Cargill Incorporated
- DuPont
- Archer Daniels Midland Company
- PureCircle
- NutraSweet Co
- Ingredion Incorporated
- JK Sucralose Inc
- Roquette Freres
- Ajinomoto Health & Nutrition North America Inc
- Tate & Lyle
Notable Milestones in Low-Calorie Sweeteners Market Sector
- Jul 2022: Sweegen launched Bestevia LQ, a liquid stevia-based sweetener.
- Mar 2022: Cargill launched EverSweet + ClearFlo, a blended stevia sweetener.
- Sept 2021: Ingredion Incorporated and S&W Seed Company formed a stevia supply agreement.
- Apr 2021: Manus Bio launched NutraSweet Natural™, a plant-based sweetener.
In-Depth Low-Calorie Sweeteners Market Market Outlook
The Low-Calorie Sweeteners Market presents significant future growth potential, driven by the converging trends of increasing health awareness and the ongoing development of superior-tasting and functional sweeteners. Strategic acquisitions, technological advancements, and market expansions into emerging regions will be crucial elements driving continued market expansion. The future success of players hinges on adapting to shifting consumer preferences, navigating regulatory landscapes, and innovating to meet the evolving demands of this dynamic market.
Low-Calorie Sweeteners Market Segmentation
-
1. Source
- 1.1. Natural
- 1.2. Synthetic
-
2. Type
- 2.1. Sucralose
- 2.2. Saccharin
- 2.3. Aspartame
- 2.4. Neotame
- 2.5. Advantam
- 2.6. Acesulfame Potassium
- 2.7. Stevia
- 2.8. Other Types
-
3. Application
-
3.1. Foods
- 3.1.1. Bakery
- 3.1.2. Frozen Food and Dairy
- 3.1.3. Confectionery
- 3.1.4. Other Applications
- 3.2. Beverages
- 3.3. Pharmaceuticals
- 3.4. Other Beverages
-
3.1. Foods
Low-Calorie Sweeteners Market Segmentation By Geography
-
1. North America
- 1.1. United States
- 1.2. Canada
- 1.3. Mexico
- 1.4. Rest of North America
-
2. Europe
- 2.1. United Kingdom
- 2.2. Germany
- 2.3. Spain
- 2.4. France
- 2.5. Italy
- 2.6. Russia
- 2.7. Rest of Europe
-
3. Asia Pacific
- 3.1. China
- 3.2. Japan
- 3.3. India
- 3.4. Australia
- 3.5. Rest of Asia Pacific
-
4. South America
- 4.1. Brazil
- 4.2. Argentina
- 4.3. Rest of South America
-
5. Middle East and Africa
- 5.1. Saudi Arabia
- 5.2. South Africa
- 5.3. Rest of Middle East and Africa
Low-Calorie Sweeteners Market REPORT HIGHLIGHTS
| Aspects | Details |
|---|---|
| Study Period | 2019-2033 |
| Base Year | 2024 |
| Estimated Year | 2025 |
| Forecast Period | 2025-2033 |
| Historical Period | 2019-2024 |
| Growth Rate | CAGR of 6.00% from 2019-2033 |
| Segmentation |
|
Table of Contents
- 1. Introduction
- 1.1. Research Scope
- 1.2. Market Segmentation
- 1.3. Research Methodology
- 1.4. Definitions and Assumptions
- 2. Executive Summary
- 2.1. Introduction
- 3. Market Dynamics
- 3.1. Introduction
- 3.2. Market Drivers
- 3.2.1. Shift towards Natural Sweeteners
- 3.3. Market Restrains
- 3.3.1. Health Concerns Related to Sweetener Consumption
- 3.4. Market Trends
- 3.4.1. Health-conscious Consumers Reducing Sugar Content in their Food
- 4. Market Factor Analysis
- 4.1. Porters Five Forces
- 4.2. Supply/Value Chain
- 4.3. PESTEL analysis
- 4.4. Market Entropy
- 4.5. Patent/Trademark Analysis
- 5. Global Low-Calorie Sweeteners Market Analysis, Insights and Forecast, 2019-2031
- 5.1. Market Analysis, Insights and Forecast - by Source
- 5.1.1. Natural
- 5.1.2. Synthetic
- 5.2. Market Analysis, Insights and Forecast - by Type
- 5.2.1. Sucralose
- 5.2.2. Saccharin
- 5.2.3. Aspartame
- 5.2.4. Neotame
- 5.2.5. Advantam
- 5.2.6. Acesulfame Potassium
- 5.2.7. Stevia
- 5.2.8. Other Types
- 5.3. Market Analysis, Insights and Forecast - by Application
- 5.3.1. Foods
- 5.3.1.1. Bakery
- 5.3.1.2. Frozen Food and Dairy
- 5.3.1.3. Confectionery
- 5.3.1.4. Other Applications
- 5.3.2. Beverages
- 5.3.3. Pharmaceuticals
- 5.3.4. Other Beverages
- 5.3.1. Foods
- 5.4. Market Analysis, Insights and Forecast - by Region
- 5.4.1. North America
- 5.4.2. Europe
- 5.4.3. Asia Pacific
- 5.4.4. South America
- 5.4.5. Middle East and Africa
- 5.1. Market Analysis, Insights and Forecast - by Source
- 6. North America Low-Calorie Sweeteners Market Analysis, Insights and Forecast, 2019-2031
- 6.1. Market Analysis, Insights and Forecast - by Source
- 6.1.1. Natural
- 6.1.2. Synthetic
- 6.2. Market Analysis, Insights and Forecast - by Type
- 6.2.1. Sucralose
- 6.2.2. Saccharin
- 6.2.3. Aspartame
- 6.2.4. Neotame
- 6.2.5. Advantam
- 6.2.6. Acesulfame Potassium
- 6.2.7. Stevia
- 6.2.8. Other Types
- 6.3. Market Analysis, Insights and Forecast - by Application
- 6.3.1. Foods
- 6.3.1.1. Bakery
- 6.3.1.2. Frozen Food and Dairy
- 6.3.1.3. Confectionery
- 6.3.1.4. Other Applications
- 6.3.2. Beverages
- 6.3.3. Pharmaceuticals
- 6.3.4. Other Beverages
- 6.3.1. Foods
- 6.1. Market Analysis, Insights and Forecast - by Source
- 7. Europe Low-Calorie Sweeteners Market Analysis, Insights and Forecast, 2019-2031
- 7.1. Market Analysis, Insights and Forecast - by Source
- 7.1.1. Natural
- 7.1.2. Synthetic
- 7.2. Market Analysis, Insights and Forecast - by Type
- 7.2.1. Sucralose
- 7.2.2. Saccharin
- 7.2.3. Aspartame
- 7.2.4. Neotame
- 7.2.5. Advantam
- 7.2.6. Acesulfame Potassium
- 7.2.7. Stevia
- 7.2.8. Other Types
- 7.3. Market Analysis, Insights and Forecast - by Application
- 7.3.1. Foods
- 7.3.1.1. Bakery
- 7.3.1.2. Frozen Food and Dairy
- 7.3.1.3. Confectionery
- 7.3.1.4. Other Applications
- 7.3.2. Beverages
- 7.3.3. Pharmaceuticals
- 7.3.4. Other Beverages
- 7.3.1. Foods
- 7.1. Market Analysis, Insights and Forecast - by Source
- 8. Asia Pacific Low-Calorie Sweeteners Market Analysis, Insights and Forecast, 2019-2031
- 8.1. Market Analysis, Insights and Forecast - by Source
- 8.1.1. Natural
- 8.1.2. Synthetic
- 8.2. Market Analysis, Insights and Forecast - by Type
- 8.2.1. Sucralose
- 8.2.2. Saccharin
- 8.2.3. Aspartame
- 8.2.4. Neotame
- 8.2.5. Advantam
- 8.2.6. Acesulfame Potassium
- 8.2.7. Stevia
- 8.2.8. Other Types
- 8.3. Market Analysis, Insights and Forecast - by Application
- 8.3.1. Foods
- 8.3.1.1. Bakery
- 8.3.1.2. Frozen Food and Dairy
- 8.3.1.3. Confectionery
- 8.3.1.4. Other Applications
- 8.3.2. Beverages
- 8.3.3. Pharmaceuticals
- 8.3.4. Other Beverages
- 8.3.1. Foods
- 8.1. Market Analysis, Insights and Forecast - by Source
- 9. South America Low-Calorie Sweeteners Market Analysis, Insights and Forecast, 2019-2031
- 9.1. Market Analysis, Insights and Forecast - by Source
- 9.1.1. Natural
- 9.1.2. Synthetic
- 9.2. Market Analysis, Insights and Forecast - by Type
- 9.2.1. Sucralose
- 9.2.2. Saccharin
- 9.2.3. Aspartame
- 9.2.4. Neotame
- 9.2.5. Advantam
- 9.2.6. Acesulfame Potassium
- 9.2.7. Stevia
- 9.2.8. Other Types
- 9.3. Market Analysis, Insights and Forecast - by Application
- 9.3.1. Foods
- 9.3.1.1. Bakery
- 9.3.1.2. Frozen Food and Dairy
- 9.3.1.3. Confectionery
- 9.3.1.4. Other Applications
- 9.3.2. Beverages
- 9.3.3. Pharmaceuticals
- 9.3.4. Other Beverages
- 9.3.1. Foods
- 9.1. Market Analysis, Insights and Forecast - by Source
- 10. Middle East and Africa Low-Calorie Sweeteners Market Analysis, Insights and Forecast, 2019-2031
- 10.1. Market Analysis, Insights and Forecast - by Source
- 10.1.1. Natural
- 10.1.2. Synthetic
- 10.2. Market Analysis, Insights and Forecast - by Type
- 10.2.1. Sucralose
- 10.2.2. Saccharin
- 10.2.3. Aspartame
- 10.2.4. Neotame
- 10.2.5. Advantam
- 10.2.6. Acesulfame Potassium
- 10.2.7. Stevia
- 10.2.8. Other Types
- 10.3. Market Analysis, Insights and Forecast - by Application
- 10.3.1. Foods
- 10.3.1.1. Bakery
- 10.3.1.2. Frozen Food and Dairy
- 10.3.1.3. Confectionery
- 10.3.1.4. Other Applications
- 10.3.2. Beverages
- 10.3.3. Pharmaceuticals
- 10.3.4. Other Beverages
- 10.3.1. Foods
- 10.1. Market Analysis, Insights and Forecast - by Source
- 11. North America Low-Calorie Sweeteners Market Analysis, Insights and Forecast, 2019-2031
- 11.1. Market Analysis, Insights and Forecast - By Country/Sub-region
- 11.1.1 United States
- 11.1.2 Canada
- 11.1.3 Mexico
- 11.1.4 Rest of North America
- 12. Europe Low-Calorie Sweeteners Market Analysis, Insights and Forecast, 2019-2031
- 12.1. Market Analysis, Insights and Forecast - By Country/Sub-region
- 12.1.1 United Kingdom
- 12.1.2 Germany
- 12.1.3 Spain
- 12.1.4 France
- 12.1.5 Italy
- 12.1.6 Russia
- 12.1.7 Rest of Europe
- 13. Asia Pacific Low-Calorie Sweeteners Market Analysis, Insights and Forecast, 2019-2031
- 13.1. Market Analysis, Insights and Forecast - By Country/Sub-region
- 13.1.1 China
- 13.1.2 Japan
- 13.1.3 India
- 13.1.4 Australia
- 13.1.5 Rest of Asia Pacific
- 14. South America Low-Calorie Sweeteners Market Analysis, Insights and Forecast, 2019-2031
- 14.1. Market Analysis, Insights and Forecast - By Country/Sub-region
- 14.1.1 Brazil
- 14.1.2 Argentina
- 14.1.3 Rest of South America
- 15. Middle East and Africa Low-Calorie Sweeteners Market Analysis, Insights and Forecast, 2019-2031
- 15.1. Market Analysis, Insights and Forecast - By Country/Sub-region
- 15.1.1 Saudi Arabia
- 15.1.2 South Africa
- 15.1.3 Rest of Middle East and Africa
- 16. Competitive Analysis
- 16.1. Global Market Share Analysis 2024
- 16.2. Company Profiles
- 16.2.1 Cargill Incorporated
- 16.2.1.1. Overview
- 16.2.1.2. Products
- 16.2.1.3. SWOT Analysis
- 16.2.1.4. Recent Developments
- 16.2.1.5. Financials (Based on Availability)
- 16.2.2 Dupont*List Not Exhaustive
- 16.2.2.1. Overview
- 16.2.2.2. Products
- 16.2.2.3. SWOT Analysis
- 16.2.2.4. Recent Developments
- 16.2.2.5. Financials (Based on Availability)
- 16.2.3 Archer Daniels Midland Company
- 16.2.3.1. Overview
- 16.2.3.2. Products
- 16.2.3.3. SWOT Analysis
- 16.2.3.4. Recent Developments
- 16.2.3.5. Financials (Based on Availability)
- 16.2.4 PureCircle
- 16.2.4.1. Overview
- 16.2.4.2. Products
- 16.2.4.3. SWOT Analysis
- 16.2.4.4. Recent Developments
- 16.2.4.5. Financials (Based on Availability)
- 16.2.5 NutraSweet Co
- 16.2.5.1. Overview
- 16.2.5.2. Products
- 16.2.5.3. SWOT Analysis
- 16.2.5.4. Recent Developments
- 16.2.5.5. Financials (Based on Availability)
- 16.2.6 Ingredion Incorporated
- 16.2.6.1. Overview
- 16.2.6.2. Products
- 16.2.6.3. SWOT Analysis
- 16.2.6.4. Recent Developments
- 16.2.6.5. Financials (Based on Availability)
- 16.2.7 JK Sucralose Inc
- 16.2.7.1. Overview
- 16.2.7.2. Products
- 16.2.7.3. SWOT Analysis
- 16.2.7.4. Recent Developments
- 16.2.7.5. Financials (Based on Availability)
- 16.2.8 Roquette Freres
- 16.2.8.1. Overview
- 16.2.8.2. Products
- 16.2.8.3. SWOT Analysis
- 16.2.8.4. Recent Developments
- 16.2.8.5. Financials (Based on Availability)
- 16.2.9 Ajinomoto Health & Nutrition North America Inc
- 16.2.9.1. Overview
- 16.2.9.2. Products
- 16.2.9.3. SWOT Analysis
- 16.2.9.4. Recent Developments
- 16.2.9.5. Financials (Based on Availability)
- 16.2.10 Tate & Lyle
- 16.2.10.1. Overview
- 16.2.10.2. Products
- 16.2.10.3. SWOT Analysis
- 16.2.10.4. Recent Developments
- 16.2.10.5. Financials (Based on Availability)
- 16.2.1 Cargill Incorporated
List of Figures
- Figure 1: Global Low-Calorie Sweeteners Market Revenue Breakdown (Million, %) by Region 2024 & 2032
- Figure 2: Global Low-Calorie Sweeteners Market Volume Breakdown (K Tons, %) by Region 2024 & 2032
- Figure 3: North America Low-Calorie Sweeteners Market Revenue (Million), by Country 2024 & 2032
- Figure 4: North America Low-Calorie Sweeteners Market Volume (K Tons), by Country 2024 & 2032
- Figure 5: North America Low-Calorie Sweeteners Market Revenue Share (%), by Country 2024 & 2032
- Figure 6: North America Low-Calorie Sweeteners Market Volume Share (%), by Country 2024 & 2032
- Figure 7: Europe Low-Calorie Sweeteners Market Revenue (Million), by Country 2024 & 2032
- Figure 8: Europe Low-Calorie Sweeteners Market Volume (K Tons), by Country 2024 & 2032
- Figure 9: Europe Low-Calorie Sweeteners Market Revenue Share (%), by Country 2024 & 2032
- Figure 10: Europe Low-Calorie Sweeteners Market Volume Share (%), by Country 2024 & 2032
- Figure 11: Asia Pacific Low-Calorie Sweeteners Market Revenue (Million), by Country 2024 & 2032
- Figure 12: Asia Pacific Low-Calorie Sweeteners Market Volume (K Tons), by Country 2024 & 2032
- Figure 13: Asia Pacific Low-Calorie Sweeteners Market Revenue Share (%), by Country 2024 & 2032
- Figure 14: Asia Pacific Low-Calorie Sweeteners Market Volume Share (%), by Country 2024 & 2032
- Figure 15: South America Low-Calorie Sweeteners Market Revenue (Million), by Country 2024 & 2032
- Figure 16: South America Low-Calorie Sweeteners Market Volume (K Tons), by Country 2024 & 2032
- Figure 17: South America Low-Calorie Sweeteners Market Revenue Share (%), by Country 2024 & 2032
- Figure 18: South America Low-Calorie Sweeteners Market Volume Share (%), by Country 2024 & 2032
- Figure 19: Middle East and Africa Low-Calorie Sweeteners Market Revenue (Million), by Country 2024 & 2032
- Figure 20: Middle East and Africa Low-Calorie Sweeteners Market Volume (K Tons), by Country 2024 & 2032
- Figure 21: Middle East and Africa Low-Calorie Sweeteners Market Revenue Share (%), by Country 2024 & 2032
- Figure 22: Middle East and Africa Low-Calorie Sweeteners Market Volume Share (%), by Country 2024 & 2032
- Figure 23: North America Low-Calorie Sweeteners Market Revenue (Million), by Source 2024 & 2032
- Figure 24: North America Low-Calorie Sweeteners Market Volume (K Tons), by Source 2024 & 2032
- Figure 25: North America Low-Calorie Sweeteners Market Revenue Share (%), by Source 2024 & 2032
- Figure 26: North America Low-Calorie Sweeteners Market Volume Share (%), by Source 2024 & 2032
- Figure 27: North America Low-Calorie Sweeteners Market Revenue (Million), by Type 2024 & 2032
- Figure 28: North America Low-Calorie Sweeteners Market Volume (K Tons), by Type 2024 & 2032
- Figure 29: North America Low-Calorie Sweeteners Market Revenue Share (%), by Type 2024 & 2032
- Figure 30: North America Low-Calorie Sweeteners Market Volume Share (%), by Type 2024 & 2032
- Figure 31: North America Low-Calorie Sweeteners Market Revenue (Million), by Application 2024 & 2032
- Figure 32: North America Low-Calorie Sweeteners Market Volume (K Tons), by Application 2024 & 2032
- Figure 33: North America Low-Calorie Sweeteners Market Revenue Share (%), by Application 2024 & 2032
- Figure 34: North America Low-Calorie Sweeteners Market Volume Share (%), by Application 2024 & 2032
- Figure 35: North America Low-Calorie Sweeteners Market Revenue (Million), by Country 2024 & 2032
- Figure 36: North America Low-Calorie Sweeteners Market Volume (K Tons), by Country 2024 & 2032
- Figure 37: North America Low-Calorie Sweeteners Market Revenue Share (%), by Country 2024 & 2032
- Figure 38: North America Low-Calorie Sweeteners Market Volume Share (%), by Country 2024 & 2032
- Figure 39: Europe Low-Calorie Sweeteners Market Revenue (Million), by Source 2024 & 2032
- Figure 40: Europe Low-Calorie Sweeteners Market Volume (K Tons), by Source 2024 & 2032
- Figure 41: Europe Low-Calorie Sweeteners Market Revenue Share (%), by Source 2024 & 2032
- Figure 42: Europe Low-Calorie Sweeteners Market Volume Share (%), by Source 2024 & 2032
- Figure 43: Europe Low-Calorie Sweeteners Market Revenue (Million), by Type 2024 & 2032
- Figure 44: Europe Low-Calorie Sweeteners Market Volume (K Tons), by Type 2024 & 2032
- Figure 45: Europe Low-Calorie Sweeteners Market Revenue Share (%), by Type 2024 & 2032
- Figure 46: Europe Low-Calorie Sweeteners Market Volume Share (%), by Type 2024 & 2032
- Figure 47: Europe Low-Calorie Sweeteners Market Revenue (Million), by Application 2024 & 2032
- Figure 48: Europe Low-Calorie Sweeteners Market Volume (K Tons), by Application 2024 & 2032
- Figure 49: Europe Low-Calorie Sweeteners Market Revenue Share (%), by Application 2024 & 2032
- Figure 50: Europe Low-Calorie Sweeteners Market Volume Share (%), by Application 2024 & 2032
- Figure 51: Europe Low-Calorie Sweeteners Market Revenue (Million), by Country 2024 & 2032
- Figure 52: Europe Low-Calorie Sweeteners Market Volume (K Tons), by Country 2024 & 2032
- Figure 53: Europe Low-Calorie Sweeteners Market Revenue Share (%), by Country 2024 & 2032
- Figure 54: Europe Low-Calorie Sweeteners Market Volume Share (%), by Country 2024 & 2032
- Figure 55: Asia Pacific Low-Calorie Sweeteners Market Revenue (Million), by Source 2024 & 2032
- Figure 56: Asia Pacific Low-Calorie Sweeteners Market Volume (K Tons), by Source 2024 & 2032
- Figure 57: Asia Pacific Low-Calorie Sweeteners Market Revenue Share (%), by Source 2024 & 2032
- Figure 58: Asia Pacific Low-Calorie Sweeteners Market Volume Share (%), by Source 2024 & 2032
- Figure 59: Asia Pacific Low-Calorie Sweeteners Market Revenue (Million), by Type 2024 & 2032
- Figure 60: Asia Pacific Low-Calorie Sweeteners Market Volume (K Tons), by Type 2024 & 2032
- Figure 61: Asia Pacific Low-Calorie Sweeteners Market Revenue Share (%), by Type 2024 & 2032
- Figure 62: Asia Pacific Low-Calorie Sweeteners Market Volume Share (%), by Type 2024 & 2032
- Figure 63: Asia Pacific Low-Calorie Sweeteners Market Revenue (Million), by Application 2024 & 2032
- Figure 64: Asia Pacific Low-Calorie Sweeteners Market Volume (K Tons), by Application 2024 & 2032
- Figure 65: Asia Pacific Low-Calorie Sweeteners Market Revenue Share (%), by Application 2024 & 2032
- Figure 66: Asia Pacific Low-Calorie Sweeteners Market Volume Share (%), by Application 2024 & 2032
- Figure 67: Asia Pacific Low-Calorie Sweeteners Market Revenue (Million), by Country 2024 & 2032
- Figure 68: Asia Pacific Low-Calorie Sweeteners Market Volume (K Tons), by Country 2024 & 2032
- Figure 69: Asia Pacific Low-Calorie Sweeteners Market Revenue Share (%), by Country 2024 & 2032
- Figure 70: Asia Pacific Low-Calorie Sweeteners Market Volume Share (%), by Country 2024 & 2032
- Figure 71: South America Low-Calorie Sweeteners Market Revenue (Million), by Source 2024 & 2032
- Figure 72: South America Low-Calorie Sweeteners Market Volume (K Tons), by Source 2024 & 2032
- Figure 73: South America Low-Calorie Sweeteners Market Revenue Share (%), by Source 2024 & 2032
- Figure 74: South America Low-Calorie Sweeteners Market Volume Share (%), by Source 2024 & 2032
- Figure 75: South America Low-Calorie Sweeteners Market Revenue (Million), by Type 2024 & 2032
- Figure 76: South America Low-Calorie Sweeteners Market Volume (K Tons), by Type 2024 & 2032
- Figure 77: South America Low-Calorie Sweeteners Market Revenue Share (%), by Type 2024 & 2032
- Figure 78: South America Low-Calorie Sweeteners Market Volume Share (%), by Type 2024 & 2032
- Figure 79: South America Low-Calorie Sweeteners Market Revenue (Million), by Application 2024 & 2032
- Figure 80: South America Low-Calorie Sweeteners Market Volume (K Tons), by Application 2024 & 2032
- Figure 81: South America Low-Calorie Sweeteners Market Revenue Share (%), by Application 2024 & 2032
- Figure 82: South America Low-Calorie Sweeteners Market Volume Share (%), by Application 2024 & 2032
- Figure 83: South America Low-Calorie Sweeteners Market Revenue (Million), by Country 2024 & 2032
- Figure 84: South America Low-Calorie Sweeteners Market Volume (K Tons), by Country 2024 & 2032
- Figure 85: South America Low-Calorie Sweeteners Market Revenue Share (%), by Country 2024 & 2032
- Figure 86: South America Low-Calorie Sweeteners Market Volume Share (%), by Country 2024 & 2032
- Figure 87: Middle East and Africa Low-Calorie Sweeteners Market Revenue (Million), by Source 2024 & 2032
- Figure 88: Middle East and Africa Low-Calorie Sweeteners Market Volume (K Tons), by Source 2024 & 2032
- Figure 89: Middle East and Africa Low-Calorie Sweeteners Market Revenue Share (%), by Source 2024 & 2032
- Figure 90: Middle East and Africa Low-Calorie Sweeteners Market Volume Share (%), by Source 2024 & 2032
- Figure 91: Middle East and Africa Low-Calorie Sweeteners Market Revenue (Million), by Type 2024 & 2032
- Figure 92: Middle East and Africa Low-Calorie Sweeteners Market Volume (K Tons), by Type 2024 & 2032
- Figure 93: Middle East and Africa Low-Calorie Sweeteners Market Revenue Share (%), by Type 2024 & 2032
- Figure 94: Middle East and Africa Low-Calorie Sweeteners Market Volume Share (%), by Type 2024 & 2032
- Figure 95: Middle East and Africa Low-Calorie Sweeteners Market Revenue (Million), by Application 2024 & 2032
- Figure 96: Middle East and Africa Low-Calorie Sweeteners Market Volume (K Tons), by Application 2024 & 2032
- Figure 97: Middle East and Africa Low-Calorie Sweeteners Market Revenue Share (%), by Application 2024 & 2032
- Figure 98: Middle East and Africa Low-Calorie Sweeteners Market Volume Share (%), by Application 2024 & 2032
- Figure 99: Middle East and Africa Low-Calorie Sweeteners Market Revenue (Million), by Country 2024 & 2032
- Figure 100: Middle East and Africa Low-Calorie Sweeteners Market Volume (K Tons), by Country 2024 & 2032
- Figure 101: Middle East and Africa Low-Calorie Sweeteners Market Revenue Share (%), by Country 2024 & 2032
- Figure 102: Middle East and Africa Low-Calorie Sweeteners Market Volume Share (%), by Country 2024 & 2032
List of Tables
- Table 1: Global Low-Calorie Sweeteners Market Revenue Million Forecast, by Region 2019 & 2032
- Table 2: Global Low-Calorie Sweeteners Market Volume K Tons Forecast, by Region 2019 & 2032
- Table 3: Global Low-Calorie Sweeteners Market Revenue Million Forecast, by Source 2019 & 2032
- Table 4: Global Low-Calorie Sweeteners Market Volume K Tons Forecast, by Source 2019 & 2032
- Table 5: Global Low-Calorie Sweeteners Market Revenue Million Forecast, by Type 2019 & 2032
- Table 6: Global Low-Calorie Sweeteners Market Volume K Tons Forecast, by Type 2019 & 2032
- Table 7: Global Low-Calorie Sweeteners Market Revenue Million Forecast, by Application 2019 & 2032
- Table 8: Global Low-Calorie Sweeteners Market Volume K Tons Forecast, by Application 2019 & 2032
- Table 9: Global Low-Calorie Sweeteners Market Revenue Million Forecast, by Region 2019 & 2032
- Table 10: Global Low-Calorie Sweeteners Market Volume K Tons Forecast, by Region 2019 & 2032
- Table 11: Global Low-Calorie Sweeteners Market Revenue Million Forecast, by Country 2019 & 2032
- Table 12: Global Low-Calorie Sweeteners Market Volume K Tons Forecast, by Country 2019 & 2032
- Table 13: United States Low-Calorie Sweeteners Market Revenue (Million) Forecast, by Application 2019 & 2032
- Table 14: United States Low-Calorie Sweeteners Market Volume (K Tons) Forecast, by Application 2019 & 2032
- Table 15: Canada Low-Calorie Sweeteners Market Revenue (Million) Forecast, by Application 2019 & 2032
- Table 16: Canada Low-Calorie Sweeteners Market Volume (K Tons) Forecast, by Application 2019 & 2032
- Table 17: Mexico Low-Calorie Sweeteners Market Revenue (Million) Forecast, by Application 2019 & 2032
- Table 18: Mexico Low-Calorie Sweeteners Market Volume (K Tons) Forecast, by Application 2019 & 2032
- Table 19: Rest of North America Low-Calorie Sweeteners Market Revenue (Million) Forecast, by Application 2019 & 2032
- Table 20: Rest of North America Low-Calorie Sweeteners Market Volume (K Tons) Forecast, by Application 2019 & 2032
- Table 21: Global Low-Calorie Sweeteners Market Revenue Million Forecast, by Country 2019 & 2032
- Table 22: Global Low-Calorie Sweeteners Market Volume K Tons Forecast, by Country 2019 & 2032
- Table 23: United Kingdom Low-Calorie Sweeteners Market Revenue (Million) Forecast, by Application 2019 & 2032
- Table 24: United Kingdom Low-Calorie Sweeteners Market Volume (K Tons) Forecast, by Application 2019 & 2032
- Table 25: Germany Low-Calorie Sweeteners Market Revenue (Million) Forecast, by Application 2019 & 2032
- Table 26: Germany Low-Calorie Sweeteners Market Volume (K Tons) Forecast, by Application 2019 & 2032
- Table 27: Spain Low-Calorie Sweeteners Market Revenue (Million) Forecast, by Application 2019 & 2032
- Table 28: Spain Low-Calorie Sweeteners Market Volume (K Tons) Forecast, by Application 2019 & 2032
- Table 29: France Low-Calorie Sweeteners Market Revenue (Million) Forecast, by Application 2019 & 2032
- Table 30: France Low-Calorie Sweeteners Market Volume (K Tons) Forecast, by Application 2019 & 2032
- Table 31: Italy Low-Calorie Sweeteners Market Revenue (Million) Forecast, by Application 2019 & 2032
- Table 32: Italy Low-Calorie Sweeteners Market Volume (K Tons) Forecast, by Application 2019 & 2032
- Table 33: Russia Low-Calorie Sweeteners Market Revenue (Million) Forecast, by Application 2019 & 2032
- Table 34: Russia Low-Calorie Sweeteners Market Volume (K Tons) Forecast, by Application 2019 & 2032
- Table 35: Rest of Europe Low-Calorie Sweeteners Market Revenue (Million) Forecast, by Application 2019 & 2032
- Table 36: Rest of Europe Low-Calorie Sweeteners Market Volume (K Tons) Forecast, by Application 2019 & 2032
- Table 37: Global Low-Calorie Sweeteners Market Revenue Million Forecast, by Country 2019 & 2032
- Table 38: Global Low-Calorie Sweeteners Market Volume K Tons Forecast, by Country 2019 & 2032
- Table 39: China Low-Calorie Sweeteners Market Revenue (Million) Forecast, by Application 2019 & 2032
- Table 40: China Low-Calorie Sweeteners Market Volume (K Tons) Forecast, by Application 2019 & 2032
- Table 41: Japan Low-Calorie Sweeteners Market Revenue (Million) Forecast, by Application 2019 & 2032
- Table 42: Japan Low-Calorie Sweeteners Market Volume (K Tons) Forecast, by Application 2019 & 2032
- Table 43: India Low-Calorie Sweeteners Market Revenue (Million) Forecast, by Application 2019 & 2032
- Table 44: India Low-Calorie Sweeteners Market Volume (K Tons) Forecast, by Application 2019 & 2032
- Table 45: Australia Low-Calorie Sweeteners Market Revenue (Million) Forecast, by Application 2019 & 2032
- Table 46: Australia Low-Calorie Sweeteners Market Volume (K Tons) Forecast, by Application 2019 & 2032
- Table 47: Rest of Asia Pacific Low-Calorie Sweeteners Market Revenue (Million) Forecast, by Application 2019 & 2032
- Table 48: Rest of Asia Pacific Low-Calorie Sweeteners Market Volume (K Tons) Forecast, by Application 2019 & 2032
- Table 49: Global Low-Calorie Sweeteners Market Revenue Million Forecast, by Country 2019 & 2032
- Table 50: Global Low-Calorie Sweeteners Market Volume K Tons Forecast, by Country 2019 & 2032
- Table 51: Brazil Low-Calorie Sweeteners Market Revenue (Million) Forecast, by Application 2019 & 2032
- Table 52: Brazil Low-Calorie Sweeteners Market Volume (K Tons) Forecast, by Application 2019 & 2032
- Table 53: Argentina Low-Calorie Sweeteners Market Revenue (Million) Forecast, by Application 2019 & 2032
- Table 54: Argentina Low-Calorie Sweeteners Market Volume (K Tons) Forecast, by Application 2019 & 2032
- Table 55: Rest of South America Low-Calorie Sweeteners Market Revenue (Million) Forecast, by Application 2019 & 2032
- Table 56: Rest of South America Low-Calorie Sweeteners Market Volume (K Tons) Forecast, by Application 2019 & 2032
- Table 57: Global Low-Calorie Sweeteners Market Revenue Million Forecast, by Country 2019 & 2032
- Table 58: Global Low-Calorie Sweeteners Market Volume K Tons Forecast, by Country 2019 & 2032
- Table 59: Saudi Arabia Low-Calorie Sweeteners Market Revenue (Million) Forecast, by Application 2019 & 2032
- Table 60: Saudi Arabia Low-Calorie Sweeteners Market Volume (K Tons) Forecast, by Application 2019 & 2032
- Table 61: South Africa Low-Calorie Sweeteners Market Revenue (Million) Forecast, by Application 2019 & 2032
- Table 62: South Africa Low-Calorie Sweeteners Market Volume (K Tons) Forecast, by Application 2019 & 2032
- Table 63: Rest of Middle East and Africa Low-Calorie Sweeteners Market Revenue (Million) Forecast, by Application 2019 & 2032
- Table 64: Rest of Middle East and Africa Low-Calorie Sweeteners Market Volume (K Tons) Forecast, by Application 2019 & 2032
- Table 65: Global Low-Calorie Sweeteners Market Revenue Million Forecast, by Source 2019 & 2032
- Table 66: Global Low-Calorie Sweeteners Market Volume K Tons Forecast, by Source 2019 & 2032
- Table 67: Global Low-Calorie Sweeteners Market Revenue Million Forecast, by Type 2019 & 2032
- Table 68: Global Low-Calorie Sweeteners Market Volume K Tons Forecast, by Type 2019 & 2032
- Table 69: Global Low-Calorie Sweeteners Market Revenue Million Forecast, by Application 2019 & 2032
- Table 70: Global Low-Calorie Sweeteners Market Volume K Tons Forecast, by Application 2019 & 2032
- Table 71: Global Low-Calorie Sweeteners Market Revenue Million Forecast, by Country 2019 & 2032
- Table 72: Global Low-Calorie Sweeteners Market Volume K Tons Forecast, by Country 2019 & 2032
- Table 73: United States Low-Calorie Sweeteners Market Revenue (Million) Forecast, by Application 2019 & 2032
- Table 74: United States Low-Calorie Sweeteners Market Volume (K Tons) Forecast, by Application 2019 & 2032
- Table 75: Canada Low-Calorie Sweeteners Market Revenue (Million) Forecast, by Application 2019 & 2032
- Table 76: Canada Low-Calorie Sweeteners Market Volume (K Tons) Forecast, by Application 2019 & 2032
- Table 77: Mexico Low-Calorie Sweeteners Market Revenue (Million) Forecast, by Application 2019 & 2032
- Table 78: Mexico Low-Calorie Sweeteners Market Volume (K Tons) Forecast, by Application 2019 & 2032
- Table 79: Rest of North America Low-Calorie Sweeteners Market Revenue (Million) Forecast, by Application 2019 & 2032
- Table 80: Rest of North America Low-Calorie Sweeteners Market Volume (K Tons) Forecast, by Application 2019 & 2032
- Table 81: Global Low-Calorie Sweeteners Market Revenue Million Forecast, by Source 2019 & 2032
- Table 82: Global Low-Calorie Sweeteners Market Volume K Tons Forecast, by Source 2019 & 2032
- Table 83: Global Low-Calorie Sweeteners Market Revenue Million Forecast, by Type 2019 & 2032
- Table 84: Global Low-Calorie Sweeteners Market Volume K Tons Forecast, by Type 2019 & 2032
- Table 85: Global Low-Calorie Sweeteners Market Revenue Million Forecast, by Application 2019 & 2032
- Table 86: Global Low-Calorie Sweeteners Market Volume K Tons Forecast, by Application 2019 & 2032
- Table 87: Global Low-Calorie Sweeteners Market Revenue Million Forecast, by Country 2019 & 2032
- Table 88: Global Low-Calorie Sweeteners Market Volume K Tons Forecast, by Country 2019 & 2032
- Table 89: United Kingdom Low-Calorie Sweeteners Market Revenue (Million) Forecast, by Application 2019 & 2032
- Table 90: United Kingdom Low-Calorie Sweeteners Market Volume (K Tons) Forecast, by Application 2019 & 2032
- Table 91: Germany Low-Calorie Sweeteners Market Revenue (Million) Forecast, by Application 2019 & 2032
- Table 92: Germany Low-Calorie Sweeteners Market Volume (K Tons) Forecast, by Application 2019 & 2032
- Table 93: Spain Low-Calorie Sweeteners Market Revenue (Million) Forecast, by Application 2019 & 2032
- Table 94: Spain Low-Calorie Sweeteners Market Volume (K Tons) Forecast, by Application 2019 & 2032
- Table 95: France Low-Calorie Sweeteners Market Revenue (Million) Forecast, by Application 2019 & 2032
- Table 96: France Low-Calorie Sweeteners Market Volume (K Tons) Forecast, by Application 2019 & 2032
- Table 97: Italy Low-Calorie Sweeteners Market Revenue (Million) Forecast, by Application 2019 & 2032
- Table 98: Italy Low-Calorie Sweeteners Market Volume (K Tons) Forecast, by Application 2019 & 2032
- Table 99: Russia Low-Calorie Sweeteners Market Revenue (Million) Forecast, by Application 2019 & 2032
- Table 100: Russia Low-Calorie Sweeteners Market Volume (K Tons) Forecast, by Application 2019 & 2032
- Table 101: Rest of Europe Low-Calorie Sweeteners Market Revenue (Million) Forecast, by Application 2019 & 2032
- Table 102: Rest of Europe Low-Calorie Sweeteners Market Volume (K Tons) Forecast, by Application 2019 & 2032
- Table 103: Global Low-Calorie Sweeteners Market Revenue Million Forecast, by Source 2019 & 2032
- Table 104: Global Low-Calorie Sweeteners Market Volume K Tons Forecast, by Source 2019 & 2032
- Table 105: Global Low-Calorie Sweeteners Market Revenue Million Forecast, by Type 2019 & 2032
- Table 106: Global Low-Calorie Sweeteners Market Volume K Tons Forecast, by Type 2019 & 2032
- Table 107: Global Low-Calorie Sweeteners Market Revenue Million Forecast, by Application 2019 & 2032
- Table 108: Global Low-Calorie Sweeteners Market Volume K Tons Forecast, by Application 2019 & 2032
- Table 109: Global Low-Calorie Sweeteners Market Revenue Million Forecast, by Country 2019 & 2032
- Table 110: Global Low-Calorie Sweeteners Market Volume K Tons Forecast, by Country 2019 & 2032
- Table 111: China Low-Calorie Sweeteners Market Revenue (Million) Forecast, by Application 2019 & 2032
- Table 112: China Low-Calorie Sweeteners Market Volume (K Tons) Forecast, by Application 2019 & 2032
- Table 113: Japan Low-Calorie Sweeteners Market Revenue (Million) Forecast, by Application 2019 & 2032
- Table 114: Japan Low-Calorie Sweeteners Market Volume (K Tons) Forecast, by Application 2019 & 2032
- Table 115: India Low-Calorie Sweeteners Market Revenue (Million) Forecast, by Application 2019 & 2032
- Table 116: India Low-Calorie Sweeteners Market Volume (K Tons) Forecast, by Application 2019 & 2032
- Table 117: Australia Low-Calorie Sweeteners Market Revenue (Million) Forecast, by Application 2019 & 2032
- Table 118: Australia Low-Calorie Sweeteners Market Volume (K Tons) Forecast, by Application 2019 & 2032
- Table 119: Rest of Asia Pacific Low-Calorie Sweeteners Market Revenue (Million) Forecast, by Application 2019 & 2032
- Table 120: Rest of Asia Pacific Low-Calorie Sweeteners Market Volume (K Tons) Forecast, by Application 2019 & 2032
- Table 121: Global Low-Calorie Sweeteners Market Revenue Million Forecast, by Source 2019 & 2032
- Table 122: Global Low-Calorie Sweeteners Market Volume K Tons Forecast, by Source 2019 & 2032
- Table 123: Global Low-Calorie Sweeteners Market Revenue Million Forecast, by Type 2019 & 2032
- Table 124: Global Low-Calorie Sweeteners Market Volume K Tons Forecast, by Type 2019 & 2032
- Table 125: Global Low-Calorie Sweeteners Market Revenue Million Forecast, by Application 2019 & 2032
- Table 126: Global Low-Calorie Sweeteners Market Volume K Tons Forecast, by Application 2019 & 2032
- Table 127: Global Low-Calorie Sweeteners Market Revenue Million Forecast, by Country 2019 & 2032
- Table 128: Global Low-Calorie Sweeteners Market Volume K Tons Forecast, by Country 2019 & 2032
- Table 129: Brazil Low-Calorie Sweeteners Market Revenue (Million) Forecast, by Application 2019 & 2032
- Table 130: Brazil Low-Calorie Sweeteners Market Volume (K Tons) Forecast, by Application 2019 & 2032
- Table 131: Argentina Low-Calorie Sweeteners Market Revenue (Million) Forecast, by Application 2019 & 2032
- Table 132: Argentina Low-Calorie Sweeteners Market Volume (K Tons) Forecast, by Application 2019 & 2032
- Table 133: Rest of South America Low-Calorie Sweeteners Market Revenue (Million) Forecast, by Application 2019 & 2032
- Table 134: Rest of South America Low-Calorie Sweeteners Market Volume (K Tons) Forecast, by Application 2019 & 2032
- Table 135: Global Low-Calorie Sweeteners Market Revenue Million Forecast, by Source 2019 & 2032
- Table 136: Global Low-Calorie Sweeteners Market Volume K Tons Forecast, by Source 2019 & 2032
- Table 137: Global Low-Calorie Sweeteners Market Revenue Million Forecast, by Type 2019 & 2032
- Table 138: Global Low-Calorie Sweeteners Market Volume K Tons Forecast, by Type 2019 & 2032
- Table 139: Global Low-Calorie Sweeteners Market Revenue Million Forecast, by Application 2019 & 2032
- Table 140: Global Low-Calorie Sweeteners Market Volume K Tons Forecast, by Application 2019 & 2032
- Table 141: Global Low-Calorie Sweeteners Market Revenue Million Forecast, by Country 2019 & 2032
- Table 142: Global Low-Calorie Sweeteners Market Volume K Tons Forecast, by Country 2019 & 2032
- Table 143: Saudi Arabia Low-Calorie Sweeteners Market Revenue (Million) Forecast, by Application 2019 & 2032
- Table 144: Saudi Arabia Low-Calorie Sweeteners Market Volume (K Tons) Forecast, by Application 2019 & 2032
- Table 145: South Africa Low-Calorie Sweeteners Market Revenue (Million) Forecast, by Application 2019 & 2032
- Table 146: South Africa Low-Calorie Sweeteners Market Volume (K Tons) Forecast, by Application 2019 & 2032
- Table 147: Rest of Middle East and Africa Low-Calorie Sweeteners Market Revenue (Million) Forecast, by Application 2019 & 2032
- Table 148: Rest of Middle East and Africa Low-Calorie Sweeteners Market Volume (K Tons) Forecast, by Application 2019 & 2032
Frequently Asked Questions
1. What is the projected Compound Annual Growth Rate (CAGR) of the Low-Calorie Sweeteners Market?
The projected CAGR is approximately 6.00%.
2. Which companies are prominent players in the Low-Calorie Sweeteners Market?
Key companies in the market include Cargill Incorporated, Dupont*List Not Exhaustive, Archer Daniels Midland Company, PureCircle, NutraSweet Co, Ingredion Incorporated, JK Sucralose Inc, Roquette Freres, Ajinomoto Health & Nutrition North America Inc, Tate & Lyle.
3. What are the main segments of the Low-Calorie Sweeteners Market?
The market segments include Source, Type, Application.
4. Can you provide details about the market size?
The market size is estimated to be USD XX Million as of 2022.
5. What are some drivers contributing to market growth?
Shift towards Natural Sweeteners.
6. What are the notable trends driving market growth?
Health-conscious Consumers Reducing Sugar Content in their Food.
7. Are there any restraints impacting market growth?
Health Concerns Related to Sweetener Consumption.
8. Can you provide examples of recent developments in the market?
Jul 2022: Sweegen launched Bestevia LQ, a collection of liquid stevia-based sweeteners, at IFT FIRST, the Institute of Food Technologists' convention and exposition that took place during July 10-13 in Chicago. The sweeteners are intended to lower the amount of sugar in products, including concentrated fruit/flavored syrup, confectionary, liquid sweeteners, dessert toppings, and carbonated soft beverages.
9. What pricing options are available for accessing the report?
Pricing options include single-user, multi-user, and enterprise licenses priced at USD 4750, USD 5250, and USD 8750 respectively.
10. Is the market size provided in terms of value or volume?
The market size is provided in terms of value, measured in Million and volume, measured in K Tons.
11. Are there any specific market keywords associated with the report?
Yes, the market keyword associated with the report is "Low-Calorie Sweeteners Market," which aids in identifying and referencing the specific market segment covered.
12. How do I determine which pricing option suits my needs best?
The pricing options vary based on user requirements and access needs. Individual users may opt for single-user licenses, while businesses requiring broader access may choose multi-user or enterprise licenses for cost-effective access to the report.
13. Are there any additional resources or data provided in the Low-Calorie Sweeteners Market report?
While the report offers comprehensive insights, it's advisable to review the specific contents or supplementary materials provided to ascertain if additional resources or data are available.
14. How can I stay updated on further developments or reports in the Low-Calorie Sweeteners Market?
To stay informed about further developments, trends, and reports in the Low-Calorie Sweeteners Market, consider subscribing to industry newsletters, following relevant companies and organizations, or regularly checking reputable industry news sources and publications.
Methodology
Step 1 - Identification of Relevant Samples Size from Population Database


Step 2 - Approaches for Defining Global Market Size (Value, Volume* & Price*)

Note*: In applicable scenarios
Step 3 - Data Sources
Primary Research
- Web Analytics
- Survey Reports
- Research Institute
- Latest Research Reports
- Opinion Leaders
Secondary Research
- Annual Reports
- White Paper
- Latest Press Release
- Industry Association
- Paid Database
- Investor Presentations

Step 4 - Data Triangulation
Involves using different sources of information in order to increase the validity of a study
These sources are likely to be stakeholders in a program - participants, other researchers, program staff, other community members, and so on.
Then we put all data in single framework & apply various statistical tools to find out the dynamic on the market.
During the analysis stage, feedback from the stakeholder groups would be compared to determine areas of agreement as well as areas of divergence
