

Key Insights
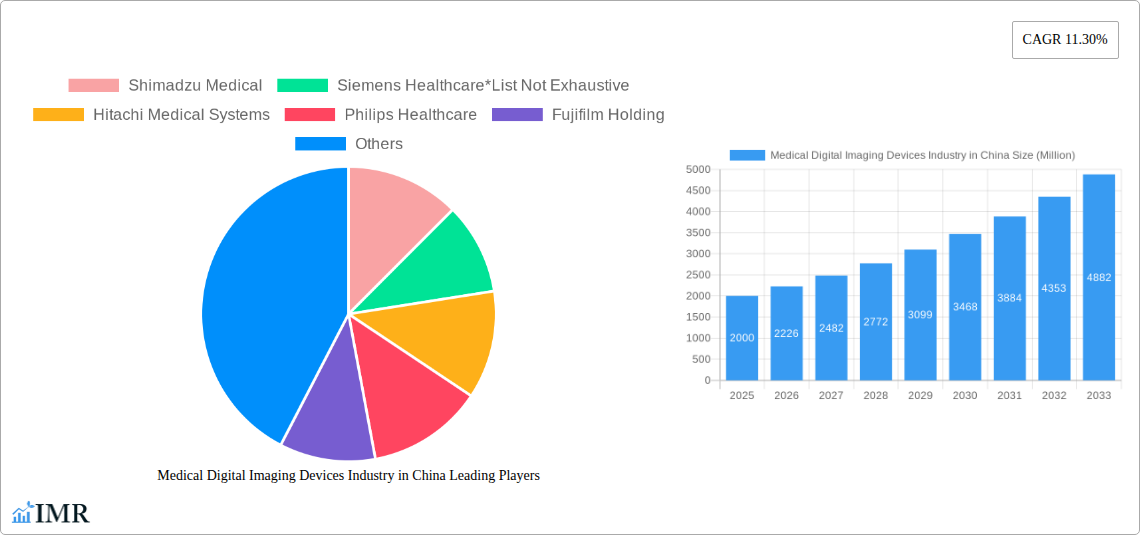
The Chinese medical digital imaging devices market, valued at approximately $XX million in 2025, is projected to experience robust growth, exhibiting a Compound Annual Growth Rate (CAGR) of 11.30% from 2025 to 2033. This expansion is fueled by several key drivers. Firstly, the rising prevalence of chronic diseases like cancer and cardiovascular conditions necessitates increased diagnostic capabilities, driving demand for advanced imaging technologies. Secondly, the government's continuous investment in healthcare infrastructure, including the modernization of hospitals and diagnostic centers, significantly contributes to market growth. Technological advancements, such as the introduction of high-end MRI and CT scanners with improved resolution and speed, further stimulate adoption. The market segmentation reveals strong growth across various applications, including cardiology, oncology, and neurology, with hospitals and diagnostic centers accounting for the largest end-user share. While factors like high initial investment costs and stringent regulatory approvals might pose challenges, the long-term outlook remains positive, driven by the country's expanding healthcare sector and growing awareness of preventative healthcare.
However, the market's growth trajectory isn't uniform across all segments. The high-end segment (e.g., very high and ultra-high field MRI systems, high-end CT scanners) is expected to outpace the growth of lower-end devices due to its superior diagnostic capabilities and increasing affordability. Competition among major players like Siemens Healthcare, GE Healthcare, and Philips Healthcare, coupled with the emergence of domestic manufacturers, will intensify. This competitive landscape will likely lead to price adjustments and innovation, benefiting end-users. Future growth will hinge on continuous technological advancements, favorable government policies promoting healthcare infrastructure development, and a sustained increase in healthcare expenditure within China. Furthermore, effective strategies targeting the growing private healthcare sector and increasing awareness among the population about the importance of early diagnosis will further propel market expansion.
Medical Digital Imaging Devices Industry in China: A Comprehensive Market Report (2019-2033)
This comprehensive report provides an in-depth analysis of the Medical Digital Imaging Devices industry in China, encompassing market dynamics, growth trends, regional segmentation, product landscape, key players, and future outlook. The report covers the period from 2019 to 2033, with a focus on the estimated year 2025 and a forecast period of 2025-2033. This analysis is crucial for businesses, investors, and policymakers seeking to understand and navigate this rapidly evolving market. High-growth segments like Very High and Ultra High Field MRI Systems and High End CT Scanners are specifically examined.
Medical Digital Imaging Devices Industry in China Market Dynamics & Structure
The Chinese medical digital imaging devices market is characterized by a dynamic interplay of factors influencing its structure and growth. Market concentration is moderate, with several multinational corporations and domestic players competing. Technological innovation, particularly in areas like AI-powered image analysis and minimally invasive procedures, is a key driver. Stringent regulatory frameworks, including those related to medical device approvals and data privacy, significantly impact market access and operations. The presence of competitive substitute technologies necessitates continuous innovation to maintain a competitive edge. The end-user demographics are shifting towards an aging population with increasing prevalence of chronic diseases, fueling demand. M&A activities are relatively frequent, reflecting strategic consolidation and expansion efforts within the sector.
- Market Concentration: Moderate, with top 5 players holding approximately xx% market share in 2025.
- Technological Innovation: Significant investments in AI, advanced imaging techniques, and miniaturization are observed.
- Regulatory Framework: Stringent regulations regarding device approval and data security influence market access.
- Competitive Substitutes: Alternative diagnostic methods pose a competitive challenge; hence continuous innovation is critical.
- End-User Demographics: Aging population and rising prevalence of chronic diseases drive market demand.
- M&A Trends: A moderate number of M&A deals are observed annually (xx deals in 2024), driven by expansion and consolidation strategies.
Medical Digital Imaging Devices Industry in China Growth Trends & Insights
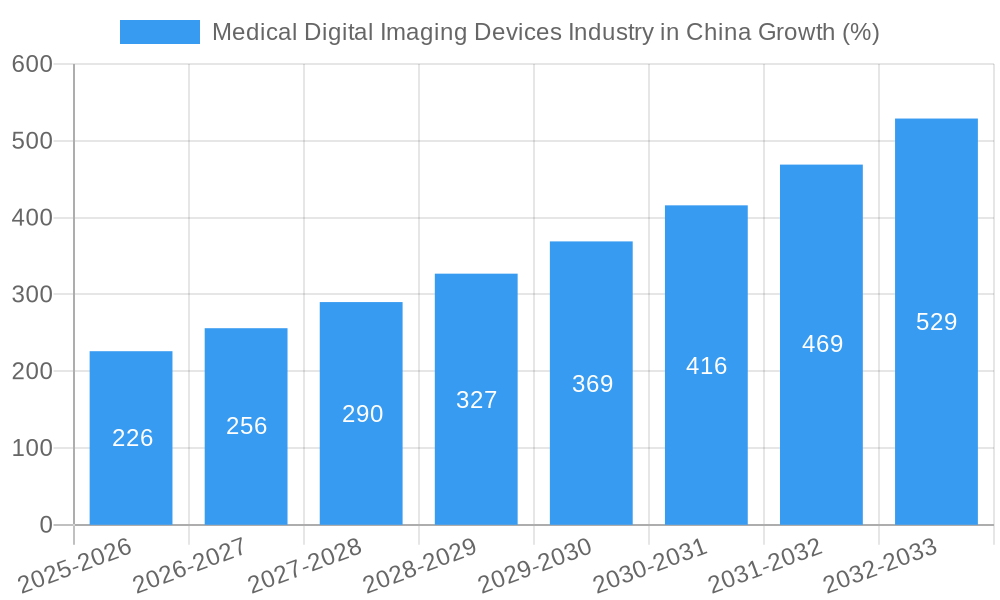
The Chinese medical digital imaging devices market has experienced substantial growth over the historical period (2019-2024), driven by factors such as increasing healthcare expenditure, rising prevalence of chronic diseases, and government initiatives to improve healthcare infrastructure. The market size expanded from xx million units in 2019 to xx million units in 2024, registering a CAGR of xx%. This growth is projected to continue during the forecast period (2025-2033), with the market size expected to reach xx million units by 2033, exhibiting a CAGR of xx%. Technological advancements, such as the introduction of AI-powered diagnostic tools and improved image quality, are accelerating adoption rates. Consumer behavior is shifting towards a preference for advanced, minimally invasive procedures, further bolstering market growth.
Dominant Regions, Countries, or Segments in Medical Digital Imaging Devices Industry in China
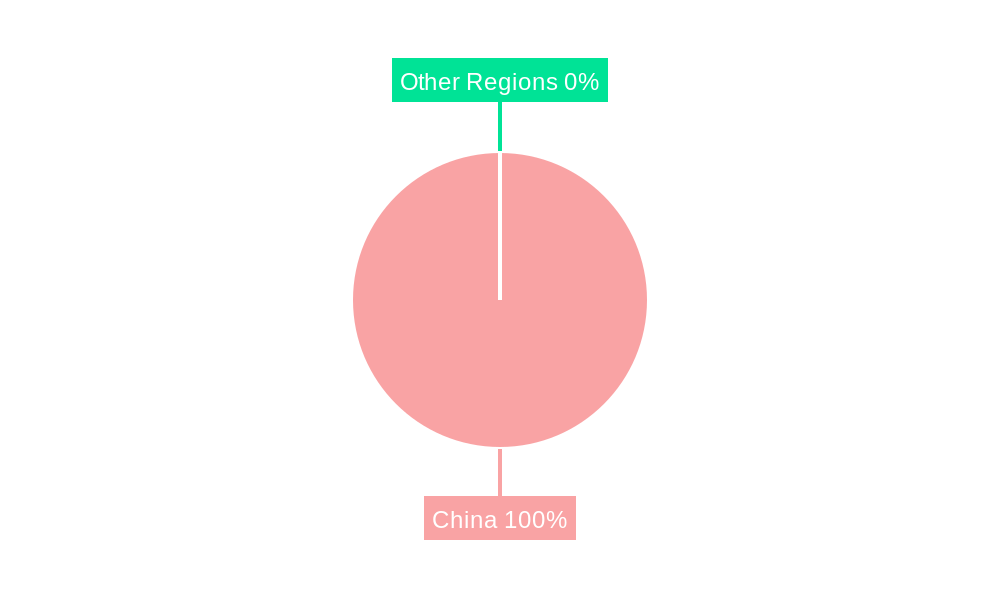
The coastal regions of China, particularly those with well-established healthcare infrastructure and higher per capita income, dominate the medical digital imaging devices market. Tier 1 cities such as Beijing, Shanghai, and Guangzhou exhibit the highest market penetration and growth rates. Within the segments, Very High and Ultra High Field MRI Systems (3T and more) and High End CT Scanners (128-slice and more) show the highest growth potential, driven by demand for superior image quality and diagnostic capabilities. The Cardiology and Oncology applications are also prominent drivers, reflecting the high prevalence of cardiovascular and cancer-related diseases in China.
- Leading Regions: Coastal provinces (e.g., Guangdong, Jiangsu, Zhejiang) and Tier 1 cities (Beijing, Shanghai, Guangzhou).
- Key Segments: Very High and Ultra High Field MRI Systems, High End CT Scanners, Cardiology and Oncology applications.
- Growth Drivers: Government healthcare initiatives, economic development, rising healthcare expenditure, and technological advancements.
- Market Share: xx% of the market is concentrated in the top 3 regions in 2025.
Medical Digital Imaging Devices Industry in China Product Landscape
The Chinese market offers a diverse range of medical digital imaging devices, encompassing MRI, CT, Ultrasound, X-ray, and Nuclear Imaging systems. Recent product innovations focus on enhanced image quality, improved diagnostic capabilities, AI-powered image analysis, and miniaturization for improved patient comfort and accessibility. Manufacturers are increasingly emphasizing user-friendly interfaces and streamlined workflows to enhance operational efficiency. The unique selling propositions often revolve around advanced technological features, superior image clarity, and efficient data management systems.
Key Drivers, Barriers & Challenges in Medical Digital Imaging Devices Industry in China
Key Drivers:
- Increasing healthcare expenditure and government initiatives to improve healthcare infrastructure are key drivers.
- The rising prevalence of chronic diseases is fueling demand for advanced diagnostic imaging technologies.
- Technological advancements, such as AI-powered image analysis, are improving diagnostic accuracy and efficiency.
Key Challenges:
- Stringent regulatory approvals and high import duties create barriers to market entry for foreign players.
- The high cost of advanced imaging systems can limit accessibility, particularly in rural areas.
- Intense competition among both domestic and international players necessitates continuous innovation. This competition impacts pricing and profit margins.
Emerging Opportunities in Medical Digital Imaging Devices Industry in China
- The increasing adoption of telemedicine and remote diagnostics presents opportunities for integrating digital imaging technologies into remote healthcare settings.
- Expansion into underserved rural areas with increased accessibility of advanced imaging technologies holds significant potential.
- The development of AI-powered diagnostic tools and personalized medicine solutions offers new avenues for growth.
Growth Accelerators in the Medical Digital Imaging Devices Industry in China Industry
Technological breakthroughs, particularly in AI-powered image analysis and minimally invasive procedures, are accelerating market growth. Strategic partnerships between domestic and international players are fostering technology transfer and market expansion. Government initiatives to improve healthcare infrastructure and expand access to healthcare services are further bolstering market growth. Continuous innovation focusing on enhancing image quality, diagnostic capabilities, and patient comfort are key to long-term success.
Key Players Shaping the Medical Digital Imaging Devices Industry in China Market
- Shimadzu Medical
- Siemens Healthcare
- Hitachi Medical Systems
- Philips Healthcare
- Fujifilm Holding
- Canon Medical Systems Corporation
- Carestream Health Inc
- GE Healthcare (GE Company)
- Hologic Corporation
Notable Milestones in Medical Digital Imaging Devices Industry in China Sector
- 2021: Introduction of new AI-powered image analysis software by several leading companies.
- 2022: Significant government investment in upgrading healthcare infrastructure in rural areas.
- 2023: Several strategic partnerships formed between domestic and international players to develop and market advanced imaging devices.
- 2024: Approval of several new medical imaging devices by the Chinese regulatory authorities.
In-Depth Medical Digital Imaging Devices Industry in China Market Outlook
The Chinese medical digital imaging devices market is poised for continued strong growth driven by technological advancements, increasing healthcare expenditure, and favorable government policies. Strategic investments in AI-powered diagnostics, expansion into underserved markets, and collaborations to develop innovative solutions will shape the future of the industry. Companies with a strong focus on technological innovation, regulatory compliance, and market expansion strategies will be well-positioned to capitalize on the significant opportunities presented by this dynamic market.
Medical Digital Imaging Devices Industry in China Segmentation
-
1. Modality
-
1.1. MRI
- 1.1.1. Low and mid field MRI systems (less than 1.5 T)
- 1.1.2. High field MRI systems (1.5-3 T)
- 1.1.3. Very Hig
-
1.2. Computed Tomography
- 1.2.1. Low End Scanners (~16-Slice)
- 1.2.2. Mid Range Scanners (~64-Slice)
- 1.2.3. High End Scanners (128-Slice and More)
-
1.3. Ultrasound
- 1.3.1. 2D Ultrasound
- 1.3.2. 3D Ultrasound
- 1.3.3. Others
-
1.4. X-Ray
- 1.4.1. Analog Systems
- 1.4.2. Digital Systems
-
1.5. Nuclear Imaging
- 1.5.1. Positron Emission Tomography (PET)
- 1.5.2. Single Photon Emission Computed Tomography (SPECT)
- 1.6. Fluoroscopy
- 1.7. Mammography
-
1.1. MRI
-
2. Application
- 2.1. Cardiology
- 2.2. Oncology
- 2.3. Neurology
- 2.4. Orthopedics
- 2.5. Gastroenterology
- 2.6. Gynecology
- 2.7. Other Applications
-
3. End-User
- 3.1. Hospitals
- 3.2. Diagnostic Centers
- 3.3. Other End-Users
Medical Digital Imaging Devices Industry in China Segmentation By Geography
-
1. North America
- 1.1. United States
- 1.2. Canada
- 1.3. Mexico
-
2. South America
- 2.1. Brazil
- 2.2. Argentina
- 2.3. Rest of South America
-
3. Europe
- 3.1. United Kingdom
- 3.2. Germany
- 3.3. France
- 3.4. Italy
- 3.5. Spain
- 3.6. Russia
- 3.7. Benelux
- 3.8. Nordics
- 3.9. Rest of Europe
-
4. Middle East & Africa
- 4.1. Turkey
- 4.2. Israel
- 4.3. GCC
- 4.4. North Africa
- 4.5. South Africa
- 4.6. Rest of Middle East & Africa
-
5. Asia Pacific
- 5.1. China
- 5.2. India
- 5.3. Japan
- 5.4. South Korea
- 5.5. ASEAN
- 5.6. Oceania
- 5.7. Rest of Asia Pacific
Medical Digital Imaging Devices Industry in China REPORT HIGHLIGHTS
| Aspects | Details |
|---|---|
| Study Period | 2019-2033 |
| Base Year | 2024 |
| Estimated Year | 2025 |
| Forecast Period | 2025-2033 |
| Historical Period | 2019-2024 |
| Growth Rate | CAGR of 11.30% from 2019-2033 |
| Segmentation |
|
Table of Contents
- 1. Introduction
- 1.1. Research Scope
- 1.2. Market Segmentation
- 1.3. Research Methodology
- 1.4. Definitions and Assumptions
- 2. Executive Summary
- 2.1. Introduction
- 3. Market Dynamics
- 3.1. Introduction
- 3.2. Market Drivers
- 3.2.1. ; Rise in the Prevalence of Chronic Diseases; Growing Geriatric Population; Increased Adoption of Advanced Technologies in Medical Imaging
- 3.3. Market Restrains
- 3.3.1. ; High Costs Associated With the Devices; Side Effects of Diagnostic Imaging Procedures
- 3.4. Market Trends
- 3.4.1. Oncology Segment is Expected to Hold a Major Market Share in the China Diagnostic Imaging Market
- 4. Market Factor Analysis
- 4.1. Porters Five Forces
- 4.2. Supply/Value Chain
- 4.3. PESTEL analysis
- 4.4. Market Entropy
- 4.5. Patent/Trademark Analysis
- 5. Global Medical Digital Imaging Devices Industry in China Analysis, Insights and Forecast, 2019-2031
- 5.1. Market Analysis, Insights and Forecast - by Modality
- 5.1.1. MRI
- 5.1.1.1. Low and mid field MRI systems (less than 1.5 T)
- 5.1.1.2. High field MRI systems (1.5-3 T)
- 5.1.1.3. Very Hig
- 5.1.2. Computed Tomography
- 5.1.2.1. Low End Scanners (~16-Slice)
- 5.1.2.2. Mid Range Scanners (~64-Slice)
- 5.1.2.3. High End Scanners (128-Slice and More)
- 5.1.3. Ultrasound
- 5.1.3.1. 2D Ultrasound
- 5.1.3.2. 3D Ultrasound
- 5.1.3.3. Others
- 5.1.4. X-Ray
- 5.1.4.1. Analog Systems
- 5.1.4.2. Digital Systems
- 5.1.5. Nuclear Imaging
- 5.1.5.1. Positron Emission Tomography (PET)
- 5.1.5.2. Single Photon Emission Computed Tomography (SPECT)
- 5.1.6. Fluoroscopy
- 5.1.7. Mammography
- 5.1.1. MRI
- 5.2. Market Analysis, Insights and Forecast - by Application
- 5.2.1. Cardiology
- 5.2.2. Oncology
- 5.2.3. Neurology
- 5.2.4. Orthopedics
- 5.2.5. Gastroenterology
- 5.2.6. Gynecology
- 5.2.7. Other Applications
- 5.3. Market Analysis, Insights and Forecast - by End-User
- 5.3.1. Hospitals
- 5.3.2. Diagnostic Centers
- 5.3.3. Other End-Users
- 5.4. Market Analysis, Insights and Forecast - by Region
- 5.4.1. North America
- 5.4.2. South America
- 5.4.3. Europe
- 5.4.4. Middle East & Africa
- 5.4.5. Asia Pacific
- 5.1. Market Analysis, Insights and Forecast - by Modality
- 6. North America Medical Digital Imaging Devices Industry in China Analysis, Insights and Forecast, 2019-2031
- 6.1. Market Analysis, Insights and Forecast - by Modality
- 6.1.1. MRI
- 6.1.1.1. Low and mid field MRI systems (less than 1.5 T)
- 6.1.1.2. High field MRI systems (1.5-3 T)
- 6.1.1.3. Very Hig
- 6.1.2. Computed Tomography
- 6.1.2.1. Low End Scanners (~16-Slice)
- 6.1.2.2. Mid Range Scanners (~64-Slice)
- 6.1.2.3. High End Scanners (128-Slice and More)
- 6.1.3. Ultrasound
- 6.1.3.1. 2D Ultrasound
- 6.1.3.2. 3D Ultrasound
- 6.1.3.3. Others
- 6.1.4. X-Ray
- 6.1.4.1. Analog Systems
- 6.1.4.2. Digital Systems
- 6.1.5. Nuclear Imaging
- 6.1.5.1. Positron Emission Tomography (PET)
- 6.1.5.2. Single Photon Emission Computed Tomography (SPECT)
- 6.1.6. Fluoroscopy
- 6.1.7. Mammography
- 6.1.1. MRI
- 6.2. Market Analysis, Insights and Forecast - by Application
- 6.2.1. Cardiology
- 6.2.2. Oncology
- 6.2.3. Neurology
- 6.2.4. Orthopedics
- 6.2.5. Gastroenterology
- 6.2.6. Gynecology
- 6.2.7. Other Applications
- 6.3. Market Analysis, Insights and Forecast - by End-User
- 6.3.1. Hospitals
- 6.3.2. Diagnostic Centers
- 6.3.3. Other End-Users
- 6.1. Market Analysis, Insights and Forecast - by Modality
- 7. South America Medical Digital Imaging Devices Industry in China Analysis, Insights and Forecast, 2019-2031
- 7.1. Market Analysis, Insights and Forecast - by Modality
- 7.1.1. MRI
- 7.1.1.1. Low and mid field MRI systems (less than 1.5 T)
- 7.1.1.2. High field MRI systems (1.5-3 T)
- 7.1.1.3. Very Hig
- 7.1.2. Computed Tomography
- 7.1.2.1. Low End Scanners (~16-Slice)
- 7.1.2.2. Mid Range Scanners (~64-Slice)
- 7.1.2.3. High End Scanners (128-Slice and More)
- 7.1.3. Ultrasound
- 7.1.3.1. 2D Ultrasound
- 7.1.3.2. 3D Ultrasound
- 7.1.3.3. Others
- 7.1.4. X-Ray
- 7.1.4.1. Analog Systems
- 7.1.4.2. Digital Systems
- 7.1.5. Nuclear Imaging
- 7.1.5.1. Positron Emission Tomography (PET)
- 7.1.5.2. Single Photon Emission Computed Tomography (SPECT)
- 7.1.6. Fluoroscopy
- 7.1.7. Mammography
- 7.1.1. MRI
- 7.2. Market Analysis, Insights and Forecast - by Application
- 7.2.1. Cardiology
- 7.2.2. Oncology
- 7.2.3. Neurology
- 7.2.4. Orthopedics
- 7.2.5. Gastroenterology
- 7.2.6. Gynecology
- 7.2.7. Other Applications
- 7.3. Market Analysis, Insights and Forecast - by End-User
- 7.3.1. Hospitals
- 7.3.2. Diagnostic Centers
- 7.3.3. Other End-Users
- 7.1. Market Analysis, Insights and Forecast - by Modality
- 8. Europe Medical Digital Imaging Devices Industry in China Analysis, Insights and Forecast, 2019-2031
- 8.1. Market Analysis, Insights and Forecast - by Modality
- 8.1.1. MRI
- 8.1.1.1. Low and mid field MRI systems (less than 1.5 T)
- 8.1.1.2. High field MRI systems (1.5-3 T)
- 8.1.1.3. Very Hig
- 8.1.2. Computed Tomography
- 8.1.2.1. Low End Scanners (~16-Slice)
- 8.1.2.2. Mid Range Scanners (~64-Slice)
- 8.1.2.3. High End Scanners (128-Slice and More)
- 8.1.3. Ultrasound
- 8.1.3.1. 2D Ultrasound
- 8.1.3.2. 3D Ultrasound
- 8.1.3.3. Others
- 8.1.4. X-Ray
- 8.1.4.1. Analog Systems
- 8.1.4.2. Digital Systems
- 8.1.5. Nuclear Imaging
- 8.1.5.1. Positron Emission Tomography (PET)
- 8.1.5.2. Single Photon Emission Computed Tomography (SPECT)
- 8.1.6. Fluoroscopy
- 8.1.7. Mammography
- 8.1.1. MRI
- 8.2. Market Analysis, Insights and Forecast - by Application
- 8.2.1. Cardiology
- 8.2.2. Oncology
- 8.2.3. Neurology
- 8.2.4. Orthopedics
- 8.2.5. Gastroenterology
- 8.2.6. Gynecology
- 8.2.7. Other Applications
- 8.3. Market Analysis, Insights and Forecast - by End-User
- 8.3.1. Hospitals
- 8.3.2. Diagnostic Centers
- 8.3.3. Other End-Users
- 8.1. Market Analysis, Insights and Forecast - by Modality
- 9. Middle East & Africa Medical Digital Imaging Devices Industry in China Analysis, Insights and Forecast, 2019-2031
- 9.1. Market Analysis, Insights and Forecast - by Modality
- 9.1.1. MRI
- 9.1.1.1. Low and mid field MRI systems (less than 1.5 T)
- 9.1.1.2. High field MRI systems (1.5-3 T)
- 9.1.1.3. Very Hig
- 9.1.2. Computed Tomography
- 9.1.2.1. Low End Scanners (~16-Slice)
- 9.1.2.2. Mid Range Scanners (~64-Slice)
- 9.1.2.3. High End Scanners (128-Slice and More)
- 9.1.3. Ultrasound
- 9.1.3.1. 2D Ultrasound
- 9.1.3.2. 3D Ultrasound
- 9.1.3.3. Others
- 9.1.4. X-Ray
- 9.1.4.1. Analog Systems
- 9.1.4.2. Digital Systems
- 9.1.5. Nuclear Imaging
- 9.1.5.1. Positron Emission Tomography (PET)
- 9.1.5.2. Single Photon Emission Computed Tomography (SPECT)
- 9.1.6. Fluoroscopy
- 9.1.7. Mammography
- 9.1.1. MRI
- 9.2. Market Analysis, Insights and Forecast - by Application
- 9.2.1. Cardiology
- 9.2.2. Oncology
- 9.2.3. Neurology
- 9.2.4. Orthopedics
- 9.2.5. Gastroenterology
- 9.2.6. Gynecology
- 9.2.7. Other Applications
- 9.3. Market Analysis, Insights and Forecast - by End-User
- 9.3.1. Hospitals
- 9.3.2. Diagnostic Centers
- 9.3.3. Other End-Users
- 9.1. Market Analysis, Insights and Forecast - by Modality
- 10. Asia Pacific Medical Digital Imaging Devices Industry in China Analysis, Insights and Forecast, 2019-2031
- 10.1. Market Analysis, Insights and Forecast - by Modality
- 10.1.1. MRI
- 10.1.1.1. Low and mid field MRI systems (less than 1.5 T)
- 10.1.1.2. High field MRI systems (1.5-3 T)
- 10.1.1.3. Very Hig
- 10.1.2. Computed Tomography
- 10.1.2.1. Low End Scanners (~16-Slice)
- 10.1.2.2. Mid Range Scanners (~64-Slice)
- 10.1.2.3. High End Scanners (128-Slice and More)
- 10.1.3. Ultrasound
- 10.1.3.1. 2D Ultrasound
- 10.1.3.2. 3D Ultrasound
- 10.1.3.3. Others
- 10.1.4. X-Ray
- 10.1.4.1. Analog Systems
- 10.1.4.2. Digital Systems
- 10.1.5. Nuclear Imaging
- 10.1.5.1. Positron Emission Tomography (PET)
- 10.1.5.2. Single Photon Emission Computed Tomography (SPECT)
- 10.1.6. Fluoroscopy
- 10.1.7. Mammography
- 10.1.1. MRI
- 10.2. Market Analysis, Insights and Forecast - by Application
- 10.2.1. Cardiology
- 10.2.2. Oncology
- 10.2.3. Neurology
- 10.2.4. Orthopedics
- 10.2.5. Gastroenterology
- 10.2.6. Gynecology
- 10.2.7. Other Applications
- 10.3. Market Analysis, Insights and Forecast - by End-User
- 10.3.1. Hospitals
- 10.3.2. Diagnostic Centers
- 10.3.3. Other End-Users
- 10.1. Market Analysis, Insights and Forecast - by Modality
- 11. Competitive Analysis
- 11.1. Global Market Share Analysis 2024
- 11.2. Company Profiles
- 11.2.1 Shimadzu Medical
- 11.2.1.1. Overview
- 11.2.1.2. Products
- 11.2.1.3. SWOT Analysis
- 11.2.1.4. Recent Developments
- 11.2.1.5. Financials (Based on Availability)
- 11.2.2 Siemens Healthcare*List Not Exhaustive
- 11.2.2.1. Overview
- 11.2.2.2. Products
- 11.2.2.3. SWOT Analysis
- 11.2.2.4. Recent Developments
- 11.2.2.5. Financials (Based on Availability)
- 11.2.3 Hitachi Medical Systems
- 11.2.3.1. Overview
- 11.2.3.2. Products
- 11.2.3.3. SWOT Analysis
- 11.2.3.4. Recent Developments
- 11.2.3.5. Financials (Based on Availability)
- 11.2.4 Philips Healthcare
- 11.2.4.1. Overview
- 11.2.4.2. Products
- 11.2.4.3. SWOT Analysis
- 11.2.4.4. Recent Developments
- 11.2.4.5. Financials (Based on Availability)
- 11.2.5 Fujifilm Holding
- 11.2.5.1. Overview
- 11.2.5.2. Products
- 11.2.5.3. SWOT Analysis
- 11.2.5.4. Recent Developments
- 11.2.5.5. Financials (Based on Availability)
- 11.2.6 Canon Medical Systems Corporation
- 11.2.6.1. Overview
- 11.2.6.2. Products
- 11.2.6.3. SWOT Analysis
- 11.2.6.4. Recent Developments
- 11.2.6.5. Financials (Based on Availability)
- 11.2.7 Carestream Health Inc
- 11.2.7.1. Overview
- 11.2.7.2. Products
- 11.2.7.3. SWOT Analysis
- 11.2.7.4. Recent Developments
- 11.2.7.5. Financials (Based on Availability)
- 11.2.8 GE Healthcare (GE Company)
- 11.2.8.1. Overview
- 11.2.8.2. Products
- 11.2.8.3. SWOT Analysis
- 11.2.8.4. Recent Developments
- 11.2.8.5. Financials (Based on Availability)
- 11.2.9 Hologic Corporation
- 11.2.9.1. Overview
- 11.2.9.2. Products
- 11.2.9.3. SWOT Analysis
- 11.2.9.4. Recent Developments
- 11.2.9.5. Financials (Based on Availability)
- 11.2.1 Shimadzu Medical
List of Figures
- Figure 1: Global Medical Digital Imaging Devices Industry in China Revenue Breakdown (Million, %) by Region 2024 & 2032
- Figure 2: China Medical Digital Imaging Devices Industry in China Revenue (Million), by Country 2024 & 2032
- Figure 3: China Medical Digital Imaging Devices Industry in China Revenue Share (%), by Country 2024 & 2032
- Figure 4: North America Medical Digital Imaging Devices Industry in China Revenue (Million), by Modality 2024 & 2032
- Figure 5: North America Medical Digital Imaging Devices Industry in China Revenue Share (%), by Modality 2024 & 2032
- Figure 6: North America Medical Digital Imaging Devices Industry in China Revenue (Million), by Application 2024 & 2032
- Figure 7: North America Medical Digital Imaging Devices Industry in China Revenue Share (%), by Application 2024 & 2032
- Figure 8: North America Medical Digital Imaging Devices Industry in China Revenue (Million), by End-User 2024 & 2032
- Figure 9: North America Medical Digital Imaging Devices Industry in China Revenue Share (%), by End-User 2024 & 2032
- Figure 10: North America Medical Digital Imaging Devices Industry in China Revenue (Million), by Country 2024 & 2032
- Figure 11: North America Medical Digital Imaging Devices Industry in China Revenue Share (%), by Country 2024 & 2032
- Figure 12: South America Medical Digital Imaging Devices Industry in China Revenue (Million), by Modality 2024 & 2032
- Figure 13: South America Medical Digital Imaging Devices Industry in China Revenue Share (%), by Modality 2024 & 2032
- Figure 14: South America Medical Digital Imaging Devices Industry in China Revenue (Million), by Application 2024 & 2032
- Figure 15: South America Medical Digital Imaging Devices Industry in China Revenue Share (%), by Application 2024 & 2032
- Figure 16: South America Medical Digital Imaging Devices Industry in China Revenue (Million), by End-User 2024 & 2032
- Figure 17: South America Medical Digital Imaging Devices Industry in China Revenue Share (%), by End-User 2024 & 2032
- Figure 18: South America Medical Digital Imaging Devices Industry in China Revenue (Million), by Country 2024 & 2032
- Figure 19: South America Medical Digital Imaging Devices Industry in China Revenue Share (%), by Country 2024 & 2032
- Figure 20: Europe Medical Digital Imaging Devices Industry in China Revenue (Million), by Modality 2024 & 2032
- Figure 21: Europe Medical Digital Imaging Devices Industry in China Revenue Share (%), by Modality 2024 & 2032
- Figure 22: Europe Medical Digital Imaging Devices Industry in China Revenue (Million), by Application 2024 & 2032
- Figure 23: Europe Medical Digital Imaging Devices Industry in China Revenue Share (%), by Application 2024 & 2032
- Figure 24: Europe Medical Digital Imaging Devices Industry in China Revenue (Million), by End-User 2024 & 2032
- Figure 25: Europe Medical Digital Imaging Devices Industry in China Revenue Share (%), by End-User 2024 & 2032
- Figure 26: Europe Medical Digital Imaging Devices Industry in China Revenue (Million), by Country 2024 & 2032
- Figure 27: Europe Medical Digital Imaging Devices Industry in China Revenue Share (%), by Country 2024 & 2032
- Figure 28: Middle East & Africa Medical Digital Imaging Devices Industry in China Revenue (Million), by Modality 2024 & 2032
- Figure 29: Middle East & Africa Medical Digital Imaging Devices Industry in China Revenue Share (%), by Modality 2024 & 2032
- Figure 30: Middle East & Africa Medical Digital Imaging Devices Industry in China Revenue (Million), by Application 2024 & 2032
- Figure 31: Middle East & Africa Medical Digital Imaging Devices Industry in China Revenue Share (%), by Application 2024 & 2032
- Figure 32: Middle East & Africa Medical Digital Imaging Devices Industry in China Revenue (Million), by End-User 2024 & 2032
- Figure 33: Middle East & Africa Medical Digital Imaging Devices Industry in China Revenue Share (%), by End-User 2024 & 2032
- Figure 34: Middle East & Africa Medical Digital Imaging Devices Industry in China Revenue (Million), by Country 2024 & 2032
- Figure 35: Middle East & Africa Medical Digital Imaging Devices Industry in China Revenue Share (%), by Country 2024 & 2032
- Figure 36: Asia Pacific Medical Digital Imaging Devices Industry in China Revenue (Million), by Modality 2024 & 2032
- Figure 37: Asia Pacific Medical Digital Imaging Devices Industry in China Revenue Share (%), by Modality 2024 & 2032
- Figure 38: Asia Pacific Medical Digital Imaging Devices Industry in China Revenue (Million), by Application 2024 & 2032
- Figure 39: Asia Pacific Medical Digital Imaging Devices Industry in China Revenue Share (%), by Application 2024 & 2032
- Figure 40: Asia Pacific Medical Digital Imaging Devices Industry in China Revenue (Million), by End-User 2024 & 2032
- Figure 41: Asia Pacific Medical Digital Imaging Devices Industry in China Revenue Share (%), by End-User 2024 & 2032
- Figure 42: Asia Pacific Medical Digital Imaging Devices Industry in China Revenue (Million), by Country 2024 & 2032
- Figure 43: Asia Pacific Medical Digital Imaging Devices Industry in China Revenue Share (%), by Country 2024 & 2032
List of Tables
- Table 1: Global Medical Digital Imaging Devices Industry in China Revenue Million Forecast, by Region 2019 & 2032
- Table 2: Global Medical Digital Imaging Devices Industry in China Revenue Million Forecast, by Modality 2019 & 2032
- Table 3: Global Medical Digital Imaging Devices Industry in China Revenue Million Forecast, by Application 2019 & 2032
- Table 4: Global Medical Digital Imaging Devices Industry in China Revenue Million Forecast, by End-User 2019 & 2032
- Table 5: Global Medical Digital Imaging Devices Industry in China Revenue Million Forecast, by Region 2019 & 2032
- Table 6: Global Medical Digital Imaging Devices Industry in China Revenue Million Forecast, by Country 2019 & 2032
- Table 7: Global Medical Digital Imaging Devices Industry in China Revenue Million Forecast, by Modality 2019 & 2032
- Table 8: Global Medical Digital Imaging Devices Industry in China Revenue Million Forecast, by Application 2019 & 2032
- Table 9: Global Medical Digital Imaging Devices Industry in China Revenue Million Forecast, by End-User 2019 & 2032
- Table 10: Global Medical Digital Imaging Devices Industry in China Revenue Million Forecast, by Country 2019 & 2032
- Table 11: United States Medical Digital Imaging Devices Industry in China Revenue (Million) Forecast, by Application 2019 & 2032
- Table 12: Canada Medical Digital Imaging Devices Industry in China Revenue (Million) Forecast, by Application 2019 & 2032
- Table 13: Mexico Medical Digital Imaging Devices Industry in China Revenue (Million) Forecast, by Application 2019 & 2032
- Table 14: Global Medical Digital Imaging Devices Industry in China Revenue Million Forecast, by Modality 2019 & 2032
- Table 15: Global Medical Digital Imaging Devices Industry in China Revenue Million Forecast, by Application 2019 & 2032
- Table 16: Global Medical Digital Imaging Devices Industry in China Revenue Million Forecast, by End-User 2019 & 2032
- Table 17: Global Medical Digital Imaging Devices Industry in China Revenue Million Forecast, by Country 2019 & 2032
- Table 18: Brazil Medical Digital Imaging Devices Industry in China Revenue (Million) Forecast, by Application 2019 & 2032
- Table 19: Argentina Medical Digital Imaging Devices Industry in China Revenue (Million) Forecast, by Application 2019 & 2032
- Table 20: Rest of South America Medical Digital Imaging Devices Industry in China Revenue (Million) Forecast, by Application 2019 & 2032
- Table 21: Global Medical Digital Imaging Devices Industry in China Revenue Million Forecast, by Modality 2019 & 2032
- Table 22: Global Medical Digital Imaging Devices Industry in China Revenue Million Forecast, by Application 2019 & 2032
- Table 23: Global Medical Digital Imaging Devices Industry in China Revenue Million Forecast, by End-User 2019 & 2032
- Table 24: Global Medical Digital Imaging Devices Industry in China Revenue Million Forecast, by Country 2019 & 2032
- Table 25: United Kingdom Medical Digital Imaging Devices Industry in China Revenue (Million) Forecast, by Application 2019 & 2032
- Table 26: Germany Medical Digital Imaging Devices Industry in China Revenue (Million) Forecast, by Application 2019 & 2032
- Table 27: France Medical Digital Imaging Devices Industry in China Revenue (Million) Forecast, by Application 2019 & 2032
- Table 28: Italy Medical Digital Imaging Devices Industry in China Revenue (Million) Forecast, by Application 2019 & 2032
- Table 29: Spain Medical Digital Imaging Devices Industry in China Revenue (Million) Forecast, by Application 2019 & 2032
- Table 30: Russia Medical Digital Imaging Devices Industry in China Revenue (Million) Forecast, by Application 2019 & 2032
- Table 31: Benelux Medical Digital Imaging Devices Industry in China Revenue (Million) Forecast, by Application 2019 & 2032
- Table 32: Nordics Medical Digital Imaging Devices Industry in China Revenue (Million) Forecast, by Application 2019 & 2032
- Table 33: Rest of Europe Medical Digital Imaging Devices Industry in China Revenue (Million) Forecast, by Application 2019 & 2032
- Table 34: Global Medical Digital Imaging Devices Industry in China Revenue Million Forecast, by Modality 2019 & 2032
- Table 35: Global Medical Digital Imaging Devices Industry in China Revenue Million Forecast, by Application 2019 & 2032
- Table 36: Global Medical Digital Imaging Devices Industry in China Revenue Million Forecast, by End-User 2019 & 2032
- Table 37: Global Medical Digital Imaging Devices Industry in China Revenue Million Forecast, by Country 2019 & 2032
- Table 38: Turkey Medical Digital Imaging Devices Industry in China Revenue (Million) Forecast, by Application 2019 & 2032
- Table 39: Israel Medical Digital Imaging Devices Industry in China Revenue (Million) Forecast, by Application 2019 & 2032
- Table 40: GCC Medical Digital Imaging Devices Industry in China Revenue (Million) Forecast, by Application 2019 & 2032
- Table 41: North Africa Medical Digital Imaging Devices Industry in China Revenue (Million) Forecast, by Application 2019 & 2032
- Table 42: South Africa Medical Digital Imaging Devices Industry in China Revenue (Million) Forecast, by Application 2019 & 2032
- Table 43: Rest of Middle East & Africa Medical Digital Imaging Devices Industry in China Revenue (Million) Forecast, by Application 2019 & 2032
- Table 44: Global Medical Digital Imaging Devices Industry in China Revenue Million Forecast, by Modality 2019 & 2032
- Table 45: Global Medical Digital Imaging Devices Industry in China Revenue Million Forecast, by Application 2019 & 2032
- Table 46: Global Medical Digital Imaging Devices Industry in China Revenue Million Forecast, by End-User 2019 & 2032
- Table 47: Global Medical Digital Imaging Devices Industry in China Revenue Million Forecast, by Country 2019 & 2032
- Table 48: China Medical Digital Imaging Devices Industry in China Revenue (Million) Forecast, by Application 2019 & 2032
- Table 49: India Medical Digital Imaging Devices Industry in China Revenue (Million) Forecast, by Application 2019 & 2032
- Table 50: Japan Medical Digital Imaging Devices Industry in China Revenue (Million) Forecast, by Application 2019 & 2032
- Table 51: South Korea Medical Digital Imaging Devices Industry in China Revenue (Million) Forecast, by Application 2019 & 2032
- Table 52: ASEAN Medical Digital Imaging Devices Industry in China Revenue (Million) Forecast, by Application 2019 & 2032
- Table 53: Oceania Medical Digital Imaging Devices Industry in China Revenue (Million) Forecast, by Application 2019 & 2032
- Table 54: Rest of Asia Pacific Medical Digital Imaging Devices Industry in China Revenue (Million) Forecast, by Application 2019 & 2032
Frequently Asked Questions
1. What is the projected Compound Annual Growth Rate (CAGR) of the Medical Digital Imaging Devices Industry in China?
The projected CAGR is approximately 11.30%.
2. Which companies are prominent players in the Medical Digital Imaging Devices Industry in China?
Key companies in the market include Shimadzu Medical, Siemens Healthcare*List Not Exhaustive, Hitachi Medical Systems, Philips Healthcare, Fujifilm Holding, Canon Medical Systems Corporation, Carestream Health Inc, GE Healthcare (GE Company), Hologic Corporation.
3. What are the main segments of the Medical Digital Imaging Devices Industry in China?
The market segments include Modality, Application, End-User.
4. Can you provide details about the market size?
The market size is estimated to be USD XX Million as of 2022.
5. What are some drivers contributing to market growth?
; Rise in the Prevalence of Chronic Diseases; Growing Geriatric Population; Increased Adoption of Advanced Technologies in Medical Imaging.
6. What are the notable trends driving market growth?
Oncology Segment is Expected to Hold a Major Market Share in the China Diagnostic Imaging Market.
7. Are there any restraints impacting market growth?
; High Costs Associated With the Devices; Side Effects of Diagnostic Imaging Procedures.
8. Can you provide examples of recent developments in the market?
N/A
9. What pricing options are available for accessing the report?
Pricing options include single-user, multi-user, and enterprise licenses priced at USD 3800, USD 4500, and USD 5800 respectively.
10. Is the market size provided in terms of value or volume?
The market size is provided in terms of value, measured in Million.
11. Are there any specific market keywords associated with the report?
Yes, the market keyword associated with the report is "Medical Digital Imaging Devices Industry in China," which aids in identifying and referencing the specific market segment covered.
12. How do I determine which pricing option suits my needs best?
The pricing options vary based on user requirements and access needs. Individual users may opt for single-user licenses, while businesses requiring broader access may choose multi-user or enterprise licenses for cost-effective access to the report.
13. Are there any additional resources or data provided in the Medical Digital Imaging Devices Industry in China report?
While the report offers comprehensive insights, it's advisable to review the specific contents or supplementary materials provided to ascertain if additional resources or data are available.
14. How can I stay updated on further developments or reports in the Medical Digital Imaging Devices Industry in China?
To stay informed about further developments, trends, and reports in the Medical Digital Imaging Devices Industry in China, consider subscribing to industry newsletters, following relevant companies and organizations, or regularly checking reputable industry news sources and publications.
Methodology
Step 1 - Identification of Relevant Samples Size from Population Database


Step 2 - Approaches for Defining Global Market Size (Value, Volume* & Price*)

Note*: In applicable scenarios
Step 3 - Data Sources
Primary Research
- Web Analytics
- Survey Reports
- Research Institute
- Latest Research Reports
- Opinion Leaders
Secondary Research
- Annual Reports
- White Paper
- Latest Press Release
- Industry Association
- Paid Database
- Investor Presentations

Step 4 - Data Triangulation
Involves using different sources of information in order to increase the validity of a study
These sources are likely to be stakeholders in a program - participants, other researchers, program staff, other community members, and so on.
Then we put all data in single framework & apply various statistical tools to find out the dynamic on the market.
During the analysis stage, feedback from the stakeholder groups would be compared to determine areas of agreement as well as areas of divergence
