

Key Insights
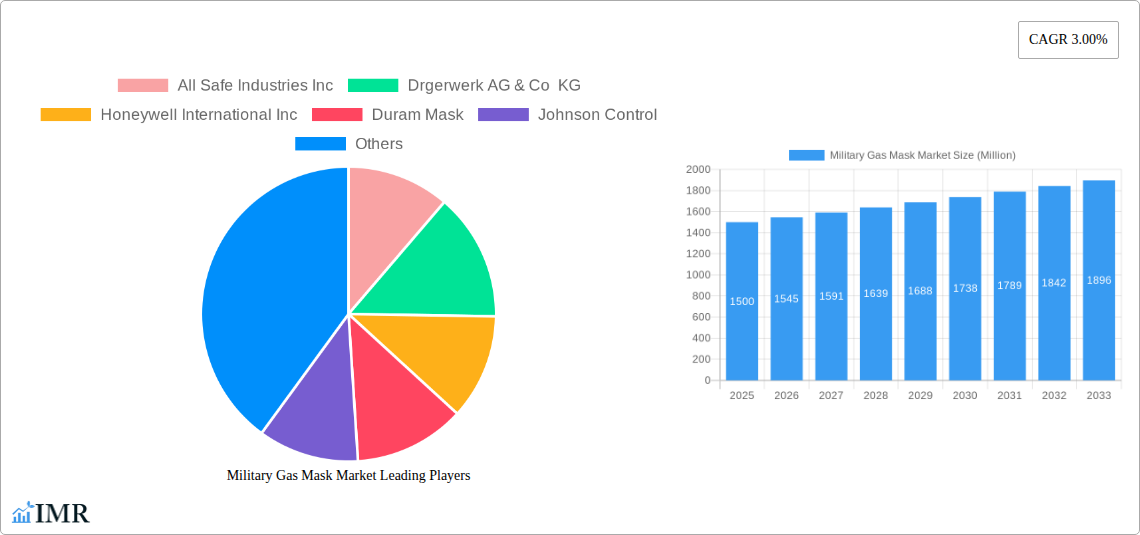
The Military Gas Mask Market, valued at approximately $1.5 billion in 2025, is projected to experience steady growth, driven by escalating geopolitical instability and the increasing demand for advanced personal protective equipment (PPE) within military and defense sectors globally. A Compound Annual Growth Rate (CAGR) of 3% from 2025 to 2033 suggests a market size exceeding $2 billion by the end of the forecast period. Key drivers include modernization of military forces, rising awareness of chemical, biological, radiological, and nuclear (CBRN) threats, and technological advancements in mask design, incorporating enhanced filtration capabilities, improved comfort, and integration with communication systems. The segment encompassing full-face gas masks is expected to dominate due to their superior protection compared to half-face alternatives. Powered respirators are also anticipated to witness robust growth fueled by their ability to provide longer-duration protection and reduced breathing resistance during strenuous activities. Geographically, North America and Europe are currently the largest markets, driven by substantial military spending and strong regulatory frameworks. However, the Asia-Pacific region is poised for significant expansion due to increasing defense budgets and modernization initiatives in several nations. Competitive pressures among established players like 3M, Honeywell, and MSA Safety Incorporated are intensifying, driving innovation and the introduction of more advanced and specialized products. Market restraints include the high cost of advanced gas masks and the need for rigorous training and maintenance to ensure optimal performance.
The market segmentation reveals crucial insights into specific growth trajectories. While non-powered respirators currently hold a larger market share, powered respirators are gaining traction due to their enhanced performance and comfort. The military end-user segment is the primary driver, with first responders representing a significant and steadily growing secondary market. The ongoing conflict in Ukraine and similar global events are likely to further stimulate demand for sophisticated gas masks. Future market success hinges on manufacturers’ ability to adapt to evolving threats, deliver innovative designs that prioritize both protection and user comfort, and cater to the specific needs of diverse military applications. Strategic partnerships and investments in research and development will be crucial for sustained growth in this specialized market.
Military Gas Mask Market: A Comprehensive Analysis (2019-2033)
This comprehensive report provides an in-depth analysis of the Military Gas Mask market, encompassing its dynamics, growth trends, regional segmentation, product landscape, and key players. The report covers the parent market of personal protective equipment (PPE) and the child market of military-grade respirators, offering a granular understanding of this critical sector. The study period spans 2019-2033, with 2025 serving as the base and estimated year. The forecast period is 2025-2033, and the historical period covers 2019-2024. The market size is presented in million units.
Military Gas Mask Market Dynamics & Structure
The Military Gas Mask market exhibits a moderately concentrated structure, with key players like 3M, Honeywell International Inc, and MSA Safety Incorporated holding significant market share (estimated at xx% collectively in 2025). Technological innovation, driven by advancements in filtration technology and material science, is a key growth driver. Stringent regulatory frameworks governing safety standards and compliance further shape market dynamics. Competitive substitutes, such as advanced air purification systems, pose a challenge, though the specialized nature of military gas masks maintains demand. The end-user demographics are primarily military personnel, with a secondary segment encompassing first responders. M&A activity in the sector has been moderate (xx deals in the past five years), primarily focused on expanding product portfolios and geographic reach.
- Market Concentration: Moderately concentrated, with top 3 players holding xx% market share (2025).
- Technological Drivers: Advancements in filtration materials, sensor integration, and ergonomic design.
- Regulatory Framework: Stringent safety and performance standards influence product development.
- Competitive Substitutes: Advanced air purification systems pose a limited competitive threat.
- End-User Demographics: Primarily military personnel, with increasing adoption by first responders.
- M&A Trends: Moderate activity focused on portfolio expansion and geographic reach (xx deals in the past 5 years).
Military Gas Mask Market Growth Trends & Insights
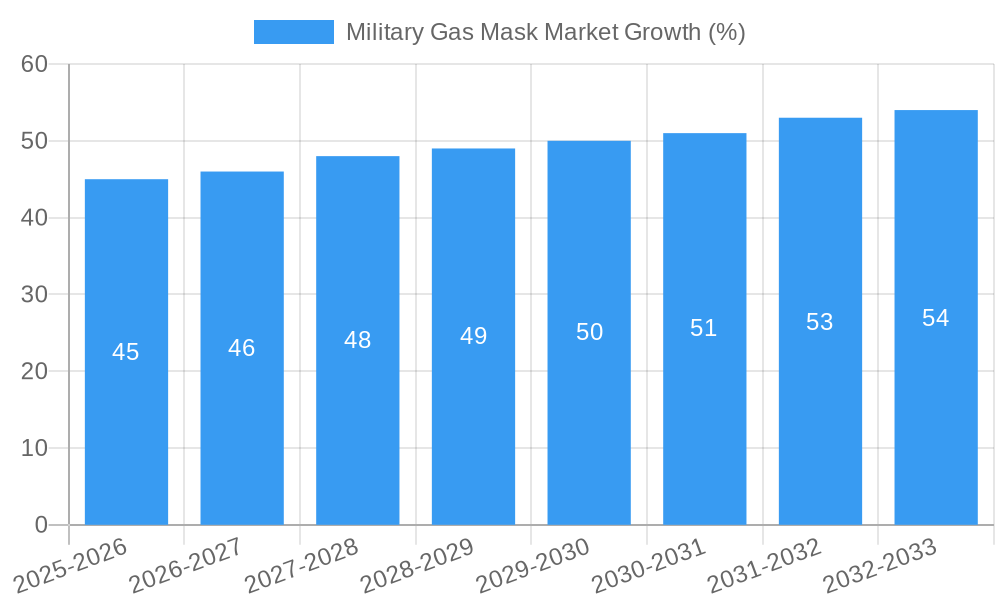
The Military Gas Mask market experienced a steady growth trajectory during the historical period (2019-2024), with a CAGR of xx%. This growth is attributed to rising geopolitical instability, increased defense spending, and a growing awareness of the need for enhanced personal protection among military personnel. Technological disruptions, such as the incorporation of advanced filter technologies and improved comfort features, have further fueled market expansion. Consumer behavior shifts towards prioritizing safety and performance have driven adoption rates. The market is projected to maintain a healthy growth trajectory during the forecast period (2025-2033), with a projected CAGR of xx%, driven by continued investment in defense modernization programs globally. Market penetration in developing economies remains relatively low, representing a significant opportunity for future growth.
Dominant Regions, Countries, or Segments in Military Gas Mask Market
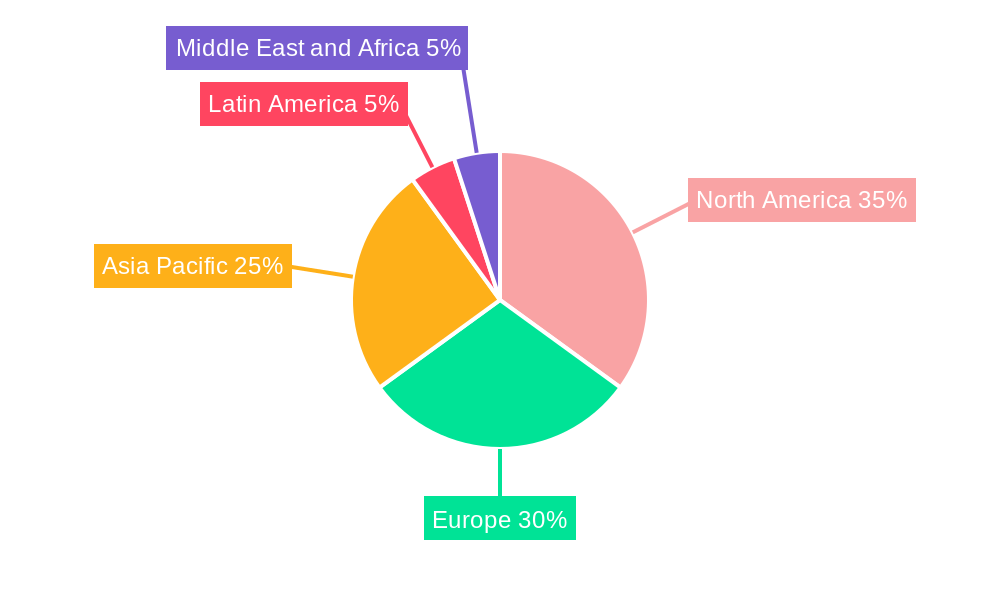
North America and Europe currently dominate the Military Gas Mask market, owing to higher defense budgets and a strong presence of established players. Within these regions, the demand for full-face gas masks is significantly higher compared to half-face masks, driven by the need for comprehensive protection in hazardous environments. The powered respirators segment exhibits greater growth potential than non-powered respirators due to enhanced performance and comfort. The military segment remains the largest end-user, although growth is also observed in the first responders segment.
- Leading Region: North America
- Key Drivers: Higher defense spending, stringent safety regulations, and strong presence of major players.
- Dominant Segment (Mask Type): Full-face gas masks
- Dominant Segment (Product Type): Powered respirators
- Largest End-User: Military
Military Gas Mask Market Product Landscape
The Military Gas Mask market features a range of products catering to diverse operational needs. Full-face masks offer superior protection, while half-face masks provide a more comfortable fit for specific applications. Non-powered respirators are cost-effective, while powered respirators provide improved air flow and longer operational durations. Innovations focus on lightweight materials, enhanced filtration capabilities, and integrated communication systems. Unique selling propositions include superior filtration efficiency, increased comfort, and extended operational lifespan. Technological advancements encompass improved filter media, advanced sensor technology, and ergonomic designs.
Key Drivers, Barriers & Challenges in Military Gas Mask Market
Key Drivers: Increased geopolitical tensions, rising defense budgets, modernization of military equipment, and advancements in filter technology are driving market growth.
Key Challenges: Stringent regulatory approvals, supply chain disruptions, and intense competition from established players pose significant challenges. Supply chain vulnerabilities due to geopolitical factors can lead to production delays and price volatility (estimated impact of xx% on market growth).
Emerging Opportunities in Military Gas Mask Market
Emerging opportunities lie in developing lightweight and more comfortable masks for extended use, integrating advanced sensor technologies for real-time threat detection, and expanding into new markets, such as specialized military units and counter-terrorism operations. The development of eco-friendly and sustainable filter materials presents a significant opportunity for differentiation and improved market appeal.
Growth Accelerators in the Military Gas Mask Market Industry
Technological breakthroughs, particularly in nano-filtration technology and lightweight material science, are major growth accelerators. Strategic partnerships between manufacturers and defense agencies will facilitate technological adoption and market penetration. Expanding into emerging economies with growing defense budgets will unlock significant market potential.
Key Players Shaping the Military Gas Mask Market Market
- All Safe Industries Inc
- Drägerwerk AG & Co KG
- Honeywell International Inc
- Duram Mask
- Johnson Control
- MSA Safety Incorporated
- 3M
- Metadure Parts & Sales Inc
- Nexter Group
- Shalon Chemical Industries Ltd
- TSI Incorporate
- Avon Protection plc
Notable Milestones in Military Gas Mask Market Sector
- 2020: Honeywell International Inc launches a new generation of military gas masks with advanced filtration capabilities.
- 2022: 3M acquires a smaller competitor, expanding its product portfolio and market share.
- 2023: New regulatory standards for military gas masks are introduced in the European Union.
In-Depth Military Gas Mask Market Market Outlook
The Military Gas Mask market is poised for continued growth, driven by persistent geopolitical instability and the increasing focus on enhancing military personnel safety. Strategic partnerships and technological advancements will play a crucial role in shaping future market dynamics. Opportunities abound in expanding into untapped markets, developing innovative product features, and meeting the evolving demands of diverse military and first responder operations. The projected market size in 2033 is estimated at xx million units.
Military Gas Mask Market Segmentation
-
1. Mask Type
- 1.1. Full-face Gas Mask
- 1.2. Half-face Gas Mask
-
2. Product Type
- 2.1. Non-powered Respirators
- 2.2. Powered Respirators
-
3. End User
- 3.1. Military
- 3.2. First Responders
Military Gas Mask Market Segmentation By Geography
-
1. North America
- 1.1. United States
- 1.2. Canada
-
2. Europe
- 2.1. Germany
- 2.2. United Kingdom
- 2.3. France
- 2.4. Russia
- 2.5. Rest of Europe
-
3. Asia Pacific
- 3.1. China
- 3.2. Japan
- 3.3. India
- 3.4. Rest of Asia Pacific
-
4. Latin America
- 4.1. Brazil
- 4.2. Mexico
- 4.3. Rest of Latin America
-
5. Middle East and Africa
- 5.1. Saudi Arabia
- 5.2. United Arab Emirates
- 5.3. Kuwait
- 5.4. Rest of Middle East and Africa
Military Gas Mask Market REPORT HIGHLIGHTS
| Aspects | Details |
|---|---|
| Study Period | 2019-2033 |
| Base Year | 2024 |
| Estimated Year | 2025 |
| Forecast Period | 2025-2033 |
| Historical Period | 2019-2024 |
| Growth Rate | CAGR of 3.00% from 2019-2033 |
| Segmentation |
|
Table of Contents
- 1. Introduction
- 1.1. Research Scope
- 1.2. Market Segmentation
- 1.3. Research Methodology
- 1.4. Definitions and Assumptions
- 2. Executive Summary
- 2.1. Introduction
- 3. Market Dynamics
- 3.1. Introduction
- 3.2. Market Drivers
- 3.3. Market Restrains
- 3.4. Market Trends
- 3.4.1. The Full-Face Gas Mask Segment Is Expected To Witness A Significant Growth During The Forecast Period.
- 4. Market Factor Analysis
- 4.1. Porters Five Forces
- 4.2. Supply/Value Chain
- 4.3. PESTEL analysis
- 4.4. Market Entropy
- 4.5. Patent/Trademark Analysis
- 5. Global Military Gas Mask Market Analysis, Insights and Forecast, 2019-2031
- 5.1. Market Analysis, Insights and Forecast - by Mask Type
- 5.1.1. Full-face Gas Mask
- 5.1.2. Half-face Gas Mask
- 5.2. Market Analysis, Insights and Forecast - by Product Type
- 5.2.1. Non-powered Respirators
- 5.2.2. Powered Respirators
- 5.3. Market Analysis, Insights and Forecast - by End User
- 5.3.1. Military
- 5.3.2. First Responders
- 5.4. Market Analysis, Insights and Forecast - by Region
- 5.4.1. North America
- 5.4.2. Europe
- 5.4.3. Asia Pacific
- 5.4.4. Latin America
- 5.4.5. Middle East and Africa
- 5.1. Market Analysis, Insights and Forecast - by Mask Type
- 6. North America Military Gas Mask Market Analysis, Insights and Forecast, 2019-2031
- 6.1. Market Analysis, Insights and Forecast - by Mask Type
- 6.1.1. Full-face Gas Mask
- 6.1.2. Half-face Gas Mask
- 6.2. Market Analysis, Insights and Forecast - by Product Type
- 6.2.1. Non-powered Respirators
- 6.2.2. Powered Respirators
- 6.3. Market Analysis, Insights and Forecast - by End User
- 6.3.1. Military
- 6.3.2. First Responders
- 6.1. Market Analysis, Insights and Forecast - by Mask Type
- 7. Europe Military Gas Mask Market Analysis, Insights and Forecast, 2019-2031
- 7.1. Market Analysis, Insights and Forecast - by Mask Type
- 7.1.1. Full-face Gas Mask
- 7.1.2. Half-face Gas Mask
- 7.2. Market Analysis, Insights and Forecast - by Product Type
- 7.2.1. Non-powered Respirators
- 7.2.2. Powered Respirators
- 7.3. Market Analysis, Insights and Forecast - by End User
- 7.3.1. Military
- 7.3.2. First Responders
- 7.1. Market Analysis, Insights and Forecast - by Mask Type
- 8. Asia Pacific Military Gas Mask Market Analysis, Insights and Forecast, 2019-2031
- 8.1. Market Analysis, Insights and Forecast - by Mask Type
- 8.1.1. Full-face Gas Mask
- 8.1.2. Half-face Gas Mask
- 8.2. Market Analysis, Insights and Forecast - by Product Type
- 8.2.1. Non-powered Respirators
- 8.2.2. Powered Respirators
- 8.3. Market Analysis, Insights and Forecast - by End User
- 8.3.1. Military
- 8.3.2. First Responders
- 8.1. Market Analysis, Insights and Forecast - by Mask Type
- 9. Latin America Military Gas Mask Market Analysis, Insights and Forecast, 2019-2031
- 9.1. Market Analysis, Insights and Forecast - by Mask Type
- 9.1.1. Full-face Gas Mask
- 9.1.2. Half-face Gas Mask
- 9.2. Market Analysis, Insights and Forecast - by Product Type
- 9.2.1. Non-powered Respirators
- 9.2.2. Powered Respirators
- 9.3. Market Analysis, Insights and Forecast - by End User
- 9.3.1. Military
- 9.3.2. First Responders
- 9.1. Market Analysis, Insights and Forecast - by Mask Type
- 10. Middle East and Africa Military Gas Mask Market Analysis, Insights and Forecast, 2019-2031
- 10.1. Market Analysis, Insights and Forecast - by Mask Type
- 10.1.1. Full-face Gas Mask
- 10.1.2. Half-face Gas Mask
- 10.2. Market Analysis, Insights and Forecast - by Product Type
- 10.2.1. Non-powered Respirators
- 10.2.2. Powered Respirators
- 10.3. Market Analysis, Insights and Forecast - by End User
- 10.3.1. Military
- 10.3.2. First Responders
- 10.1. Market Analysis, Insights and Forecast - by Mask Type
- 11. North America Military Gas Mask Market Analysis, Insights and Forecast, 2019-2031
- 11.1. Market Analysis, Insights and Forecast - By Country/Sub-region
- 11.1.1 United States
- 11.1.2 Canada
- 12. Europe Military Gas Mask Market Analysis, Insights and Forecast, 2019-2031
- 12.1. Market Analysis, Insights and Forecast - By Country/Sub-region
- 12.1.1 Germany
- 12.1.2 United Kingdom
- 12.1.3 France
- 12.1.4 Russia
- 12.1.5 Rest of Europe
- 13. Asia Pacific Military Gas Mask Market Analysis, Insights and Forecast, 2019-2031
- 13.1. Market Analysis, Insights and Forecast - By Country/Sub-region
- 13.1.1 China
- 13.1.2 Japan
- 13.1.3 India
- 13.1.4 Rest of Asia Pacific
- 14. Latin America Military Gas Mask Market Analysis, Insights and Forecast, 2019-2031
- 14.1. Market Analysis, Insights and Forecast - By Country/Sub-region
- 14.1.1 Brazil
- 14.1.2 Mexico
- 14.1.3 Rest of Latin America
- 15. Middle East and Africa Military Gas Mask Market Analysis, Insights and Forecast, 2019-2031
- 15.1. Market Analysis, Insights and Forecast - By Country/Sub-region
- 15.1.1 Saudi Arabia
- 15.1.2 United Arab Emirates
- 15.1.3 Kuwait
- 15.1.4 Rest of Middle East and Africa
- 16. Competitive Analysis
- 16.1. Global Market Share Analysis 2024
- 16.2. Company Profiles
- 16.2.1 All Safe Industries Inc
- 16.2.1.1. Overview
- 16.2.1.2. Products
- 16.2.1.3. SWOT Analysis
- 16.2.1.4. Recent Developments
- 16.2.1.5. Financials (Based on Availability)
- 16.2.2 Drgerwerk AG & Co KG
- 16.2.2.1. Overview
- 16.2.2.2. Products
- 16.2.2.3. SWOT Analysis
- 16.2.2.4. Recent Developments
- 16.2.2.5. Financials (Based on Availability)
- 16.2.3 Honeywell International Inc
- 16.2.3.1. Overview
- 16.2.3.2. Products
- 16.2.3.3. SWOT Analysis
- 16.2.3.4. Recent Developments
- 16.2.3.5. Financials (Based on Availability)
- 16.2.4 Duram Mask
- 16.2.4.1. Overview
- 16.2.4.2. Products
- 16.2.4.3. SWOT Analysis
- 16.2.4.4. Recent Developments
- 16.2.4.5. Financials (Based on Availability)
- 16.2.5 Johnson Control
- 16.2.5.1. Overview
- 16.2.5.2. Products
- 16.2.5.3. SWOT Analysis
- 16.2.5.4. Recent Developments
- 16.2.5.5. Financials (Based on Availability)
- 16.2.6 MSA Safety Incorporated
- 16.2.6.1. Overview
- 16.2.6.2. Products
- 16.2.6.3. SWOT Analysis
- 16.2.6.4. Recent Developments
- 16.2.6.5. Financials (Based on Availability)
- 16.2.7 3M
- 16.2.7.1. Overview
- 16.2.7.2. Products
- 16.2.7.3. SWOT Analysis
- 16.2.7.4. Recent Developments
- 16.2.7.5. Financials (Based on Availability)
- 16.2.8 Metadure Parts & Sales Inc
- 16.2.8.1. Overview
- 16.2.8.2. Products
- 16.2.8.3. SWOT Analysis
- 16.2.8.4. Recent Developments
- 16.2.8.5. Financials (Based on Availability)
- 16.2.9 Nexter Group
- 16.2.9.1. Overview
- 16.2.9.2. Products
- 16.2.9.3. SWOT Analysis
- 16.2.9.4. Recent Developments
- 16.2.9.5. Financials (Based on Availability)
- 16.2.10 Shalon Chemical Industries Ltd
- 16.2.10.1. Overview
- 16.2.10.2. Products
- 16.2.10.3. SWOT Analysis
- 16.2.10.4. Recent Developments
- 16.2.10.5. Financials (Based on Availability)
- 16.2.11 TSI Incorporate
- 16.2.11.1. Overview
- 16.2.11.2. Products
- 16.2.11.3. SWOT Analysis
- 16.2.11.4. Recent Developments
- 16.2.11.5. Financials (Based on Availability)
- 16.2.12 Avon Protection plc
- 16.2.12.1. Overview
- 16.2.12.2. Products
- 16.2.12.3. SWOT Analysis
- 16.2.12.4. Recent Developments
- 16.2.12.5. Financials (Based on Availability)
- 16.2.1 All Safe Industries Inc
List of Figures
- Figure 1: Global Military Gas Mask Market Revenue Breakdown (Million, %) by Region 2024 & 2032
- Figure 2: North America Military Gas Mask Market Revenue (Million), by Country 2024 & 2032
- Figure 3: North America Military Gas Mask Market Revenue Share (%), by Country 2024 & 2032
- Figure 4: Europe Military Gas Mask Market Revenue (Million), by Country 2024 & 2032
- Figure 5: Europe Military Gas Mask Market Revenue Share (%), by Country 2024 & 2032
- Figure 6: Asia Pacific Military Gas Mask Market Revenue (Million), by Country 2024 & 2032
- Figure 7: Asia Pacific Military Gas Mask Market Revenue Share (%), by Country 2024 & 2032
- Figure 8: Latin America Military Gas Mask Market Revenue (Million), by Country 2024 & 2032
- Figure 9: Latin America Military Gas Mask Market Revenue Share (%), by Country 2024 & 2032
- Figure 10: Middle East and Africa Military Gas Mask Market Revenue (Million), by Country 2024 & 2032
- Figure 11: Middle East and Africa Military Gas Mask Market Revenue Share (%), by Country 2024 & 2032
- Figure 12: North America Military Gas Mask Market Revenue (Million), by Mask Type 2024 & 2032
- Figure 13: North America Military Gas Mask Market Revenue Share (%), by Mask Type 2024 & 2032
- Figure 14: North America Military Gas Mask Market Revenue (Million), by Product Type 2024 & 2032
- Figure 15: North America Military Gas Mask Market Revenue Share (%), by Product Type 2024 & 2032
- Figure 16: North America Military Gas Mask Market Revenue (Million), by End User 2024 & 2032
- Figure 17: North America Military Gas Mask Market Revenue Share (%), by End User 2024 & 2032
- Figure 18: North America Military Gas Mask Market Revenue (Million), by Country 2024 & 2032
- Figure 19: North America Military Gas Mask Market Revenue Share (%), by Country 2024 & 2032
- Figure 20: Europe Military Gas Mask Market Revenue (Million), by Mask Type 2024 & 2032
- Figure 21: Europe Military Gas Mask Market Revenue Share (%), by Mask Type 2024 & 2032
- Figure 22: Europe Military Gas Mask Market Revenue (Million), by Product Type 2024 & 2032
- Figure 23: Europe Military Gas Mask Market Revenue Share (%), by Product Type 2024 & 2032
- Figure 24: Europe Military Gas Mask Market Revenue (Million), by End User 2024 & 2032
- Figure 25: Europe Military Gas Mask Market Revenue Share (%), by End User 2024 & 2032
- Figure 26: Europe Military Gas Mask Market Revenue (Million), by Country 2024 & 2032
- Figure 27: Europe Military Gas Mask Market Revenue Share (%), by Country 2024 & 2032
- Figure 28: Asia Pacific Military Gas Mask Market Revenue (Million), by Mask Type 2024 & 2032
- Figure 29: Asia Pacific Military Gas Mask Market Revenue Share (%), by Mask Type 2024 & 2032
- Figure 30: Asia Pacific Military Gas Mask Market Revenue (Million), by Product Type 2024 & 2032
- Figure 31: Asia Pacific Military Gas Mask Market Revenue Share (%), by Product Type 2024 & 2032
- Figure 32: Asia Pacific Military Gas Mask Market Revenue (Million), by End User 2024 & 2032
- Figure 33: Asia Pacific Military Gas Mask Market Revenue Share (%), by End User 2024 & 2032
- Figure 34: Asia Pacific Military Gas Mask Market Revenue (Million), by Country 2024 & 2032
- Figure 35: Asia Pacific Military Gas Mask Market Revenue Share (%), by Country 2024 & 2032
- Figure 36: Latin America Military Gas Mask Market Revenue (Million), by Mask Type 2024 & 2032
- Figure 37: Latin America Military Gas Mask Market Revenue Share (%), by Mask Type 2024 & 2032
- Figure 38: Latin America Military Gas Mask Market Revenue (Million), by Product Type 2024 & 2032
- Figure 39: Latin America Military Gas Mask Market Revenue Share (%), by Product Type 2024 & 2032
- Figure 40: Latin America Military Gas Mask Market Revenue (Million), by End User 2024 & 2032
- Figure 41: Latin America Military Gas Mask Market Revenue Share (%), by End User 2024 & 2032
- Figure 42: Latin America Military Gas Mask Market Revenue (Million), by Country 2024 & 2032
- Figure 43: Latin America Military Gas Mask Market Revenue Share (%), by Country 2024 & 2032
- Figure 44: Middle East and Africa Military Gas Mask Market Revenue (Million), by Mask Type 2024 & 2032
- Figure 45: Middle East and Africa Military Gas Mask Market Revenue Share (%), by Mask Type 2024 & 2032
- Figure 46: Middle East and Africa Military Gas Mask Market Revenue (Million), by Product Type 2024 & 2032
- Figure 47: Middle East and Africa Military Gas Mask Market Revenue Share (%), by Product Type 2024 & 2032
- Figure 48: Middle East and Africa Military Gas Mask Market Revenue (Million), by End User 2024 & 2032
- Figure 49: Middle East and Africa Military Gas Mask Market Revenue Share (%), by End User 2024 & 2032
- Figure 50: Middle East and Africa Military Gas Mask Market Revenue (Million), by Country 2024 & 2032
- Figure 51: Middle East and Africa Military Gas Mask Market Revenue Share (%), by Country 2024 & 2032
List of Tables
- Table 1: Global Military Gas Mask Market Revenue Million Forecast, by Region 2019 & 2032
- Table 2: Global Military Gas Mask Market Revenue Million Forecast, by Mask Type 2019 & 2032
- Table 3: Global Military Gas Mask Market Revenue Million Forecast, by Product Type 2019 & 2032
- Table 4: Global Military Gas Mask Market Revenue Million Forecast, by End User 2019 & 2032
- Table 5: Global Military Gas Mask Market Revenue Million Forecast, by Region 2019 & 2032
- Table 6: Global Military Gas Mask Market Revenue Million Forecast, by Country 2019 & 2032
- Table 7: United States Military Gas Mask Market Revenue (Million) Forecast, by Application 2019 & 2032
- Table 8: Canada Military Gas Mask Market Revenue (Million) Forecast, by Application 2019 & 2032
- Table 9: Global Military Gas Mask Market Revenue Million Forecast, by Country 2019 & 2032
- Table 10: Germany Military Gas Mask Market Revenue (Million) Forecast, by Application 2019 & 2032
- Table 11: United Kingdom Military Gas Mask Market Revenue (Million) Forecast, by Application 2019 & 2032
- Table 12: France Military Gas Mask Market Revenue (Million) Forecast, by Application 2019 & 2032
- Table 13: Russia Military Gas Mask Market Revenue (Million) Forecast, by Application 2019 & 2032
- Table 14: Rest of Europe Military Gas Mask Market Revenue (Million) Forecast, by Application 2019 & 2032
- Table 15: Global Military Gas Mask Market Revenue Million Forecast, by Country 2019 & 2032
- Table 16: China Military Gas Mask Market Revenue (Million) Forecast, by Application 2019 & 2032
- Table 17: Japan Military Gas Mask Market Revenue (Million) Forecast, by Application 2019 & 2032
- Table 18: India Military Gas Mask Market Revenue (Million) Forecast, by Application 2019 & 2032
- Table 19: Rest of Asia Pacific Military Gas Mask Market Revenue (Million) Forecast, by Application 2019 & 2032
- Table 20: Global Military Gas Mask Market Revenue Million Forecast, by Country 2019 & 2032
- Table 21: Brazil Military Gas Mask Market Revenue (Million) Forecast, by Application 2019 & 2032
- Table 22: Mexico Military Gas Mask Market Revenue (Million) Forecast, by Application 2019 & 2032
- Table 23: Rest of Latin America Military Gas Mask Market Revenue (Million) Forecast, by Application 2019 & 2032
- Table 24: Global Military Gas Mask Market Revenue Million Forecast, by Country 2019 & 2032
- Table 25: Saudi Arabia Military Gas Mask Market Revenue (Million) Forecast, by Application 2019 & 2032
- Table 26: United Arab Emirates Military Gas Mask Market Revenue (Million) Forecast, by Application 2019 & 2032
- Table 27: Kuwait Military Gas Mask Market Revenue (Million) Forecast, by Application 2019 & 2032
- Table 28: Rest of Middle East and Africa Military Gas Mask Market Revenue (Million) Forecast, by Application 2019 & 2032
- Table 29: Global Military Gas Mask Market Revenue Million Forecast, by Mask Type 2019 & 2032
- Table 30: Global Military Gas Mask Market Revenue Million Forecast, by Product Type 2019 & 2032
- Table 31: Global Military Gas Mask Market Revenue Million Forecast, by End User 2019 & 2032
- Table 32: Global Military Gas Mask Market Revenue Million Forecast, by Country 2019 & 2032
- Table 33: United States Military Gas Mask Market Revenue (Million) Forecast, by Application 2019 & 2032
- Table 34: Canada Military Gas Mask Market Revenue (Million) Forecast, by Application 2019 & 2032
- Table 35: Global Military Gas Mask Market Revenue Million Forecast, by Mask Type 2019 & 2032
- Table 36: Global Military Gas Mask Market Revenue Million Forecast, by Product Type 2019 & 2032
- Table 37: Global Military Gas Mask Market Revenue Million Forecast, by End User 2019 & 2032
- Table 38: Global Military Gas Mask Market Revenue Million Forecast, by Country 2019 & 2032
- Table 39: Germany Military Gas Mask Market Revenue (Million) Forecast, by Application 2019 & 2032
- Table 40: United Kingdom Military Gas Mask Market Revenue (Million) Forecast, by Application 2019 & 2032
- Table 41: France Military Gas Mask Market Revenue (Million) Forecast, by Application 2019 & 2032
- Table 42: Russia Military Gas Mask Market Revenue (Million) Forecast, by Application 2019 & 2032
- Table 43: Rest of Europe Military Gas Mask Market Revenue (Million) Forecast, by Application 2019 & 2032
- Table 44: Global Military Gas Mask Market Revenue Million Forecast, by Mask Type 2019 & 2032
- Table 45: Global Military Gas Mask Market Revenue Million Forecast, by Product Type 2019 & 2032
- Table 46: Global Military Gas Mask Market Revenue Million Forecast, by End User 2019 & 2032
- Table 47: Global Military Gas Mask Market Revenue Million Forecast, by Country 2019 & 2032
- Table 48: China Military Gas Mask Market Revenue (Million) Forecast, by Application 2019 & 2032
- Table 49: Japan Military Gas Mask Market Revenue (Million) Forecast, by Application 2019 & 2032
- Table 50: India Military Gas Mask Market Revenue (Million) Forecast, by Application 2019 & 2032
- Table 51: Rest of Asia Pacific Military Gas Mask Market Revenue (Million) Forecast, by Application 2019 & 2032
- Table 52: Global Military Gas Mask Market Revenue Million Forecast, by Mask Type 2019 & 2032
- Table 53: Global Military Gas Mask Market Revenue Million Forecast, by Product Type 2019 & 2032
- Table 54: Global Military Gas Mask Market Revenue Million Forecast, by End User 2019 & 2032
- Table 55: Global Military Gas Mask Market Revenue Million Forecast, by Country 2019 & 2032
- Table 56: Brazil Military Gas Mask Market Revenue (Million) Forecast, by Application 2019 & 2032
- Table 57: Mexico Military Gas Mask Market Revenue (Million) Forecast, by Application 2019 & 2032
- Table 58: Rest of Latin America Military Gas Mask Market Revenue (Million) Forecast, by Application 2019 & 2032
- Table 59: Global Military Gas Mask Market Revenue Million Forecast, by Mask Type 2019 & 2032
- Table 60: Global Military Gas Mask Market Revenue Million Forecast, by Product Type 2019 & 2032
- Table 61: Global Military Gas Mask Market Revenue Million Forecast, by End User 2019 & 2032
- Table 62: Global Military Gas Mask Market Revenue Million Forecast, by Country 2019 & 2032
- Table 63: Saudi Arabia Military Gas Mask Market Revenue (Million) Forecast, by Application 2019 & 2032
- Table 64: United Arab Emirates Military Gas Mask Market Revenue (Million) Forecast, by Application 2019 & 2032
- Table 65: Kuwait Military Gas Mask Market Revenue (Million) Forecast, by Application 2019 & 2032
- Table 66: Rest of Middle East and Africa Military Gas Mask Market Revenue (Million) Forecast, by Application 2019 & 2032
Frequently Asked Questions
1. What is the projected Compound Annual Growth Rate (CAGR) of the Military Gas Mask Market?
The projected CAGR is approximately 3.00%.
2. Which companies are prominent players in the Military Gas Mask Market?
Key companies in the market include All Safe Industries Inc, Drgerwerk AG & Co KG, Honeywell International Inc, Duram Mask, Johnson Control, MSA Safety Incorporated, 3M, Metadure Parts & Sales Inc, Nexter Group, Shalon Chemical Industries Ltd, TSI Incorporate, Avon Protection plc.
3. What are the main segments of the Military Gas Mask Market?
The market segments include Mask Type, Product Type, End User.
4. Can you provide details about the market size?
The market size is estimated to be USD XX Million as of 2022.
5. What are some drivers contributing to market growth?
N/A
6. What are the notable trends driving market growth?
The Full-Face Gas Mask Segment Is Expected To Witness A Significant Growth During The Forecast Period..
7. Are there any restraints impacting market growth?
N/A
8. Can you provide examples of recent developments in the market?
N/A
9. What pricing options are available for accessing the report?
Pricing options include single-user, multi-user, and enterprise licenses priced at USD 4750, USD 5250, and USD 8750 respectively.
10. Is the market size provided in terms of value or volume?
The market size is provided in terms of value, measured in Million.
11. Are there any specific market keywords associated with the report?
Yes, the market keyword associated with the report is "Military Gas Mask Market," which aids in identifying and referencing the specific market segment covered.
12. How do I determine which pricing option suits my needs best?
The pricing options vary based on user requirements and access needs. Individual users may opt for single-user licenses, while businesses requiring broader access may choose multi-user or enterprise licenses for cost-effective access to the report.
13. Are there any additional resources or data provided in the Military Gas Mask Market report?
While the report offers comprehensive insights, it's advisable to review the specific contents or supplementary materials provided to ascertain if additional resources or data are available.
14. How can I stay updated on further developments or reports in the Military Gas Mask Market?
To stay informed about further developments, trends, and reports in the Military Gas Mask Market, consider subscribing to industry newsletters, following relevant companies and organizations, or regularly checking reputable industry news sources and publications.
Methodology
Step 1 - Identification of Relevant Samples Size from Population Database


Step 2 - Approaches for Defining Global Market Size (Value, Volume* & Price*)

Note*: In applicable scenarios
Step 3 - Data Sources
Primary Research
- Web Analytics
- Survey Reports
- Research Institute
- Latest Research Reports
- Opinion Leaders
Secondary Research
- Annual Reports
- White Paper
- Latest Press Release
- Industry Association
- Paid Database
- Investor Presentations

Step 4 - Data Triangulation
Involves using different sources of information in order to increase the validity of a study
These sources are likely to be stakeholders in a program - participants, other researchers, program staff, other community members, and so on.
Then we put all data in single framework & apply various statistical tools to find out the dynamic on the market.
During the analysis stage, feedback from the stakeholder groups would be compared to determine areas of agreement as well as areas of divergence
