

Key Insights
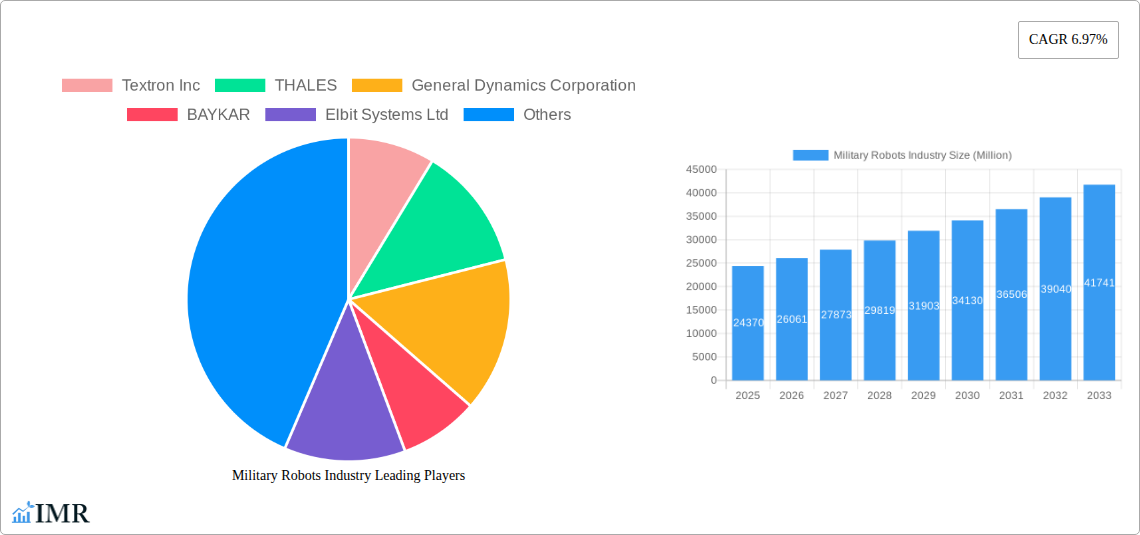
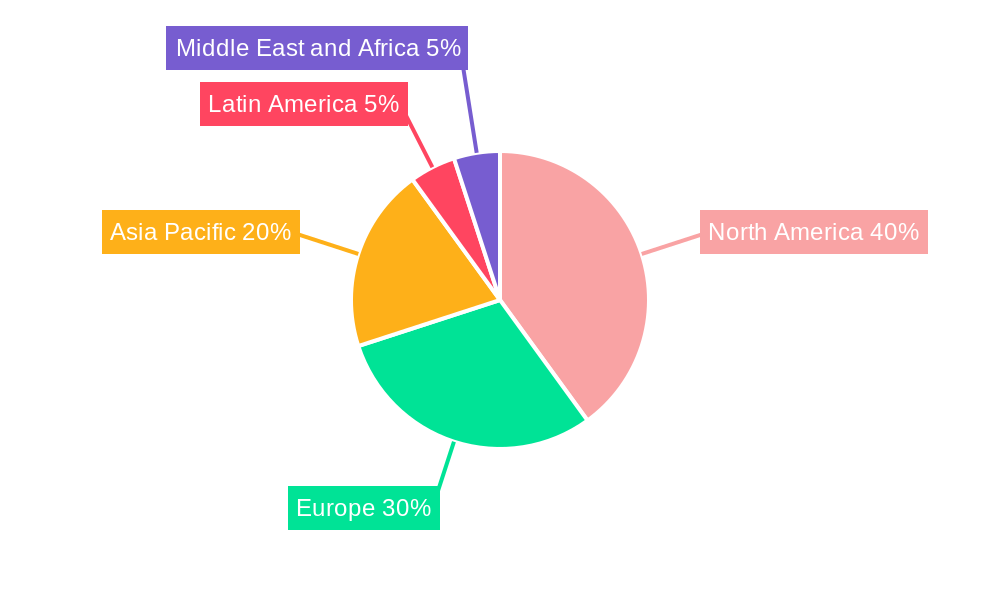
The global military robots market, valued at $24.37 billion in 2025, is projected to experience robust growth, driven by increasing defense budgets worldwide and the escalating demand for unmanned systems to enhance operational efficiency and reduce soldier casualties. The market's Compound Annual Growth Rate (CAGR) of 6.97% from 2019 to 2024 suggests a continued upward trajectory through 2033. Key drivers include advancements in artificial intelligence (AI), enabling greater autonomy and sophisticated functionalities in military robots. The rising adoption of autonomous systems for surveillance, reconnaissance, and explosive ordnance disposal (EOD) further fuels market expansion. Technological advancements in robotics, sensor technology, and communication systems are also contributing to this growth. Segmentation reveals significant opportunities across various platforms (land, marine, airborne) and operational modes (human-operated, autonomous). The autonomous segment is expected to exhibit faster growth due to its potential for minimizing human risk in hazardous environments. Geographic distribution indicates strong demand from North America and Europe, fueled by substantial defense spending and technological advancements. However, the Asia-Pacific region is also witnessing rapid growth due to increasing geopolitical tensions and modernization of defense forces. Restraints include high initial investment costs, concerns regarding cybersecurity and ethical implications of autonomous weapons systems, and stringent regulatory frameworks surrounding their deployment.
Despite these challenges, the market is expected to witness continuous expansion, fueled by ongoing technological innovation and evolving military strategies. The increasing integration of AI and machine learning (ML) into military robots will significantly enhance their capabilities, leading to greater adoption across diverse military applications. The ongoing conflicts and the need for improved battlefield situational awareness and precision strike capabilities will serve as powerful catalysts for growth. The growing preference for unmanned systems over manned platforms in high-risk operations will also drive market expansion. Competition among major players, including Textron Inc, Thales, General Dynamics, and others, is fostering innovation and driving down costs, making these technologies more accessible to a broader range of military organizations. Future growth will likely be influenced by the pace of technological advancements, geopolitical dynamics, and the evolving regulatory landscape.
Military Robots Industry Market Report: 2019-2033
This comprehensive report provides a detailed analysis of the Military Robots industry, encompassing market dynamics, growth trends, key players, and future outlook. The study period covers 2019-2033, with a base year of 2025 and a forecast period of 2025-2033. The report segments the market by platform (Land, Marine, Airborne) and mode of operation (Human Operated, Autonomous), offering granular insights into this rapidly evolving sector. This in-depth analysis is crucial for industry professionals, investors, and strategic decision-makers seeking to understand and capitalize on the opportunities within the military robotics landscape. The total market size is predicted to reach xx Million units by 2033.
Military Robots Industry Market Dynamics & Structure
The Military Robots market is characterized by a moderately concentrated structure, with a few major players holding significant market share. Technological innovation is a key driver, with advancements in AI, robotics, and sensor technologies continually pushing the boundaries of capabilities. Stringent regulatory frameworks, particularly regarding autonomous systems and ethical considerations, influence market development. Competitive product substitutes are limited, given the specialized nature of military applications. End-user demographics are primarily focused on government defense departments and allied forces globally. M&A activity has been notable, with larger companies acquiring smaller firms to expand their technology portfolios and market reach. Deal volume in the past five years is estimated at xx Million deals.
- Market Concentration: Moderately concentrated, with top 5 players holding approximately xx% market share (2024).
- Technological Innovation: Key drivers include AI, advanced sensors, improved autonomy, and miniaturization.
- Regulatory Framework: Stringent regulations regarding autonomous weapons systems and data security impact market growth.
- Competitive Substitutes: Limited due to specialized military requirements.
- End-User Demographics: Primarily government defense departments and armed forces.
- M&A Trends: Significant activity driven by technology acquisition and market expansion strategies.
Military Robots Industry Growth Trends & Insights
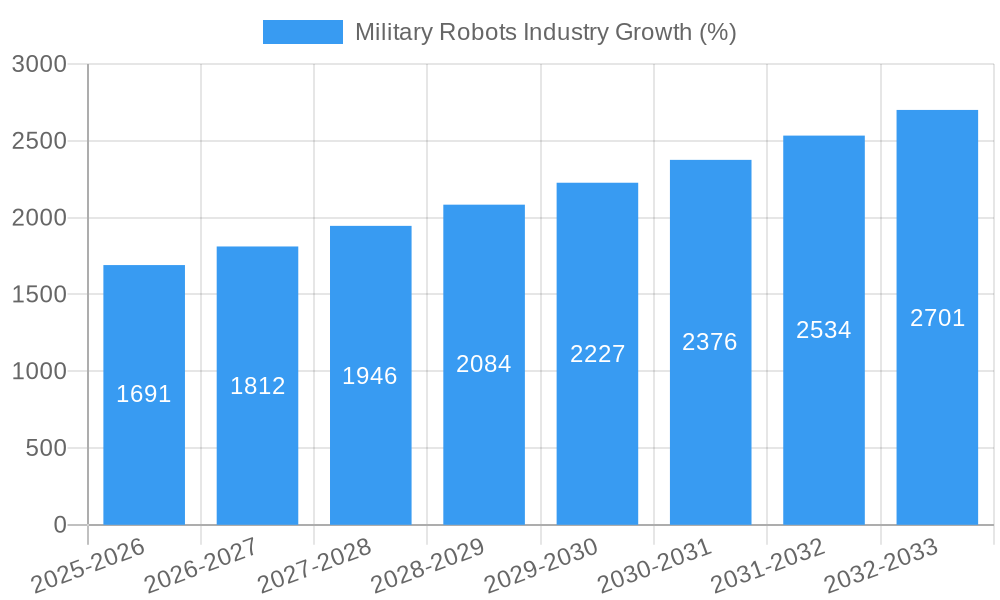
The Military Robots market has experienced robust growth, driven by increasing defense budgets globally and the demand for enhanced operational capabilities. The market is projected to witness a CAGR of xx% during the forecast period (2025-2033). Adoption rates are rising steadily, fueled by successful deployments in various military operations and continuous technological improvements. The integration of AI and autonomous capabilities is revolutionizing battlefield tactics and creating new market opportunities. Consumer behavior shifts within the defense sector are leading to increased demand for adaptable, versatile, and technologically advanced robotic systems. Market penetration is expected to reach xx% by 2033.
Dominant Regions, Countries, or Segments in Military Robots Industry
The North American region currently holds a leading position in the Military Robots market, driven by significant defense spending and technological advancements. The US Army's modernization initiatives play a crucial role in driving demand. Within platforms, the Land segment dominates owing to the widespread use of unmanned ground vehicles (UGVs) in various military operations. The autonomous mode of operation segment demonstrates significant growth potential due to advancements in AI and the push for less human-intensive military operations.
- Key Drivers in North America: High defense expenditure, technological innovation, and supportive government policies.
- Land Segment Dominance: Wide adoption of UGVs for reconnaissance, explosive ordnance disposal, and logistics.
- Autonomous Operations Growth: Increasing demand for AI-powered robots to reduce human risk and improve efficiency.
- European Market: Strong presence of key players and significant investment in R&D.
- Asia-Pacific Market: Rapid growth driven by increasing defense budgets and technological advancements in nations like China.
Military Robots Industry Product Landscape
Military robots encompass a diverse range of platforms and functionalities, including unmanned ground vehicles (UGVs), unmanned aerial vehicles (UAVs), and unmanned underwater vehicles (UUVs). These robots are deployed in various applications, such as reconnaissance, surveillance, bomb disposal, and combat support. Technological advancements are enhancing robot capabilities in terms of autonomy, payload capacity, and operational range. Key innovations focus on improved AI-powered navigation, advanced sensor integration, and enhanced resilience against enemy countermeasures. Unique selling propositions are built around increased survivability for soldiers, improved situational awareness, and cost-effectiveness compared to traditional methods.
Key Drivers, Barriers & Challenges in Military Robots Industry
Key Drivers:
- Rising defense budgets globally.
- Growing demand for unmanned systems to reduce human casualties.
- Technological advancements in AI, robotics, and sensor technologies.
- Need for improved situational awareness and reconnaissance capabilities.
Key Barriers and Challenges:
- High initial investment costs.
- Concerns regarding autonomous weapon systems and ethical implications.
- Dependence on complex supply chains and potential disruptions.
- Cybersecurity threats and vulnerabilities.
- Integration challenges with existing military systems.
Emerging Opportunities in Military Robots Industry
- Expansion into new applications, such as logistics and support roles.
- Development of more affordable and accessible robots for smaller militaries.
- Increased focus on human-robot collaboration and teaming.
- Integration of robots into wider military command and control systems.
Growth Accelerators in the Military Robots Industry Industry
Technological breakthroughs in AI and autonomous systems are significantly accelerating market growth. Strategic partnerships between defense contractors and technology companies are fostering innovation and facilitating faster product development. Expansion into new geographic markets, especially in developing nations, presents substantial growth opportunities. The ongoing trend towards smaller, more agile robots is creating additional demand.
Key Players Shaping the Military Robots Industry Market
- Textron Inc
- THALES
- General Dynamics Corporation
- BAYKAR
- Elbit Systems Ltd
- Lockheed Martin Corporation
- QinetiQ Group PLC
- Cobham Ltd
- AeroVironment Inc
- IAI
- Aeronautics Ltd
- BAE Systems plc
- Northrop Grumman Corporation
- Saab AB
- Teledyne FLIR LLC
Notable Milestones in Military Robots Industry Sector
- October 2023: The US Army initiates development of integrated robot-human operator formations for enhanced battlefield coordination.
- July 2022: Teledyne FLIR Defense secures a USD 62.1 million contract for 500 Centaur multi-mission robots.
- January 2022: China unveils a large electrically powered quadruped robot for military logistics and reconnaissance.
In-Depth Military Robots Industry Market Outlook
The Military Robots market is poised for sustained growth, driven by continuous technological advancements, increasing defense budgets, and the growing need for enhanced military capabilities. Strategic partnerships, market expansion into new regions, and the development of innovative applications will further fuel market expansion. The focus on autonomous systems and AI-driven capabilities will shape the future of military robotics, offering considerable opportunities for companies with cutting-edge technologies and innovative solutions.
Military Robots Industry Segmentation
- 1. Production Analysis
- 2. Consumption Analysis
- 3. Import Market Analysis (Value & Volume)
- 4. Export Market Analysis (Value & Volume)
- 5. Price Trend Analysis
Military Robots Industry Segmentation By Geography
-
1. North America
- 1.1. United States
- 1.2. Canada
- 1.3. Mexico
-
2. South America
- 2.1. Brazil
- 2.2. Argentina
- 2.3. Rest of South America
-
3. Europe
- 3.1. United Kingdom
- 3.2. Germany
- 3.3. France
- 3.4. Italy
- 3.5. Spain
- 3.6. Russia
- 3.7. Benelux
- 3.8. Nordics
- 3.9. Rest of Europe
-
4. Middle East & Africa
- 4.1. Turkey
- 4.2. Israel
- 4.3. GCC
- 4.4. North Africa
- 4.5. South Africa
- 4.6. Rest of Middle East & Africa
-
5. Asia Pacific
- 5.1. China
- 5.2. India
- 5.3. Japan
- 5.4. South Korea
- 5.5. ASEAN
- 5.6. Oceania
- 5.7. Rest of Asia Pacific
Military Robots Industry REPORT HIGHLIGHTS
| Aspects | Details |
|---|---|
| Study Period | 2019-2033 |
| Base Year | 2024 |
| Estimated Year | 2025 |
| Forecast Period | 2025-2033 |
| Historical Period | 2019-2024 |
| Growth Rate | CAGR of 6.97% from 2019-2033 |
| Segmentation |
|
Table of Contents
- 1. Introduction
- 1.1. Research Scope
- 1.2. Market Segmentation
- 1.3. Research Methodology
- 1.4. Definitions and Assumptions
- 2. Executive Summary
- 2.1. Introduction
- 3. Market Dynamics
- 3.1. Introduction
- 3.2. Market Drivers
- 3.2.1. ; Increasing Number Of Air Passengers; Use Of Portable Electronic Devices
- 3.3. Market Restrains
- 3.3.1. ; High Cost Of Connectivity Equipments
- 3.4. Market Trends
- 3.4.1. Land Segment Anticipated to Generate Highest Growth During the Forecast Period
- 4. Market Factor Analysis
- 4.1. Porters Five Forces
- 4.2. Supply/Value Chain
- 4.3. PESTEL analysis
- 4.4. Market Entropy
- 4.5. Patent/Trademark Analysis
- 5. Global Military Robots Industry Analysis, Insights and Forecast, 2019-2031
- 5.1. Market Analysis, Insights and Forecast - by Production Analysis
- 5.2. Market Analysis, Insights and Forecast - by Consumption Analysis
- 5.3. Market Analysis, Insights and Forecast - by Import Market Analysis (Value & Volume)
- 5.4. Market Analysis, Insights and Forecast - by Export Market Analysis (Value & Volume)
- 5.5. Market Analysis, Insights and Forecast - by Price Trend Analysis
- 5.6. Market Analysis, Insights and Forecast - by Region
- 5.6.1. North America
- 5.6.2. South America
- 5.6.3. Europe
- 5.6.4. Middle East & Africa
- 5.6.5. Asia Pacific
- 5.1. Market Analysis, Insights and Forecast - by Production Analysis
- 6. North America Military Robots Industry Analysis, Insights and Forecast, 2019-2031
- 6.1. Market Analysis, Insights and Forecast - by Production Analysis
- 6.2. Market Analysis, Insights and Forecast - by Consumption Analysis
- 6.3. Market Analysis, Insights and Forecast - by Import Market Analysis (Value & Volume)
- 6.4. Market Analysis, Insights and Forecast - by Export Market Analysis (Value & Volume)
- 6.5. Market Analysis, Insights and Forecast - by Price Trend Analysis
- 6.1. Market Analysis, Insights and Forecast - by Production Analysis
- 7. South America Military Robots Industry Analysis, Insights and Forecast, 2019-2031
- 7.1. Market Analysis, Insights and Forecast - by Production Analysis
- 7.2. Market Analysis, Insights and Forecast - by Consumption Analysis
- 7.3. Market Analysis, Insights and Forecast - by Import Market Analysis (Value & Volume)
- 7.4. Market Analysis, Insights and Forecast - by Export Market Analysis (Value & Volume)
- 7.5. Market Analysis, Insights and Forecast - by Price Trend Analysis
- 7.1. Market Analysis, Insights and Forecast - by Production Analysis
- 8. Europe Military Robots Industry Analysis, Insights and Forecast, 2019-2031
- 8.1. Market Analysis, Insights and Forecast - by Production Analysis
- 8.2. Market Analysis, Insights and Forecast - by Consumption Analysis
- 8.3. Market Analysis, Insights and Forecast - by Import Market Analysis (Value & Volume)
- 8.4. Market Analysis, Insights and Forecast - by Export Market Analysis (Value & Volume)
- 8.5. Market Analysis, Insights and Forecast - by Price Trend Analysis
- 8.1. Market Analysis, Insights and Forecast - by Production Analysis
- 9. Middle East & Africa Military Robots Industry Analysis, Insights and Forecast, 2019-2031
- 9.1. Market Analysis, Insights and Forecast - by Production Analysis
- 9.2. Market Analysis, Insights and Forecast - by Consumption Analysis
- 9.3. Market Analysis, Insights and Forecast - by Import Market Analysis (Value & Volume)
- 9.4. Market Analysis, Insights and Forecast - by Export Market Analysis (Value & Volume)
- 9.5. Market Analysis, Insights and Forecast - by Price Trend Analysis
- 9.1. Market Analysis, Insights and Forecast - by Production Analysis
- 10. Asia Pacific Military Robots Industry Analysis, Insights and Forecast, 2019-2031
- 10.1. Market Analysis, Insights and Forecast - by Production Analysis
- 10.2. Market Analysis, Insights and Forecast - by Consumption Analysis
- 10.3. Market Analysis, Insights and Forecast - by Import Market Analysis (Value & Volume)
- 10.4. Market Analysis, Insights and Forecast - by Export Market Analysis (Value & Volume)
- 10.5. Market Analysis, Insights and Forecast - by Price Trend Analysis
- 10.1. Market Analysis, Insights and Forecast - by Production Analysis
- 11. North America Military Robots Industry Analysis, Insights and Forecast, 2019-2031
- 11.1. Market Analysis, Insights and Forecast - By Country/Sub-region
- 11.1.1 United States
- 11.1.2 Canada
- 12. Europe Military Robots Industry Analysis, Insights and Forecast, 2019-2031
- 12.1. Market Analysis, Insights and Forecast - By Country/Sub-region
- 12.1.1 United Kingdom
- 12.1.2 France
- 12.1.3 Germany
- 12.1.4 Russia
- 12.1.5 Rest of Europe
- 13. Asia Pacific Military Robots Industry Analysis, Insights and Forecast, 2019-2031
- 13.1. Market Analysis, Insights and Forecast - By Country/Sub-region
- 13.1.1 China
- 13.1.2 India
- 13.1.3 Japan
- 13.1.4 South Korea
- 13.1.5 Rest of Asia Pacific
- 14. Latin America Military Robots Industry Analysis, Insights and Forecast, 2019-2031
- 14.1. Market Analysis, Insights and Forecast - By Country/Sub-region
- 14.1.1 Brazil
- 14.1.2 Rest of Latin America
- 15. Middle East and Africa Military Robots Industry Analysis, Insights and Forecast, 2019-2031
- 15.1. Market Analysis, Insights and Forecast - By Country/Sub-region
- 15.1.1 Saudi Arabia
- 15.1.2 United Arab Emirates
- 15.1.3 Israel
- 15.1.4 Turkey
- 15.1.5 Rest of Middle East and Africa
- 16. Competitive Analysis
- 16.1. Global Market Share Analysis 2024
- 16.2. Company Profiles
- 16.2.1 Textron Inc
- 16.2.1.1. Overview
- 16.2.1.2. Products
- 16.2.1.3. SWOT Analysis
- 16.2.1.4. Recent Developments
- 16.2.1.5. Financials (Based on Availability)
- 16.2.2 THALES
- 16.2.2.1. Overview
- 16.2.2.2. Products
- 16.2.2.3. SWOT Analysis
- 16.2.2.4. Recent Developments
- 16.2.2.5. Financials (Based on Availability)
- 16.2.3 General Dynamics Corporation
- 16.2.3.1. Overview
- 16.2.3.2. Products
- 16.2.3.3. SWOT Analysis
- 16.2.3.4. Recent Developments
- 16.2.3.5. Financials (Based on Availability)
- 16.2.4 BAYKAR
- 16.2.4.1. Overview
- 16.2.4.2. Products
- 16.2.4.3. SWOT Analysis
- 16.2.4.4. Recent Developments
- 16.2.4.5. Financials (Based on Availability)
- 16.2.5 Elbit Systems Ltd
- 16.2.5.1. Overview
- 16.2.5.2. Products
- 16.2.5.3. SWOT Analysis
- 16.2.5.4. Recent Developments
- 16.2.5.5. Financials (Based on Availability)
- 16.2.6 Lockheed Martin Corporation
- 16.2.6.1. Overview
- 16.2.6.2. Products
- 16.2.6.3. SWOT Analysis
- 16.2.6.4. Recent Developments
- 16.2.6.5. Financials (Based on Availability)
- 16.2.7 QinetiQ Group PLC
- 16.2.7.1. Overview
- 16.2.7.2. Products
- 16.2.7.3. SWOT Analysis
- 16.2.7.4. Recent Developments
- 16.2.7.5. Financials (Based on Availability)
- 16.2.8 Cobham Ltd
- 16.2.8.1. Overview
- 16.2.8.2. Products
- 16.2.8.3. SWOT Analysis
- 16.2.8.4. Recent Developments
- 16.2.8.5. Financials (Based on Availability)
- 16.2.9 AeroVironment Inc
- 16.2.9.1. Overview
- 16.2.9.2. Products
- 16.2.9.3. SWOT Analysis
- 16.2.9.4. Recent Developments
- 16.2.9.5. Financials (Based on Availability)
- 16.2.10 IAI
- 16.2.10.1. Overview
- 16.2.10.2. Products
- 16.2.10.3. SWOT Analysis
- 16.2.10.4. Recent Developments
- 16.2.10.5. Financials (Based on Availability)
- 16.2.11 Aeronautics Ltd
- 16.2.11.1. Overview
- 16.2.11.2. Products
- 16.2.11.3. SWOT Analysis
- 16.2.11.4. Recent Developments
- 16.2.11.5. Financials (Based on Availability)
- 16.2.12 BAE Systems plc
- 16.2.12.1. Overview
- 16.2.12.2. Products
- 16.2.12.3. SWOT Analysis
- 16.2.12.4. Recent Developments
- 16.2.12.5. Financials (Based on Availability)
- 16.2.13 Northrop Grumman Corporation
- 16.2.13.1. Overview
- 16.2.13.2. Products
- 16.2.13.3. SWOT Analysis
- 16.2.13.4. Recent Developments
- 16.2.13.5. Financials (Based on Availability)
- 16.2.14 Saab AB
- 16.2.14.1. Overview
- 16.2.14.2. Products
- 16.2.14.3. SWOT Analysis
- 16.2.14.4. Recent Developments
- 16.2.14.5. Financials (Based on Availability)
- 16.2.15 Teledyne FLIR LLC
- 16.2.15.1. Overview
- 16.2.15.2. Products
- 16.2.15.3. SWOT Analysis
- 16.2.15.4. Recent Developments
- 16.2.15.5. Financials (Based on Availability)
- 16.2.1 Textron Inc
List of Figures
- Figure 1: Global Military Robots Industry Revenue Breakdown (Million, %) by Region 2024 & 2032
- Figure 2: North America Military Robots Industry Revenue (Million), by Country 2024 & 2032
- Figure 3: North America Military Robots Industry Revenue Share (%), by Country 2024 & 2032
- Figure 4: Europe Military Robots Industry Revenue (Million), by Country 2024 & 2032
- Figure 5: Europe Military Robots Industry Revenue Share (%), by Country 2024 & 2032
- Figure 6: Asia Pacific Military Robots Industry Revenue (Million), by Country 2024 & 2032
- Figure 7: Asia Pacific Military Robots Industry Revenue Share (%), by Country 2024 & 2032
- Figure 8: Latin America Military Robots Industry Revenue (Million), by Country 2024 & 2032
- Figure 9: Latin America Military Robots Industry Revenue Share (%), by Country 2024 & 2032
- Figure 10: Middle East and Africa Military Robots Industry Revenue (Million), by Country 2024 & 2032
- Figure 11: Middle East and Africa Military Robots Industry Revenue Share (%), by Country 2024 & 2032
- Figure 12: North America Military Robots Industry Revenue (Million), by Production Analysis 2024 & 2032
- Figure 13: North America Military Robots Industry Revenue Share (%), by Production Analysis 2024 & 2032
- Figure 14: North America Military Robots Industry Revenue (Million), by Consumption Analysis 2024 & 2032
- Figure 15: North America Military Robots Industry Revenue Share (%), by Consumption Analysis 2024 & 2032
- Figure 16: North America Military Robots Industry Revenue (Million), by Import Market Analysis (Value & Volume) 2024 & 2032
- Figure 17: North America Military Robots Industry Revenue Share (%), by Import Market Analysis (Value & Volume) 2024 & 2032
- Figure 18: North America Military Robots Industry Revenue (Million), by Export Market Analysis (Value & Volume) 2024 & 2032
- Figure 19: North America Military Robots Industry Revenue Share (%), by Export Market Analysis (Value & Volume) 2024 & 2032
- Figure 20: North America Military Robots Industry Revenue (Million), by Price Trend Analysis 2024 & 2032
- Figure 21: North America Military Robots Industry Revenue Share (%), by Price Trend Analysis 2024 & 2032
- Figure 22: North America Military Robots Industry Revenue (Million), by Country 2024 & 2032
- Figure 23: North America Military Robots Industry Revenue Share (%), by Country 2024 & 2032
- Figure 24: South America Military Robots Industry Revenue (Million), by Production Analysis 2024 & 2032
- Figure 25: South America Military Robots Industry Revenue Share (%), by Production Analysis 2024 & 2032
- Figure 26: South America Military Robots Industry Revenue (Million), by Consumption Analysis 2024 & 2032
- Figure 27: South America Military Robots Industry Revenue Share (%), by Consumption Analysis 2024 & 2032
- Figure 28: South America Military Robots Industry Revenue (Million), by Import Market Analysis (Value & Volume) 2024 & 2032
- Figure 29: South America Military Robots Industry Revenue Share (%), by Import Market Analysis (Value & Volume) 2024 & 2032
- Figure 30: South America Military Robots Industry Revenue (Million), by Export Market Analysis (Value & Volume) 2024 & 2032
- Figure 31: South America Military Robots Industry Revenue Share (%), by Export Market Analysis (Value & Volume) 2024 & 2032
- Figure 32: South America Military Robots Industry Revenue (Million), by Price Trend Analysis 2024 & 2032
- Figure 33: South America Military Robots Industry Revenue Share (%), by Price Trend Analysis 2024 & 2032
- Figure 34: South America Military Robots Industry Revenue (Million), by Country 2024 & 2032
- Figure 35: South America Military Robots Industry Revenue Share (%), by Country 2024 & 2032
- Figure 36: Europe Military Robots Industry Revenue (Million), by Production Analysis 2024 & 2032
- Figure 37: Europe Military Robots Industry Revenue Share (%), by Production Analysis 2024 & 2032
- Figure 38: Europe Military Robots Industry Revenue (Million), by Consumption Analysis 2024 & 2032
- Figure 39: Europe Military Robots Industry Revenue Share (%), by Consumption Analysis 2024 & 2032
- Figure 40: Europe Military Robots Industry Revenue (Million), by Import Market Analysis (Value & Volume) 2024 & 2032
- Figure 41: Europe Military Robots Industry Revenue Share (%), by Import Market Analysis (Value & Volume) 2024 & 2032
- Figure 42: Europe Military Robots Industry Revenue (Million), by Export Market Analysis (Value & Volume) 2024 & 2032
- Figure 43: Europe Military Robots Industry Revenue Share (%), by Export Market Analysis (Value & Volume) 2024 & 2032
- Figure 44: Europe Military Robots Industry Revenue (Million), by Price Trend Analysis 2024 & 2032
- Figure 45: Europe Military Robots Industry Revenue Share (%), by Price Trend Analysis 2024 & 2032
- Figure 46: Europe Military Robots Industry Revenue (Million), by Country 2024 & 2032
- Figure 47: Europe Military Robots Industry Revenue Share (%), by Country 2024 & 2032
- Figure 48: Middle East & Africa Military Robots Industry Revenue (Million), by Production Analysis 2024 & 2032
- Figure 49: Middle East & Africa Military Robots Industry Revenue Share (%), by Production Analysis 2024 & 2032
- Figure 50: Middle East & Africa Military Robots Industry Revenue (Million), by Consumption Analysis 2024 & 2032
- Figure 51: Middle East & Africa Military Robots Industry Revenue Share (%), by Consumption Analysis 2024 & 2032
- Figure 52: Middle East & Africa Military Robots Industry Revenue (Million), by Import Market Analysis (Value & Volume) 2024 & 2032
- Figure 53: Middle East & Africa Military Robots Industry Revenue Share (%), by Import Market Analysis (Value & Volume) 2024 & 2032
- Figure 54: Middle East & Africa Military Robots Industry Revenue (Million), by Export Market Analysis (Value & Volume) 2024 & 2032
- Figure 55: Middle East & Africa Military Robots Industry Revenue Share (%), by Export Market Analysis (Value & Volume) 2024 & 2032
- Figure 56: Middle East & Africa Military Robots Industry Revenue (Million), by Price Trend Analysis 2024 & 2032
- Figure 57: Middle East & Africa Military Robots Industry Revenue Share (%), by Price Trend Analysis 2024 & 2032
- Figure 58: Middle East & Africa Military Robots Industry Revenue (Million), by Country 2024 & 2032
- Figure 59: Middle East & Africa Military Robots Industry Revenue Share (%), by Country 2024 & 2032
- Figure 60: Asia Pacific Military Robots Industry Revenue (Million), by Production Analysis 2024 & 2032
- Figure 61: Asia Pacific Military Robots Industry Revenue Share (%), by Production Analysis 2024 & 2032
- Figure 62: Asia Pacific Military Robots Industry Revenue (Million), by Consumption Analysis 2024 & 2032
- Figure 63: Asia Pacific Military Robots Industry Revenue Share (%), by Consumption Analysis 2024 & 2032
- Figure 64: Asia Pacific Military Robots Industry Revenue (Million), by Import Market Analysis (Value & Volume) 2024 & 2032
- Figure 65: Asia Pacific Military Robots Industry Revenue Share (%), by Import Market Analysis (Value & Volume) 2024 & 2032
- Figure 66: Asia Pacific Military Robots Industry Revenue (Million), by Export Market Analysis (Value & Volume) 2024 & 2032
- Figure 67: Asia Pacific Military Robots Industry Revenue Share (%), by Export Market Analysis (Value & Volume) 2024 & 2032
- Figure 68: Asia Pacific Military Robots Industry Revenue (Million), by Price Trend Analysis 2024 & 2032
- Figure 69: Asia Pacific Military Robots Industry Revenue Share (%), by Price Trend Analysis 2024 & 2032
- Figure 70: Asia Pacific Military Robots Industry Revenue (Million), by Country 2024 & 2032
- Figure 71: Asia Pacific Military Robots Industry Revenue Share (%), by Country 2024 & 2032
List of Tables
- Table 1: Global Military Robots Industry Revenue Million Forecast, by Region 2019 & 2032
- Table 2: Global Military Robots Industry Revenue Million Forecast, by Production Analysis 2019 & 2032
- Table 3: Global Military Robots Industry Revenue Million Forecast, by Consumption Analysis 2019 & 2032
- Table 4: Global Military Robots Industry Revenue Million Forecast, by Import Market Analysis (Value & Volume) 2019 & 2032
- Table 5: Global Military Robots Industry Revenue Million Forecast, by Export Market Analysis (Value & Volume) 2019 & 2032
- Table 6: Global Military Robots Industry Revenue Million Forecast, by Price Trend Analysis 2019 & 2032
- Table 7: Global Military Robots Industry Revenue Million Forecast, by Region 2019 & 2032
- Table 8: Global Military Robots Industry Revenue Million Forecast, by Country 2019 & 2032
- Table 9: United States Military Robots Industry Revenue (Million) Forecast, by Application 2019 & 2032
- Table 10: Canada Military Robots Industry Revenue (Million) Forecast, by Application 2019 & 2032
- Table 11: Global Military Robots Industry Revenue Million Forecast, by Country 2019 & 2032
- Table 12: United Kingdom Military Robots Industry Revenue (Million) Forecast, by Application 2019 & 2032
- Table 13: France Military Robots Industry Revenue (Million) Forecast, by Application 2019 & 2032
- Table 14: Germany Military Robots Industry Revenue (Million) Forecast, by Application 2019 & 2032
- Table 15: Russia Military Robots Industry Revenue (Million) Forecast, by Application 2019 & 2032
- Table 16: Rest of Europe Military Robots Industry Revenue (Million) Forecast, by Application 2019 & 2032
- Table 17: Global Military Robots Industry Revenue Million Forecast, by Country 2019 & 2032
- Table 18: China Military Robots Industry Revenue (Million) Forecast, by Application 2019 & 2032
- Table 19: India Military Robots Industry Revenue (Million) Forecast, by Application 2019 & 2032
- Table 20: Japan Military Robots Industry Revenue (Million) Forecast, by Application 2019 & 2032
- Table 21: South Korea Military Robots Industry Revenue (Million) Forecast, by Application 2019 & 2032
- Table 22: Rest of Asia Pacific Military Robots Industry Revenue (Million) Forecast, by Application 2019 & 2032
- Table 23: Global Military Robots Industry Revenue Million Forecast, by Country 2019 & 2032
- Table 24: Brazil Military Robots Industry Revenue (Million) Forecast, by Application 2019 & 2032
- Table 25: Rest of Latin America Military Robots Industry Revenue (Million) Forecast, by Application 2019 & 2032
- Table 26: Global Military Robots Industry Revenue Million Forecast, by Country 2019 & 2032
- Table 27: Saudi Arabia Military Robots Industry Revenue (Million) Forecast, by Application 2019 & 2032
- Table 28: United Arab Emirates Military Robots Industry Revenue (Million) Forecast, by Application 2019 & 2032
- Table 29: Israel Military Robots Industry Revenue (Million) Forecast, by Application 2019 & 2032
- Table 30: Turkey Military Robots Industry Revenue (Million) Forecast, by Application 2019 & 2032
- Table 31: Rest of Middle East and Africa Military Robots Industry Revenue (Million) Forecast, by Application 2019 & 2032
- Table 32: Global Military Robots Industry Revenue Million Forecast, by Production Analysis 2019 & 2032
- Table 33: Global Military Robots Industry Revenue Million Forecast, by Consumption Analysis 2019 & 2032
- Table 34: Global Military Robots Industry Revenue Million Forecast, by Import Market Analysis (Value & Volume) 2019 & 2032
- Table 35: Global Military Robots Industry Revenue Million Forecast, by Export Market Analysis (Value & Volume) 2019 & 2032
- Table 36: Global Military Robots Industry Revenue Million Forecast, by Price Trend Analysis 2019 & 2032
- Table 37: Global Military Robots Industry Revenue Million Forecast, by Country 2019 & 2032
- Table 38: United States Military Robots Industry Revenue (Million) Forecast, by Application 2019 & 2032
- Table 39: Canada Military Robots Industry Revenue (Million) Forecast, by Application 2019 & 2032
- Table 40: Mexico Military Robots Industry Revenue (Million) Forecast, by Application 2019 & 2032
- Table 41: Global Military Robots Industry Revenue Million Forecast, by Production Analysis 2019 & 2032
- Table 42: Global Military Robots Industry Revenue Million Forecast, by Consumption Analysis 2019 & 2032
- Table 43: Global Military Robots Industry Revenue Million Forecast, by Import Market Analysis (Value & Volume) 2019 & 2032
- Table 44: Global Military Robots Industry Revenue Million Forecast, by Export Market Analysis (Value & Volume) 2019 & 2032
- Table 45: Global Military Robots Industry Revenue Million Forecast, by Price Trend Analysis 2019 & 2032
- Table 46: Global Military Robots Industry Revenue Million Forecast, by Country 2019 & 2032
- Table 47: Brazil Military Robots Industry Revenue (Million) Forecast, by Application 2019 & 2032
- Table 48: Argentina Military Robots Industry Revenue (Million) Forecast, by Application 2019 & 2032
- Table 49: Rest of South America Military Robots Industry Revenue (Million) Forecast, by Application 2019 & 2032
- Table 50: Global Military Robots Industry Revenue Million Forecast, by Production Analysis 2019 & 2032
- Table 51: Global Military Robots Industry Revenue Million Forecast, by Consumption Analysis 2019 & 2032
- Table 52: Global Military Robots Industry Revenue Million Forecast, by Import Market Analysis (Value & Volume) 2019 & 2032
- Table 53: Global Military Robots Industry Revenue Million Forecast, by Export Market Analysis (Value & Volume) 2019 & 2032
- Table 54: Global Military Robots Industry Revenue Million Forecast, by Price Trend Analysis 2019 & 2032
- Table 55: Global Military Robots Industry Revenue Million Forecast, by Country 2019 & 2032
- Table 56: United Kingdom Military Robots Industry Revenue (Million) Forecast, by Application 2019 & 2032
- Table 57: Germany Military Robots Industry Revenue (Million) Forecast, by Application 2019 & 2032
- Table 58: France Military Robots Industry Revenue (Million) Forecast, by Application 2019 & 2032
- Table 59: Italy Military Robots Industry Revenue (Million) Forecast, by Application 2019 & 2032
- Table 60: Spain Military Robots Industry Revenue (Million) Forecast, by Application 2019 & 2032
- Table 61: Russia Military Robots Industry Revenue (Million) Forecast, by Application 2019 & 2032
- Table 62: Benelux Military Robots Industry Revenue (Million) Forecast, by Application 2019 & 2032
- Table 63: Nordics Military Robots Industry Revenue (Million) Forecast, by Application 2019 & 2032
- Table 64: Rest of Europe Military Robots Industry Revenue (Million) Forecast, by Application 2019 & 2032
- Table 65: Global Military Robots Industry Revenue Million Forecast, by Production Analysis 2019 & 2032
- Table 66: Global Military Robots Industry Revenue Million Forecast, by Consumption Analysis 2019 & 2032
- Table 67: Global Military Robots Industry Revenue Million Forecast, by Import Market Analysis (Value & Volume) 2019 & 2032
- Table 68: Global Military Robots Industry Revenue Million Forecast, by Export Market Analysis (Value & Volume) 2019 & 2032
- Table 69: Global Military Robots Industry Revenue Million Forecast, by Price Trend Analysis 2019 & 2032
- Table 70: Global Military Robots Industry Revenue Million Forecast, by Country 2019 & 2032
- Table 71: Turkey Military Robots Industry Revenue (Million) Forecast, by Application 2019 & 2032
- Table 72: Israel Military Robots Industry Revenue (Million) Forecast, by Application 2019 & 2032
- Table 73: GCC Military Robots Industry Revenue (Million) Forecast, by Application 2019 & 2032
- Table 74: North Africa Military Robots Industry Revenue (Million) Forecast, by Application 2019 & 2032
- Table 75: South Africa Military Robots Industry Revenue (Million) Forecast, by Application 2019 & 2032
- Table 76: Rest of Middle East & Africa Military Robots Industry Revenue (Million) Forecast, by Application 2019 & 2032
- Table 77: Global Military Robots Industry Revenue Million Forecast, by Production Analysis 2019 & 2032
- Table 78: Global Military Robots Industry Revenue Million Forecast, by Consumption Analysis 2019 & 2032
- Table 79: Global Military Robots Industry Revenue Million Forecast, by Import Market Analysis (Value & Volume) 2019 & 2032
- Table 80: Global Military Robots Industry Revenue Million Forecast, by Export Market Analysis (Value & Volume) 2019 & 2032
- Table 81: Global Military Robots Industry Revenue Million Forecast, by Price Trend Analysis 2019 & 2032
- Table 82: Global Military Robots Industry Revenue Million Forecast, by Country 2019 & 2032
- Table 83: China Military Robots Industry Revenue (Million) Forecast, by Application 2019 & 2032
- Table 84: India Military Robots Industry Revenue (Million) Forecast, by Application 2019 & 2032
- Table 85: Japan Military Robots Industry Revenue (Million) Forecast, by Application 2019 & 2032
- Table 86: South Korea Military Robots Industry Revenue (Million) Forecast, by Application 2019 & 2032
- Table 87: ASEAN Military Robots Industry Revenue (Million) Forecast, by Application 2019 & 2032
- Table 88: Oceania Military Robots Industry Revenue (Million) Forecast, by Application 2019 & 2032
- Table 89: Rest of Asia Pacific Military Robots Industry Revenue (Million) Forecast, by Application 2019 & 2032
Frequently Asked Questions
1. What is the projected Compound Annual Growth Rate (CAGR) of the Military Robots Industry?
The projected CAGR is approximately 6.97%.
2. Which companies are prominent players in the Military Robots Industry?
Key companies in the market include Textron Inc, THALES, General Dynamics Corporation, BAYKAR, Elbit Systems Ltd, Lockheed Martin Corporation, QinetiQ Group PLC, Cobham Ltd, AeroVironment Inc, IAI, Aeronautics Ltd, BAE Systems plc, Northrop Grumman Corporation, Saab AB, Teledyne FLIR LLC.
3. What are the main segments of the Military Robots Industry?
The market segments include Production Analysis, Consumption Analysis, Import Market Analysis (Value & Volume), Export Market Analysis (Value & Volume), Price Trend Analysis.
4. Can you provide details about the market size?
The market size is estimated to be USD 24.37 Million as of 2022.
5. What are some drivers contributing to market growth?
; Increasing Number Of Air Passengers; Use Of Portable Electronic Devices.
6. What are the notable trends driving market growth?
Land Segment Anticipated to Generate Highest Growth During the Forecast Period.
7. Are there any restraints impacting market growth?
; High Cost Of Connectivity Equipments.
8. Can you provide examples of recent developments in the market?
October 2023: The US Army is reportedly developing integrated formations of robots and human operators as part of the modernization efforts. The US Army’s Rapid Capabilities and Critical Technologies Office (RCCTO) plans to use existing science and technology as well as information from fielded programs to figure out how to combine capabilities to maximize coordination on the battlefield.
9. What pricing options are available for accessing the report?
Pricing options include single-user, multi-user, and enterprise licenses priced at USD 4750, USD 5250, and USD 8750 respectively.
10. Is the market size provided in terms of value or volume?
The market size is provided in terms of value, measured in Million.
11. Are there any specific market keywords associated with the report?
Yes, the market keyword associated with the report is "Military Robots Industry," which aids in identifying and referencing the specific market segment covered.
12. How do I determine which pricing option suits my needs best?
The pricing options vary based on user requirements and access needs. Individual users may opt for single-user licenses, while businesses requiring broader access may choose multi-user or enterprise licenses for cost-effective access to the report.
13. Are there any additional resources or data provided in the Military Robots Industry report?
While the report offers comprehensive insights, it's advisable to review the specific contents or supplementary materials provided to ascertain if additional resources or data are available.
14. How can I stay updated on further developments or reports in the Military Robots Industry?
To stay informed about further developments, trends, and reports in the Military Robots Industry, consider subscribing to industry newsletters, following relevant companies and organizations, or regularly checking reputable industry news sources and publications.
Methodology
Step 1 - Identification of Relevant Samples Size from Population Database


Step 2 - Approaches for Defining Global Market Size (Value, Volume* & Price*)

Note*: In applicable scenarios
Step 3 - Data Sources
Primary Research
- Web Analytics
- Survey Reports
- Research Institute
- Latest Research Reports
- Opinion Leaders
Secondary Research
- Annual Reports
- White Paper
- Latest Press Release
- Industry Association
- Paid Database
- Investor Presentations

Step 4 - Data Triangulation
Involves using different sources of information in order to increase the validity of a study
These sources are likely to be stakeholders in a program - participants, other researchers, program staff, other community members, and so on.
Then we put all data in single framework & apply various statistical tools to find out the dynamic on the market.
During the analysis stage, feedback from the stakeholder groups would be compared to determine areas of agreement as well as areas of divergence
