

Key Insights
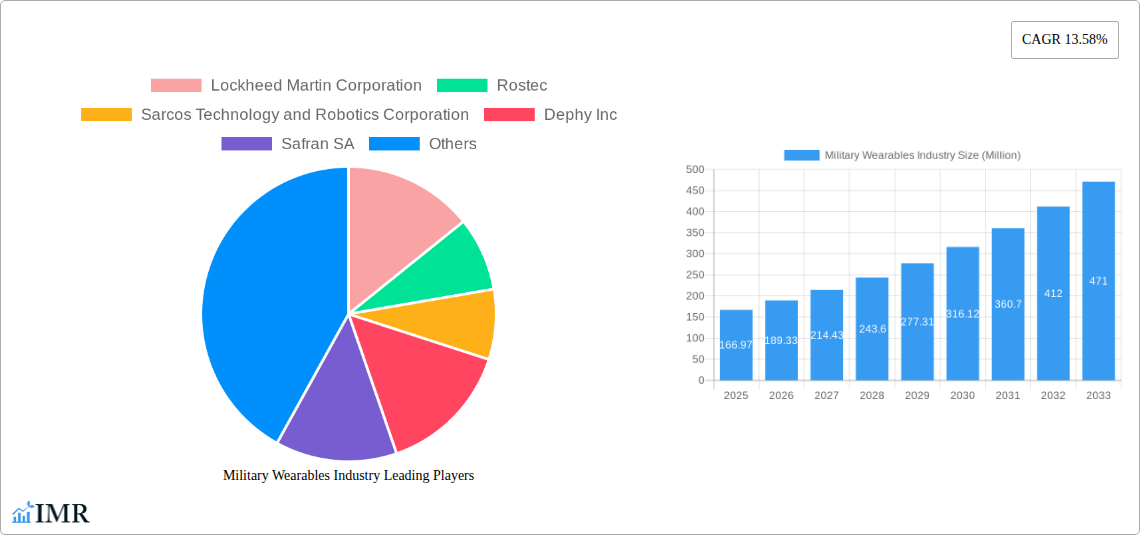
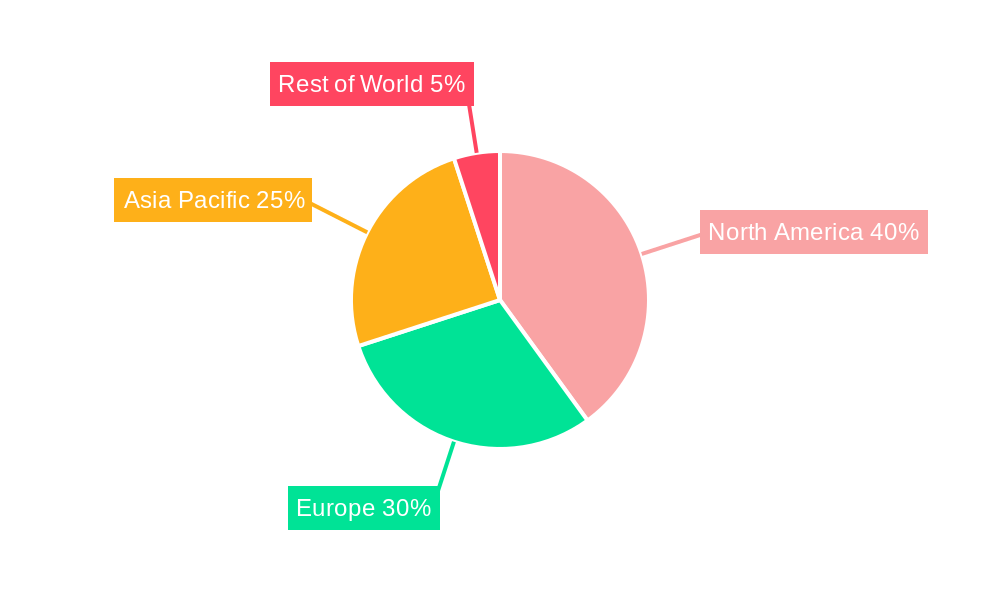
The military wearables market, valued at $166.97 million in 2025, is projected to experience robust growth, driven by a compound annual growth rate (CAGR) of 13.58% from 2025 to 2033. This expansion is fueled by several key factors. Firstly, increasing demand for enhanced soldier capabilities, including improved situational awareness, communication, and physical protection, is a significant driver. Technological advancements in areas such as lightweight materials, miniaturized sensors, and advanced power sources are continuously improving the functionality and practicality of military wearables. Furthermore, the integration of artificial intelligence (AI) and machine learning (ML) is enhancing the analytical capabilities of these devices, enabling real-time data processing and improved decision-making on the battlefield. The market segmentation reveals a preference for full-body exoskeletons due to their comprehensive protective and performance-enhancing capabilities, while active exoskeletons, providing powered assistance, are gaining popularity over passive counterparts. Geographic distribution shows strong growth potential across North America and the Asia-Pacific region, driven by significant military investments and technological advancements in these areas.
The competitive landscape is characterized by a mix of established defense contractors like Lockheed Martin and BAE Systems, alongside specialized robotics companies like Sarcos Technology and Robotics. This competition fosters innovation and drives down costs, making military wearables more accessible to various military branches and allied forces globally. However, challenges remain, including high initial investment costs, the need for robust and reliable power sources, and concerns regarding the potential impact of wearables on soldier comfort and physical limitations. Ongoing research and development efforts are focused on addressing these challenges, paving the way for more sophisticated, user-friendly, and effective military wearable technologies in the coming years. The market's continued growth trajectory hinges on successful integration of advanced technologies and addressing the aforementioned challenges to ensure widespread adoption and utilization within military operations.
Military Wearables Market: A Comprehensive Report (2019-2033)
This in-depth report provides a comprehensive analysis of the Military Wearables market, encompassing market dynamics, growth trends, regional analysis, product landscape, and key player profiles. The study period covers 2019-2033, with 2025 as the base and estimated year. The report leverages extensive data and expert insights to offer valuable intelligence for industry professionals, investors, and strategic decision-makers. The market is segmented by Type (Full-body Exoskeleton, Partial-body Exoskeleton) and Power (Active Exoskeleton, Passive Exoskeleton).
Military Wearables Industry Market Dynamics & Structure
The military wearables market, a dynamic sub-segment of the broader defense technology sector, is characterized by a moderately concentrated landscape with key players vying for market share. Technological innovation, particularly in areas like advanced materials, sensor integration, and AI-powered control systems, is a crucial driver. Stringent regulatory frameworks concerning safety, reliability, and interoperability influence market development. The market also faces competitive pressure from substitute technologies, including traditional load-bearing equipment. End-user demographics, primarily encompassing military personnel across various ranks and specializations, shape product demand. M&A activity, while not exceptionally high, plays a role in consolidating market position and accelerating technological integration.
- Market Concentration: Moderately concentrated, with top 5 players holding approximately xx% market share in 2025.
- Technological Innovation: Focus on improved power efficiency, enhanced ergonomics, and advanced sensor integration.
- Regulatory Landscape: Stringent safety and performance standards govern product development and deployment.
- Competitive Substitutes: Traditional load-carrying equipment and alternative assistive devices create competitive pressure.
- M&A Activity: xx major M&A deals recorded between 2019 and 2024, primarily focused on technology acquisition and market expansion.
- Innovation Barriers: High R&D costs, stringent testing requirements, and the need for military-grade durability.
Military Wearables Industry Growth Trends & Insights
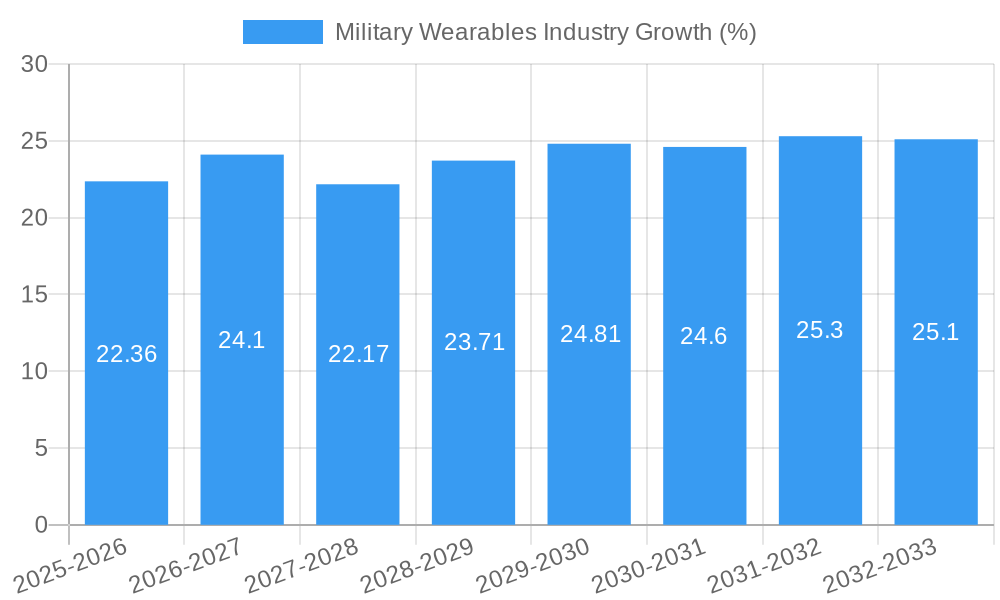
The military wearables market is experiencing robust growth, driven by increasing demand for enhanced soldier capabilities and improved operational efficiency. The market size expanded from xx million units in 2019 to xx million units in 2024, exhibiting a CAGR of xx% during this period. The adoption rate is projected to accelerate further, reaching xx million units by 2033, fueled by technological advancements in exoskeleton design, improved power management, and increased government investments in defense modernization programs. Technological disruptions such as the integration of AI and advanced sensors are enhancing the functionalities of military wearables, leading to improved situational awareness, communication, and physical augmentation for soldiers.
- Market Size (Million Units): 2019 (xx), 2024 (xx), 2025 (xx), 2033 (xx)
- CAGR (2019-2024): xx%
- CAGR (2025-2033): xx%
- Market Penetration: xx% in 2024, projected to reach xx% by 2033.
Dominant Regions, Countries, or Segments in Military Wearables Industry
The North American region, particularly the United States, currently dominates the military wearables market, driven by substantial defense budgets, advanced technological capabilities, and strong government support for defense innovation. Within the segment breakdown, the full-body exoskeleton segment holds a larger market share compared to partial-body exoskeletons due to its comprehensive support and enhanced capabilities. Similarly, active exoskeletons, offering superior power and assistance, hold a larger market share than passive exoskeletons.
- Leading Region: North America (Market share: xx% in 2025)
- Leading Country: United States (Market share: xx% of North American market in 2025)
- Leading Type: Full-body Exoskeletons (Market share: xx% in 2025)
- Leading Power: Active Exoskeletons (Market share: xx% in 2025)
- Key Drivers (North America): High defense spending, strong technological infrastructure, proactive government policies supporting defense R&D.
Military Wearables Industry Product Landscape
Military wearables are characterized by robust design, advanced material usage (e.g., lightweight composites, durable alloys), and sophisticated sensor integration. Applications range from load-bearing assistance to enhanced mobility and improved situational awareness through integrated communication and sensor data display. Key performance metrics include weight, power efficiency, operational range, and environmental resilience. Unique selling propositions focus on user comfort, durability, and seamless integration with existing military equipment. Recent innovations involve AI-powered control systems, advanced ergonomics, and miniaturization of components for enhanced usability and decreased weight.
Key Drivers, Barriers & Challenges in Military Wearables Industry
Key Drivers:
- Increasing defense budgets globally.
- Technological advancements leading to enhanced functionality and reduced weight/size.
- Demand for improved soldier capabilities in various operational environments.
- Growing focus on soldier welfare and reduction of musculoskeletal injuries.
Key Challenges and Restraints:
- High R&D and manufacturing costs.
- Stringent testing and certification requirements.
- Supply chain disruptions impacting component availability.
- Concerns regarding battery life, durability, and environmental limitations.
- xx% of companies reported supply chain disruptions in 2024, impacting production timelines.
Emerging Opportunities in Military Wearables Industry
Emerging opportunities include expansion into new military applications (e.g., enhanced surgical capabilities in field hospitals, advanced rehabilitation tools), integration with other military technologies (e.g., drones, autonomous vehicles), and development of specialized exoskeletons for specific military roles (e.g., bomb disposal, search and rescue). The development of lighter, more powerful and longer lasting batteries and increased focus on human-machine interface improvements remain key for future growth.
Growth Accelerators in the Military Wearables Industry
Technological breakthroughs in areas like energy storage, materials science, and AI-driven control systems are accelerating market growth. Strategic partnerships between defense contractors and technology companies are facilitating innovation and accelerating product development cycles. Market expansion strategies, including targeting new geographic markets and diversifying applications, are creating further growth opportunities.
Key Players Shaping the Military Wearables Industry Market
- Lockheed Martin Corporation
- Rostec
- Sarcos Technology and Robotics Corporation
- Dephy Inc
- Safran SA
- ASELSAN A.Ş.
- Mawashi Science & Technology
- SRI International
- BAE Systems plc
- Bionic Power Inc
Notable Milestones in Military Wearables Industry Sector
- September 2023: NCSIST unveils a new powered exoskeleton for wartime and disaster relief.
- August 2022: DEVCOM funds HeroWear and Vanderbilt University for SABER exoskeleton development.
- October 2021: Taiwan unveils a locally-made powered exoskeleton suit.
In-Depth Military Wearables Industry Market Outlook
The future of the military wearables market looks bright, characterized by sustained growth driven by technological advancements and increasing military budgets. Strategic opportunities include focusing on developing lightweight, energy-efficient designs, exploring new functionalities (e.g., augmented reality integration), and strengthening partnerships within the defense ecosystem. The market is poised to witness a significant expansion in the coming years, offering substantial potential for companies and investors strategically positioned within this emerging sector.
Military Wearables Industry Segmentation
- 1. Production Analysis
- 2. Consumption Analysis
- 3. Import Market Analysis (Value & Volume)
- 4. Export Market Analysis (Value & Volume)
- 5. Price Trend Analysis
Military Wearables Industry Segmentation By Geography
-
1. North America
- 1.1. United States
- 1.2. Canada
- 1.3. Mexico
-
2. South America
- 2.1. Brazil
- 2.2. Argentina
- 2.3. Rest of South America
-
3. Europe
- 3.1. United Kingdom
- 3.2. Germany
- 3.3. France
- 3.4. Italy
- 3.5. Spain
- 3.6. Russia
- 3.7. Benelux
- 3.8. Nordics
- 3.9. Rest of Europe
-
4. Middle East & Africa
- 4.1. Turkey
- 4.2. Israel
- 4.3. GCC
- 4.4. North Africa
- 4.5. South Africa
- 4.6. Rest of Middle East & Africa
-
5. Asia Pacific
- 5.1. China
- 5.2. India
- 5.3. Japan
- 5.4. South Korea
- 5.5. ASEAN
- 5.6. Oceania
- 5.7. Rest of Asia Pacific
Military Wearables Industry REPORT HIGHLIGHTS
| Aspects | Details |
|---|---|
| Study Period | 2019-2033 |
| Base Year | 2024 |
| Estimated Year | 2025 |
| Forecast Period | 2025-2033 |
| Historical Period | 2019-2024 |
| Growth Rate | CAGR of 13.58% from 2019-2033 |
| Segmentation |
|
Table of Contents
- 1. Introduction
- 1.1. Research Scope
- 1.2. Market Segmentation
- 1.3. Research Methodology
- 1.4. Definitions and Assumptions
- 2. Executive Summary
- 2.1. Introduction
- 3. Market Dynamics
- 3.1. Introduction
- 3.2. Market Drivers
- 3.3. Market Restrains
- 3.4. Market Trends
- 3.4.1. The Active Exoskeleton Segment is Expected to Witness the Highest Growth During the Forecast Period
- 4. Market Factor Analysis
- 4.1. Porters Five Forces
- 4.2. Supply/Value Chain
- 4.3. PESTEL analysis
- 4.4. Market Entropy
- 4.5. Patent/Trademark Analysis
- 5. Global Military Wearables Industry Analysis, Insights and Forecast, 2019-2031
- 5.1. Market Analysis, Insights and Forecast - by Production Analysis
- 5.2. Market Analysis, Insights and Forecast - by Consumption Analysis
- 5.3. Market Analysis, Insights and Forecast - by Import Market Analysis (Value & Volume)
- 5.4. Market Analysis, Insights and Forecast - by Export Market Analysis (Value & Volume)
- 5.5. Market Analysis, Insights and Forecast - by Price Trend Analysis
- 5.6. Market Analysis, Insights and Forecast - by Region
- 5.6.1. North America
- 5.6.2. South America
- 5.6.3. Europe
- 5.6.4. Middle East & Africa
- 5.6.5. Asia Pacific
- 5.1. Market Analysis, Insights and Forecast - by Production Analysis
- 6. North America Military Wearables Industry Analysis, Insights and Forecast, 2019-2031
- 6.1. Market Analysis, Insights and Forecast - by Production Analysis
- 6.2. Market Analysis, Insights and Forecast - by Consumption Analysis
- 6.3. Market Analysis, Insights and Forecast - by Import Market Analysis (Value & Volume)
- 6.4. Market Analysis, Insights and Forecast - by Export Market Analysis (Value & Volume)
- 6.5. Market Analysis, Insights and Forecast - by Price Trend Analysis
- 6.1. Market Analysis, Insights and Forecast - by Production Analysis
- 7. South America Military Wearables Industry Analysis, Insights and Forecast, 2019-2031
- 7.1. Market Analysis, Insights and Forecast - by Production Analysis
- 7.2. Market Analysis, Insights and Forecast - by Consumption Analysis
- 7.3. Market Analysis, Insights and Forecast - by Import Market Analysis (Value & Volume)
- 7.4. Market Analysis, Insights and Forecast - by Export Market Analysis (Value & Volume)
- 7.5. Market Analysis, Insights and Forecast - by Price Trend Analysis
- 7.1. Market Analysis, Insights and Forecast - by Production Analysis
- 8. Europe Military Wearables Industry Analysis, Insights and Forecast, 2019-2031
- 8.1. Market Analysis, Insights and Forecast - by Production Analysis
- 8.2. Market Analysis, Insights and Forecast - by Consumption Analysis
- 8.3. Market Analysis, Insights and Forecast - by Import Market Analysis (Value & Volume)
- 8.4. Market Analysis, Insights and Forecast - by Export Market Analysis (Value & Volume)
- 8.5. Market Analysis, Insights and Forecast - by Price Trend Analysis
- 8.1. Market Analysis, Insights and Forecast - by Production Analysis
- 9. Middle East & Africa Military Wearables Industry Analysis, Insights and Forecast, 2019-2031
- 9.1. Market Analysis, Insights and Forecast - by Production Analysis
- 9.2. Market Analysis, Insights and Forecast - by Consumption Analysis
- 9.3. Market Analysis, Insights and Forecast - by Import Market Analysis (Value & Volume)
- 9.4. Market Analysis, Insights and Forecast - by Export Market Analysis (Value & Volume)
- 9.5. Market Analysis, Insights and Forecast - by Price Trend Analysis
- 9.1. Market Analysis, Insights and Forecast - by Production Analysis
- 10. Asia Pacific Military Wearables Industry Analysis, Insights and Forecast, 2019-2031
- 10.1. Market Analysis, Insights and Forecast - by Production Analysis
- 10.2. Market Analysis, Insights and Forecast - by Consumption Analysis
- 10.3. Market Analysis, Insights and Forecast - by Import Market Analysis (Value & Volume)
- 10.4. Market Analysis, Insights and Forecast - by Export Market Analysis (Value & Volume)
- 10.5. Market Analysis, Insights and Forecast - by Price Trend Analysis
- 10.1. Market Analysis, Insights and Forecast - by Production Analysis
- 11. North America Military Wearables Industry Analysis, Insights and Forecast, 2019-2031
- 11.1. Market Analysis, Insights and Forecast - By Country/Sub-region
- 11.1.1 United States
- 11.1.2 Canada
- 12. Europe Military Wearables Industry Analysis, Insights and Forecast, 2019-2031
- 12.1. Market Analysis, Insights and Forecast - By Country/Sub-region
- 12.1.1 United Kingdom
- 12.1.2 France
- 12.1.3 Germany
- 12.1.4 Russia
- 12.1.5 Rest of Europe
- 13. Asia Pacific Military Wearables Industry Analysis, Insights and Forecast, 2019-2031
- 13.1. Market Analysis, Insights and Forecast - By Country/Sub-region
- 13.1.1 China
- 13.1.2 India
- 13.1.3 Japan
- 13.1.4 South Korea
- 13.1.5 Rest of Asia Pacific
- 14. Rest of the World Military Wearables Industry Analysis, Insights and Forecast, 2019-2031
- 14.1. Market Analysis, Insights and Forecast - By Country/Sub-region
- 14.1.1.
- 15. Competitive Analysis
- 15.1. Global Market Share Analysis 2024
- 15.2. Company Profiles
- 15.2.1 Lockheed Martin Corporation
- 15.2.1.1. Overview
- 15.2.1.2. Products
- 15.2.1.3. SWOT Analysis
- 15.2.1.4. Recent Developments
- 15.2.1.5. Financials (Based on Availability)
- 15.2.2 Rostec
- 15.2.2.1. Overview
- 15.2.2.2. Products
- 15.2.2.3. SWOT Analysis
- 15.2.2.4. Recent Developments
- 15.2.2.5. Financials (Based on Availability)
- 15.2.3 Sarcos Technology and Robotics Corporation
- 15.2.3.1. Overview
- 15.2.3.2. Products
- 15.2.3.3. SWOT Analysis
- 15.2.3.4. Recent Developments
- 15.2.3.5. Financials (Based on Availability)
- 15.2.4 Dephy Inc
- 15.2.4.1. Overview
- 15.2.4.2. Products
- 15.2.4.3. SWOT Analysis
- 15.2.4.4. Recent Developments
- 15.2.4.5. Financials (Based on Availability)
- 15.2.5 Safran SA
- 15.2.5.1. Overview
- 15.2.5.2. Products
- 15.2.5.3. SWOT Analysis
- 15.2.5.4. Recent Developments
- 15.2.5.5. Financials (Based on Availability)
- 15.2.6 ASELSAN A S
- 15.2.6.1. Overview
- 15.2.6.2. Products
- 15.2.6.3. SWOT Analysis
- 15.2.6.4. Recent Developments
- 15.2.6.5. Financials (Based on Availability)
- 15.2.7 Mawashi Science & Technology
- 15.2.7.1. Overview
- 15.2.7.2. Products
- 15.2.7.3. SWOT Analysis
- 15.2.7.4. Recent Developments
- 15.2.7.5. Financials (Based on Availability)
- 15.2.8 SRI Internationa
- 15.2.8.1. Overview
- 15.2.8.2. Products
- 15.2.8.3. SWOT Analysis
- 15.2.8.4. Recent Developments
- 15.2.8.5. Financials (Based on Availability)
- 15.2.9 BAE Systems plc
- 15.2.9.1. Overview
- 15.2.9.2. Products
- 15.2.9.3. SWOT Analysis
- 15.2.9.4. Recent Developments
- 15.2.9.5. Financials (Based on Availability)
- 15.2.10 Bionic Power Inc
- 15.2.10.1. Overview
- 15.2.10.2. Products
- 15.2.10.3. SWOT Analysis
- 15.2.10.4. Recent Developments
- 15.2.10.5. Financials (Based on Availability)
- 15.2.1 Lockheed Martin Corporation
List of Figures
- Figure 1: Global Military Wearables Industry Revenue Breakdown (Million, %) by Region 2024 & 2032
- Figure 2: North America Military Wearables Industry Revenue (Million), by Country 2024 & 2032
- Figure 3: North America Military Wearables Industry Revenue Share (%), by Country 2024 & 2032
- Figure 4: Europe Military Wearables Industry Revenue (Million), by Country 2024 & 2032
- Figure 5: Europe Military Wearables Industry Revenue Share (%), by Country 2024 & 2032
- Figure 6: Asia Pacific Military Wearables Industry Revenue (Million), by Country 2024 & 2032
- Figure 7: Asia Pacific Military Wearables Industry Revenue Share (%), by Country 2024 & 2032
- Figure 8: Rest of the World Military Wearables Industry Revenue (Million), by Country 2024 & 2032
- Figure 9: Rest of the World Military Wearables Industry Revenue Share (%), by Country 2024 & 2032
- Figure 10: North America Military Wearables Industry Revenue (Million), by Production Analysis 2024 & 2032
- Figure 11: North America Military Wearables Industry Revenue Share (%), by Production Analysis 2024 & 2032
- Figure 12: North America Military Wearables Industry Revenue (Million), by Consumption Analysis 2024 & 2032
- Figure 13: North America Military Wearables Industry Revenue Share (%), by Consumption Analysis 2024 & 2032
- Figure 14: North America Military Wearables Industry Revenue (Million), by Import Market Analysis (Value & Volume) 2024 & 2032
- Figure 15: North America Military Wearables Industry Revenue Share (%), by Import Market Analysis (Value & Volume) 2024 & 2032
- Figure 16: North America Military Wearables Industry Revenue (Million), by Export Market Analysis (Value & Volume) 2024 & 2032
- Figure 17: North America Military Wearables Industry Revenue Share (%), by Export Market Analysis (Value & Volume) 2024 & 2032
- Figure 18: North America Military Wearables Industry Revenue (Million), by Price Trend Analysis 2024 & 2032
- Figure 19: North America Military Wearables Industry Revenue Share (%), by Price Trend Analysis 2024 & 2032
- Figure 20: North America Military Wearables Industry Revenue (Million), by Country 2024 & 2032
- Figure 21: North America Military Wearables Industry Revenue Share (%), by Country 2024 & 2032
- Figure 22: South America Military Wearables Industry Revenue (Million), by Production Analysis 2024 & 2032
- Figure 23: South America Military Wearables Industry Revenue Share (%), by Production Analysis 2024 & 2032
- Figure 24: South America Military Wearables Industry Revenue (Million), by Consumption Analysis 2024 & 2032
- Figure 25: South America Military Wearables Industry Revenue Share (%), by Consumption Analysis 2024 & 2032
- Figure 26: South America Military Wearables Industry Revenue (Million), by Import Market Analysis (Value & Volume) 2024 & 2032
- Figure 27: South America Military Wearables Industry Revenue Share (%), by Import Market Analysis (Value & Volume) 2024 & 2032
- Figure 28: South America Military Wearables Industry Revenue (Million), by Export Market Analysis (Value & Volume) 2024 & 2032
- Figure 29: South America Military Wearables Industry Revenue Share (%), by Export Market Analysis (Value & Volume) 2024 & 2032
- Figure 30: South America Military Wearables Industry Revenue (Million), by Price Trend Analysis 2024 & 2032
- Figure 31: South America Military Wearables Industry Revenue Share (%), by Price Trend Analysis 2024 & 2032
- Figure 32: South America Military Wearables Industry Revenue (Million), by Country 2024 & 2032
- Figure 33: South America Military Wearables Industry Revenue Share (%), by Country 2024 & 2032
- Figure 34: Europe Military Wearables Industry Revenue (Million), by Production Analysis 2024 & 2032
- Figure 35: Europe Military Wearables Industry Revenue Share (%), by Production Analysis 2024 & 2032
- Figure 36: Europe Military Wearables Industry Revenue (Million), by Consumption Analysis 2024 & 2032
- Figure 37: Europe Military Wearables Industry Revenue Share (%), by Consumption Analysis 2024 & 2032
- Figure 38: Europe Military Wearables Industry Revenue (Million), by Import Market Analysis (Value & Volume) 2024 & 2032
- Figure 39: Europe Military Wearables Industry Revenue Share (%), by Import Market Analysis (Value & Volume) 2024 & 2032
- Figure 40: Europe Military Wearables Industry Revenue (Million), by Export Market Analysis (Value & Volume) 2024 & 2032
- Figure 41: Europe Military Wearables Industry Revenue Share (%), by Export Market Analysis (Value & Volume) 2024 & 2032
- Figure 42: Europe Military Wearables Industry Revenue (Million), by Price Trend Analysis 2024 & 2032
- Figure 43: Europe Military Wearables Industry Revenue Share (%), by Price Trend Analysis 2024 & 2032
- Figure 44: Europe Military Wearables Industry Revenue (Million), by Country 2024 & 2032
- Figure 45: Europe Military Wearables Industry Revenue Share (%), by Country 2024 & 2032
- Figure 46: Middle East & Africa Military Wearables Industry Revenue (Million), by Production Analysis 2024 & 2032
- Figure 47: Middle East & Africa Military Wearables Industry Revenue Share (%), by Production Analysis 2024 & 2032
- Figure 48: Middle East & Africa Military Wearables Industry Revenue (Million), by Consumption Analysis 2024 & 2032
- Figure 49: Middle East & Africa Military Wearables Industry Revenue Share (%), by Consumption Analysis 2024 & 2032
- Figure 50: Middle East & Africa Military Wearables Industry Revenue (Million), by Import Market Analysis (Value & Volume) 2024 & 2032
- Figure 51: Middle East & Africa Military Wearables Industry Revenue Share (%), by Import Market Analysis (Value & Volume) 2024 & 2032
- Figure 52: Middle East & Africa Military Wearables Industry Revenue (Million), by Export Market Analysis (Value & Volume) 2024 & 2032
- Figure 53: Middle East & Africa Military Wearables Industry Revenue Share (%), by Export Market Analysis (Value & Volume) 2024 & 2032
- Figure 54: Middle East & Africa Military Wearables Industry Revenue (Million), by Price Trend Analysis 2024 & 2032
- Figure 55: Middle East & Africa Military Wearables Industry Revenue Share (%), by Price Trend Analysis 2024 & 2032
- Figure 56: Middle East & Africa Military Wearables Industry Revenue (Million), by Country 2024 & 2032
- Figure 57: Middle East & Africa Military Wearables Industry Revenue Share (%), by Country 2024 & 2032
- Figure 58: Asia Pacific Military Wearables Industry Revenue (Million), by Production Analysis 2024 & 2032
- Figure 59: Asia Pacific Military Wearables Industry Revenue Share (%), by Production Analysis 2024 & 2032
- Figure 60: Asia Pacific Military Wearables Industry Revenue (Million), by Consumption Analysis 2024 & 2032
- Figure 61: Asia Pacific Military Wearables Industry Revenue Share (%), by Consumption Analysis 2024 & 2032
- Figure 62: Asia Pacific Military Wearables Industry Revenue (Million), by Import Market Analysis (Value & Volume) 2024 & 2032
- Figure 63: Asia Pacific Military Wearables Industry Revenue Share (%), by Import Market Analysis (Value & Volume) 2024 & 2032
- Figure 64: Asia Pacific Military Wearables Industry Revenue (Million), by Export Market Analysis (Value & Volume) 2024 & 2032
- Figure 65: Asia Pacific Military Wearables Industry Revenue Share (%), by Export Market Analysis (Value & Volume) 2024 & 2032
- Figure 66: Asia Pacific Military Wearables Industry Revenue (Million), by Price Trend Analysis 2024 & 2032
- Figure 67: Asia Pacific Military Wearables Industry Revenue Share (%), by Price Trend Analysis 2024 & 2032
- Figure 68: Asia Pacific Military Wearables Industry Revenue (Million), by Country 2024 & 2032
- Figure 69: Asia Pacific Military Wearables Industry Revenue Share (%), by Country 2024 & 2032
List of Tables
- Table 1: Global Military Wearables Industry Revenue Million Forecast, by Region 2019 & 2032
- Table 2: Global Military Wearables Industry Revenue Million Forecast, by Production Analysis 2019 & 2032
- Table 3: Global Military Wearables Industry Revenue Million Forecast, by Consumption Analysis 2019 & 2032
- Table 4: Global Military Wearables Industry Revenue Million Forecast, by Import Market Analysis (Value & Volume) 2019 & 2032
- Table 5: Global Military Wearables Industry Revenue Million Forecast, by Export Market Analysis (Value & Volume) 2019 & 2032
- Table 6: Global Military Wearables Industry Revenue Million Forecast, by Price Trend Analysis 2019 & 2032
- Table 7: Global Military Wearables Industry Revenue Million Forecast, by Region 2019 & 2032
- Table 8: Global Military Wearables Industry Revenue Million Forecast, by Country 2019 & 2032
- Table 9: United States Military Wearables Industry Revenue (Million) Forecast, by Application 2019 & 2032
- Table 10: Canada Military Wearables Industry Revenue (Million) Forecast, by Application 2019 & 2032
- Table 11: Global Military Wearables Industry Revenue Million Forecast, by Country 2019 & 2032
- Table 12: United Kingdom Military Wearables Industry Revenue (Million) Forecast, by Application 2019 & 2032
- Table 13: France Military Wearables Industry Revenue (Million) Forecast, by Application 2019 & 2032
- Table 14: Germany Military Wearables Industry Revenue (Million) Forecast, by Application 2019 & 2032
- Table 15: Russia Military Wearables Industry Revenue (Million) Forecast, by Application 2019 & 2032
- Table 16: Rest of Europe Military Wearables Industry Revenue (Million) Forecast, by Application 2019 & 2032
- Table 17: Global Military Wearables Industry Revenue Million Forecast, by Country 2019 & 2032
- Table 18: China Military Wearables Industry Revenue (Million) Forecast, by Application 2019 & 2032
- Table 19: India Military Wearables Industry Revenue (Million) Forecast, by Application 2019 & 2032
- Table 20: Japan Military Wearables Industry Revenue (Million) Forecast, by Application 2019 & 2032
- Table 21: South Korea Military Wearables Industry Revenue (Million) Forecast, by Application 2019 & 2032
- Table 22: Rest of Asia Pacific Military Wearables Industry Revenue (Million) Forecast, by Application 2019 & 2032
- Table 23: Global Military Wearables Industry Revenue Million Forecast, by Country 2019 & 2032
- Table 24: Military Wearables Industry Revenue (Million) Forecast, by Application 2019 & 2032
- Table 25: Global Military Wearables Industry Revenue Million Forecast, by Production Analysis 2019 & 2032
- Table 26: Global Military Wearables Industry Revenue Million Forecast, by Consumption Analysis 2019 & 2032
- Table 27: Global Military Wearables Industry Revenue Million Forecast, by Import Market Analysis (Value & Volume) 2019 & 2032
- Table 28: Global Military Wearables Industry Revenue Million Forecast, by Export Market Analysis (Value & Volume) 2019 & 2032
- Table 29: Global Military Wearables Industry Revenue Million Forecast, by Price Trend Analysis 2019 & 2032
- Table 30: Global Military Wearables Industry Revenue Million Forecast, by Country 2019 & 2032
- Table 31: United States Military Wearables Industry Revenue (Million) Forecast, by Application 2019 & 2032
- Table 32: Canada Military Wearables Industry Revenue (Million) Forecast, by Application 2019 & 2032
- Table 33: Mexico Military Wearables Industry Revenue (Million) Forecast, by Application 2019 & 2032
- Table 34: Global Military Wearables Industry Revenue Million Forecast, by Production Analysis 2019 & 2032
- Table 35: Global Military Wearables Industry Revenue Million Forecast, by Consumption Analysis 2019 & 2032
- Table 36: Global Military Wearables Industry Revenue Million Forecast, by Import Market Analysis (Value & Volume) 2019 & 2032
- Table 37: Global Military Wearables Industry Revenue Million Forecast, by Export Market Analysis (Value & Volume) 2019 & 2032
- Table 38: Global Military Wearables Industry Revenue Million Forecast, by Price Trend Analysis 2019 & 2032
- Table 39: Global Military Wearables Industry Revenue Million Forecast, by Country 2019 & 2032
- Table 40: Brazil Military Wearables Industry Revenue (Million) Forecast, by Application 2019 & 2032
- Table 41: Argentina Military Wearables Industry Revenue (Million) Forecast, by Application 2019 & 2032
- Table 42: Rest of South America Military Wearables Industry Revenue (Million) Forecast, by Application 2019 & 2032
- Table 43: Global Military Wearables Industry Revenue Million Forecast, by Production Analysis 2019 & 2032
- Table 44: Global Military Wearables Industry Revenue Million Forecast, by Consumption Analysis 2019 & 2032
- Table 45: Global Military Wearables Industry Revenue Million Forecast, by Import Market Analysis (Value & Volume) 2019 & 2032
- Table 46: Global Military Wearables Industry Revenue Million Forecast, by Export Market Analysis (Value & Volume) 2019 & 2032
- Table 47: Global Military Wearables Industry Revenue Million Forecast, by Price Trend Analysis 2019 & 2032
- Table 48: Global Military Wearables Industry Revenue Million Forecast, by Country 2019 & 2032
- Table 49: United Kingdom Military Wearables Industry Revenue (Million) Forecast, by Application 2019 & 2032
- Table 50: Germany Military Wearables Industry Revenue (Million) Forecast, by Application 2019 & 2032
- Table 51: France Military Wearables Industry Revenue (Million) Forecast, by Application 2019 & 2032
- Table 52: Italy Military Wearables Industry Revenue (Million) Forecast, by Application 2019 & 2032
- Table 53: Spain Military Wearables Industry Revenue (Million) Forecast, by Application 2019 & 2032
- Table 54: Russia Military Wearables Industry Revenue (Million) Forecast, by Application 2019 & 2032
- Table 55: Benelux Military Wearables Industry Revenue (Million) Forecast, by Application 2019 & 2032
- Table 56: Nordics Military Wearables Industry Revenue (Million) Forecast, by Application 2019 & 2032
- Table 57: Rest of Europe Military Wearables Industry Revenue (Million) Forecast, by Application 2019 & 2032
- Table 58: Global Military Wearables Industry Revenue Million Forecast, by Production Analysis 2019 & 2032
- Table 59: Global Military Wearables Industry Revenue Million Forecast, by Consumption Analysis 2019 & 2032
- Table 60: Global Military Wearables Industry Revenue Million Forecast, by Import Market Analysis (Value & Volume) 2019 & 2032
- Table 61: Global Military Wearables Industry Revenue Million Forecast, by Export Market Analysis (Value & Volume) 2019 & 2032
- Table 62: Global Military Wearables Industry Revenue Million Forecast, by Price Trend Analysis 2019 & 2032
- Table 63: Global Military Wearables Industry Revenue Million Forecast, by Country 2019 & 2032
- Table 64: Turkey Military Wearables Industry Revenue (Million) Forecast, by Application 2019 & 2032
- Table 65: Israel Military Wearables Industry Revenue (Million) Forecast, by Application 2019 & 2032
- Table 66: GCC Military Wearables Industry Revenue (Million) Forecast, by Application 2019 & 2032
- Table 67: North Africa Military Wearables Industry Revenue (Million) Forecast, by Application 2019 & 2032
- Table 68: South Africa Military Wearables Industry Revenue (Million) Forecast, by Application 2019 & 2032
- Table 69: Rest of Middle East & Africa Military Wearables Industry Revenue (Million) Forecast, by Application 2019 & 2032
- Table 70: Global Military Wearables Industry Revenue Million Forecast, by Production Analysis 2019 & 2032
- Table 71: Global Military Wearables Industry Revenue Million Forecast, by Consumption Analysis 2019 & 2032
- Table 72: Global Military Wearables Industry Revenue Million Forecast, by Import Market Analysis (Value & Volume) 2019 & 2032
- Table 73: Global Military Wearables Industry Revenue Million Forecast, by Export Market Analysis (Value & Volume) 2019 & 2032
- Table 74: Global Military Wearables Industry Revenue Million Forecast, by Price Trend Analysis 2019 & 2032
- Table 75: Global Military Wearables Industry Revenue Million Forecast, by Country 2019 & 2032
- Table 76: China Military Wearables Industry Revenue (Million) Forecast, by Application 2019 & 2032
- Table 77: India Military Wearables Industry Revenue (Million) Forecast, by Application 2019 & 2032
- Table 78: Japan Military Wearables Industry Revenue (Million) Forecast, by Application 2019 & 2032
- Table 79: South Korea Military Wearables Industry Revenue (Million) Forecast, by Application 2019 & 2032
- Table 80: ASEAN Military Wearables Industry Revenue (Million) Forecast, by Application 2019 & 2032
- Table 81: Oceania Military Wearables Industry Revenue (Million) Forecast, by Application 2019 & 2032
- Table 82: Rest of Asia Pacific Military Wearables Industry Revenue (Million) Forecast, by Application 2019 & 2032
Frequently Asked Questions
1. What is the projected Compound Annual Growth Rate (CAGR) of the Military Wearables Industry?
The projected CAGR is approximately 13.58%.
2. Which companies are prominent players in the Military Wearables Industry?
Key companies in the market include Lockheed Martin Corporation, Rostec, Sarcos Technology and Robotics Corporation, Dephy Inc, Safran SA, ASELSAN A S, Mawashi Science & Technology, SRI Internationa, BAE Systems plc, Bionic Power Inc.
3. What are the main segments of the Military Wearables Industry?
The market segments include Production Analysis, Consumption Analysis, Import Market Analysis (Value & Volume), Export Market Analysis (Value & Volume), Price Trend Analysis.
4. Can you provide details about the market size?
The market size is estimated to be USD 166.97 Million as of 2022.
5. What are some drivers contributing to market growth?
N/A
6. What are the notable trends driving market growth?
The Active Exoskeleton Segment is Expected to Witness the Highest Growth During the Forecast Period.
7. Are there any restraints impacting market growth?
N/A
8. Can you provide examples of recent developments in the market?
September 2023: The National Chung-Shan Institute of Science and Technology (NCSIST) unveiled the latest version of its in-development locally-made powered exoskeleton suit, which is a mechanized wearable system designed to be used in wartime or during post-disaster rescue and relief missions. The exoskeleton delivers the right torque at the right time to assist knee flexion and extension to reduce the energy wearers expend when crossing terrain, squatting, or kneeling, and to increase mobility and reduce fatigue.
9. What pricing options are available for accessing the report?
Pricing options include single-user, multi-user, and enterprise licenses priced at USD 4750, USD 5250, and USD 8750 respectively.
10. Is the market size provided in terms of value or volume?
The market size is provided in terms of value, measured in Million.
11. Are there any specific market keywords associated with the report?
Yes, the market keyword associated with the report is "Military Wearables Industry," which aids in identifying and referencing the specific market segment covered.
12. How do I determine which pricing option suits my needs best?
The pricing options vary based on user requirements and access needs. Individual users may opt for single-user licenses, while businesses requiring broader access may choose multi-user or enterprise licenses for cost-effective access to the report.
13. Are there any additional resources or data provided in the Military Wearables Industry report?
While the report offers comprehensive insights, it's advisable to review the specific contents or supplementary materials provided to ascertain if additional resources or data are available.
14. How can I stay updated on further developments or reports in the Military Wearables Industry?
To stay informed about further developments, trends, and reports in the Military Wearables Industry, consider subscribing to industry newsletters, following relevant companies and organizations, or regularly checking reputable industry news sources and publications.
Methodology
Step 1 - Identification of Relevant Samples Size from Population Database


Step 2 - Approaches for Defining Global Market Size (Value, Volume* & Price*)

Note*: In applicable scenarios
Step 3 - Data Sources
Primary Research
- Web Analytics
- Survey Reports
- Research Institute
- Latest Research Reports
- Opinion Leaders
Secondary Research
- Annual Reports
- White Paper
- Latest Press Release
- Industry Association
- Paid Database
- Investor Presentations

Step 4 - Data Triangulation
Involves using different sources of information in order to increase the validity of a study
These sources are likely to be stakeholders in a program - participants, other researchers, program staff, other community members, and so on.
Then we put all data in single framework & apply various statistical tools to find out the dynamic on the market.
During the analysis stage, feedback from the stakeholder groups would be compared to determine areas of agreement as well as areas of divergence
