

Key Insights
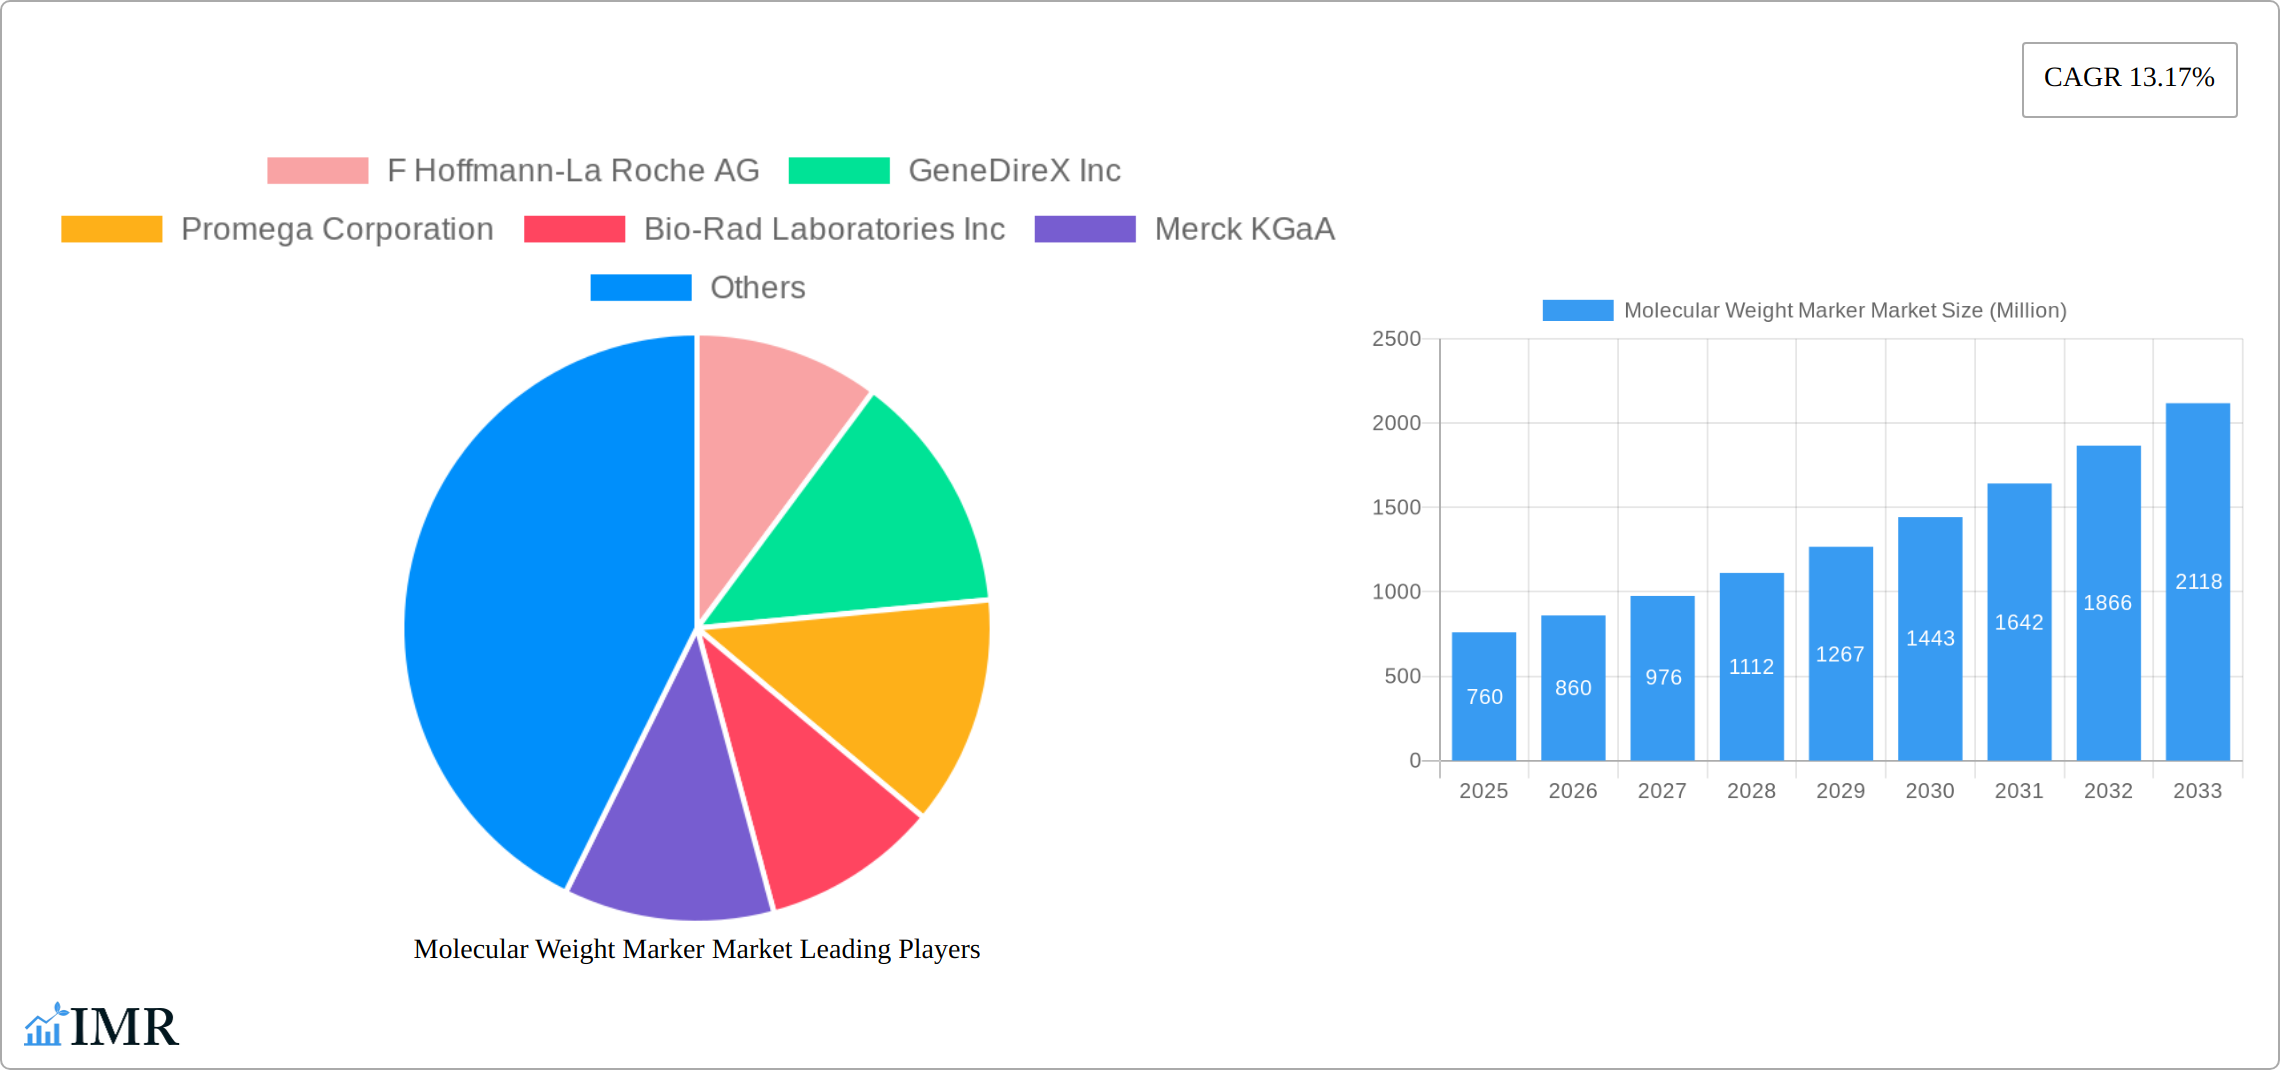
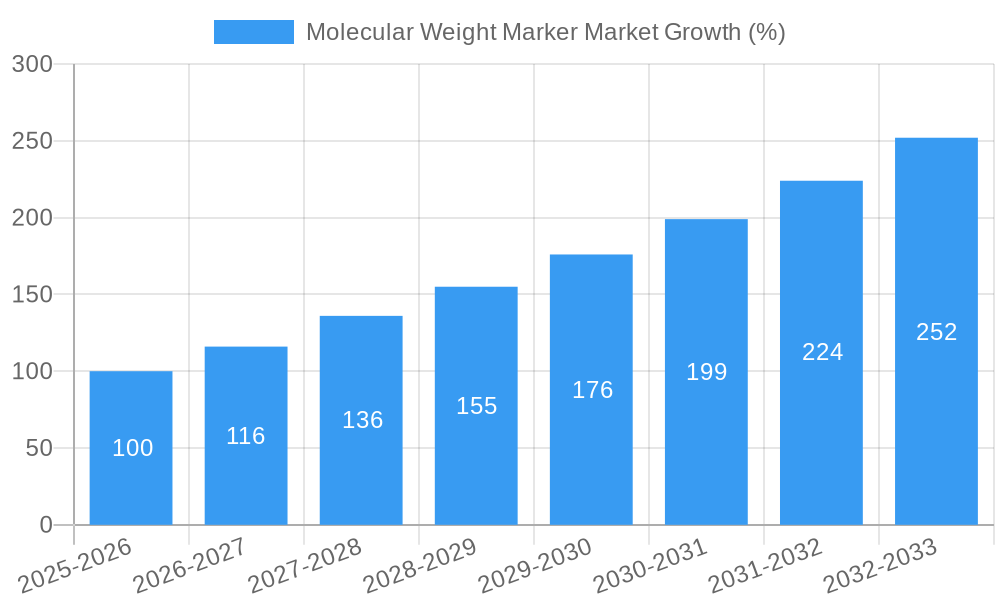
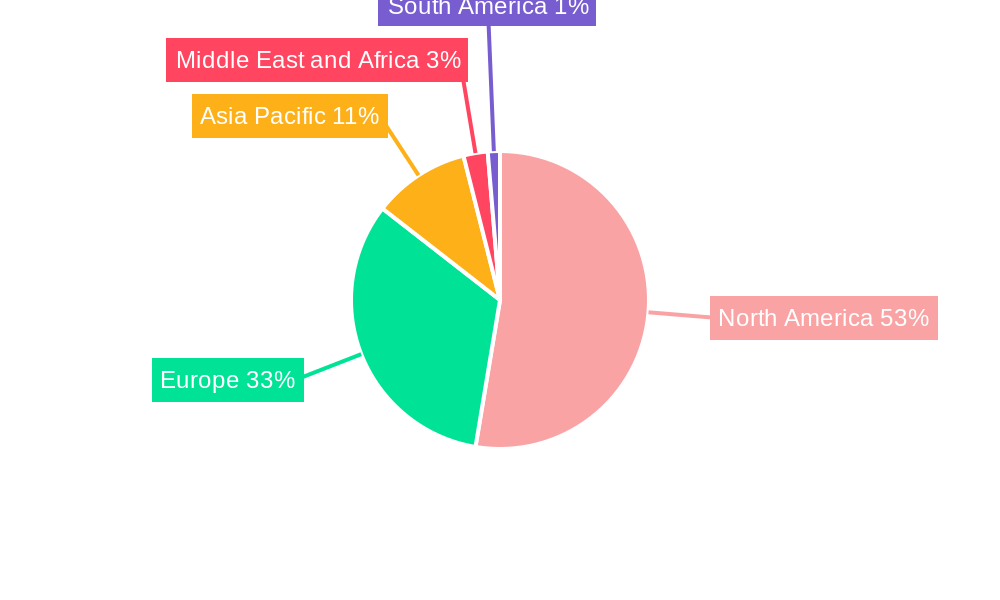
The global molecular weight marker market, valued at $0.76 billion in 2025, is projected to experience robust growth, driven by the escalating demand for advanced research tools in life sciences and biotechnology. A Compound Annual Growth Rate (CAGR) of 13.17% from 2025 to 2033 indicates a significant expansion, fueled by several key factors. The increasing adoption of molecular biology techniques such as PCR, Western blotting, and next-generation sequencing across academic research, pharmaceutical development, and clinical diagnostics contributes significantly to market growth. Furthermore, the rising prevalence of chronic diseases like cancer and infectious diseases necessitates extensive research, creating a higher demand for accurate and reliable molecular weight markers. The market segmentation reveals a strong preference for pre-stained markers due to their ease of use and convenience in visualizing results. Nucleic acid applications, particularly PCR, constitute a major application segment, reflecting the widespread use of PCR in various research and diagnostic settings. The dominance of North America and Europe in the market is expected to continue, although rapidly developing economies in Asia-Pacific are projected to witness significant growth, driven by increased investment in research infrastructure and a growing scientific community. The competitive landscape comprises both established players and emerging companies offering innovative products and services, resulting in a dynamic market. The availability of diverse product types, such as DNA, RNA, and protein markers, caters to a wide range of research and diagnostic needs.
Technological advancements leading to the development of high-sensitivity and high-resolution markers are expected to further propel market expansion. However, challenges such as high costs associated with certain types of markers and the need for skilled personnel to perform related techniques could potentially act as restraints. Nevertheless, the overall market outlook remains positive, with considerable opportunities for growth driven by ongoing advancements in life sciences, personalized medicine, and the increasing focus on early disease diagnosis and treatment. The market is anticipated to be significantly impacted by further technological breakthroughs, particularly in multiplex assays and automation, promising increased efficiency and throughput in molecular biology labs.
Molecular Weight Marker Market: A Comprehensive Report (2019-2033)
This in-depth report provides a comprehensive analysis of the Molecular Weight Marker Market, encompassing its parent market (Life Sciences Research Tools Market) and child markets (DNA, RNA, and Protein Markers). The study period spans from 2019 to 2033, with 2025 as the base and estimated year. The report leverages extensive primary and secondary research to offer actionable insights for industry stakeholders. The global market size in 2025 is estimated at xx Million and is projected to reach xx Million by 2033, exhibiting a CAGR of xx% during the forecast period (2025-2033).
Molecular Weight Marker Market Dynamics & Structure
The Molecular Weight Marker market is characterized by a moderately consolidated structure, with key players like Thermo Fisher Scientific, Bio-Rad Laboratories, and Merck KGaA holding significant market share. Technological innovation, particularly in next-generation sequencing and advanced proteomics, is a primary growth driver. Stringent regulatory frameworks governing in-vitro diagnostics influence market dynamics. Competitive substitutes include alternative sizing methods, though molecular weight markers remain the gold standard for many applications. The end-user demographic is primarily research institutions, pharmaceutical companies, and biotechnology firms. M&A activity is a notable feature, with recent deals focusing on expanding product portfolios and market reach.
- Market Concentration: High, with top 5 players holding approximately xx% market share in 2025.
- Innovation Drivers: Next-generation sequencing, advanced proteomics, improved marker sensitivity & resolution.
- Regulatory Landscape: Stringent regulatory approvals for diagnostic markers impact market entry and growth.
- Competitive Substitutes: Alternative sizing techniques, but with limited applicability compared to molecular weight markers.
- End-Users: Research institutions (xx%), Pharmaceutical & Biotech companies (xx%), Hospitals & Clinics (xx%).
- M&A Trends: Increased activity focusing on expanding product offerings and geographic reach (xx deals in the past 5 years).
Molecular Weight Marker Market Growth Trends & Insights
The Molecular Weight Marker market experienced robust growth during the historical period (2019-2024), driven by the increasing adoption of molecular biology techniques across diverse research and diagnostic applications. Technological advancements leading to higher sensitivity, improved resolution, and simplified workflows further fueled market expansion. The rising prevalence of chronic diseases and the consequent growth in the diagnostics industry is a crucial factor in boosting demand. Consumer behavior shifts towards automation and higher throughput assays are influencing product development strategies.
- Market Size Evolution: From xx Million in 2019 to xx Million in 2024, exhibiting a CAGR of xx%.
- Adoption Rates: High adoption in research settings, increasing adoption in clinical diagnostics.
- Technological Disruptions: Next-generation sequencing and advanced proteomics are major drivers of innovation.
- Consumer Behavior Shifts: Preference for automation, higher throughput, ease of use, and cost-effectiveness.
Dominant Regions, Countries, or Segments in Molecular Weight Marker Market
North America currently holds the largest market share, owing to the presence of major players, robust R&D investments, and high adoption rates in research and clinical settings. Within product segments, DNA markers constitute the largest segment, followed by protein markers and RNA markers. The nucleic acid applications segment dominates market share driven by the widespread use of PCR, molecular cloning, and other techniques.
- Key Drivers (North America): Strong R&D infrastructure, high healthcare expenditure, early adoption of new technologies.
- Key Drivers (Europe): Growing investment in life sciences research, increasing prevalence of chronic diseases.
- Key Drivers (Asia-Pacific): Rapid economic growth, increasing healthcare infrastructure, rising awareness of advanced diagnostics.
- Dominant Segment (Product): DNA Markers (xx% market share) – driven by high volume in PCR applications.
- Dominant Segment (Application): Nucleic Acid Applications (xx% market share) – PCR being a primary driver.
Molecular Weight Marker Market Product Landscape
The market features a diverse range of products, including pre-stained, unstained, and specialty markers designed for various applications. Innovations focus on improving resolution, sensitivity, and ease of use, including ready-to-use formats and improved stability. Unique selling propositions often center around superior performance characteristics, cost-effectiveness, and compatibility with a wide range of techniques.
Key Drivers, Barriers & Challenges in Molecular Weight Marker Market
Key Drivers:
- Increasing demand from life sciences research.
- Growing adoption in diagnostic applications.
- Advancements in molecular biology techniques.
- Technological innovations enhancing sensitivity and resolution.
Key Barriers & Challenges:
- High cost of advanced markers.
- Stringent regulatory approvals.
- Potential supply chain disruptions impacting raw material availability.
- Intense competition from established and emerging players. Market share competition can reduce profitability.
Emerging Opportunities in Molecular Weight Marker Market
- Expanding applications in personalized medicine and point-of-care diagnostics.
- Development of novel markers for specific applications (e.g., single-cell analysis).
- Growing demand for customized markers tailored to specific research needs.
- Untapped markets in emerging economies.
Growth Accelerators in the Molecular Weight Marker Market Industry
Strategic partnerships, collaborations, and technological advancements in areas such as next-generation sequencing and microfluidic technologies are driving long-term growth. Market expansion strategies focusing on emerging economies and personalized medicine are also significant catalysts. The ongoing development of high-throughput and automated systems is furthering growth.
Key Players Shaping the Molecular Weight Marker Market Market
- F Hoffmann-La Roche AG
- GeneDireX Inc
- Promega Corporation
- Bio-Rad Laboratories Inc
- Merck KGaA
- Thermo Fisher Scientific Inc
- New England Biolabs
- VWR International
- Takara Bio Inc
- QIAGEN N V
- Agilent Technologies Inc
- HiMedia Laboratories
Notable Milestones in Molecular Weight Marker Sector
- November 2022: Creative Enzymes launches a new line of highly efficient and cost-effective DNA markers.
- August 2022: Bio-Rad Laboratories acquires Curiosity Diagnostics, strengthening its position in molecular diagnostics.
In-Depth Molecular Weight Marker Market Outlook
The Molecular Weight Marker market is poised for continued growth driven by the persistent demand from life science research, expansion into clinical diagnostics, and ongoing technological innovation. Strategic partnerships and the development of novel, high-performance markers will be crucial factors in shaping future market dynamics. The market presents significant opportunities for companies focused on innovation, customization, and expansion into emerging markets.
Molecular Weight Marker Market Segmentation
-
1. Product
- 1.1. DNA Marker
- 1.2. Protein Marker
- 1.3. RNA Marker
-
2. Application
- 2.1. Nucleic
- 2.2. Proteomi
-
3. Type
- 3.1. Prestained Marker
- 3.2. Unstained Marker
- 3.3. Specialty Marker
Molecular Weight Marker Market Segmentation By Geography
-
1. North America
- 1.1. United States
- 1.2. Canada
- 1.3. Mexico
-
2. Europe
- 2.1. Germany
- 2.2. United Kingdom
- 2.3. France
- 2.4. Italy
- 2.5. Spain
- 2.6. Rest of Europe
-
3. Asia Pacific
- 3.1. China
- 3.2. Japan
- 3.3. India
- 3.4. Australia
- 3.5. South korea
- 3.6. Rest of Asia Pacific
-
4. Middle East and Africa
- 4.1. GCC
- 4.2. South Africa
- 4.3. Rest of Middle East and Africa
-
5. South America
- 5.1. Brazil
- 5.2. Argentina
- 5.3. Rest of South America
Molecular Weight Marker Market REPORT HIGHLIGHTS
| Aspects | Details |
|---|---|
| Study Period | 2019-2033 |
| Base Year | 2024 |
| Estimated Year | 2025 |
| Forecast Period | 2025-2033 |
| Historical Period | 2019-2024 |
| Growth Rate | CAGR of 13.17% from 2019-2033 |
| Segmentation |
|
Table of Contents
- 1. Introduction
- 1.1. Research Scope
- 1.2. Market Segmentation
- 1.3. Research Methodology
- 1.4. Definitions and Assumptions
- 2. Executive Summary
- 2.1. Introduction
- 3. Market Dynamics
- 3.1. Introduction
- 3.2. Market Drivers
- 3.2.1. Increasing Investment on R&D; Growing Focus on Proteomics and Genomics Technologies Research
- 3.3. Market Restrains
- 3.3.1. Lack of Skilled Healthcare Professionals; Strict Government Regulations
- 3.4. Market Trends
- 3.4.1. RNA Marker Segment is Expected to Show Significant Growth Over the Forecast Period
- 4. Market Factor Analysis
- 4.1. Porters Five Forces
- 4.2. Supply/Value Chain
- 4.3. PESTEL analysis
- 4.4. Market Entropy
- 4.5. Patent/Trademark Analysis
- 5. Global Molecular Weight Marker Market Analysis, Insights and Forecast, 2019-2031
- 5.1. Market Analysis, Insights and Forecast - by Product
- 5.1.1. DNA Marker
- 5.1.2. Protein Marker
- 5.1.3. RNA Marker
- 5.2. Market Analysis, Insights and Forecast - by Application
- 5.2.1. Nucleic
- 5.2.2. Proteomi
- 5.3. Market Analysis, Insights and Forecast - by Type
- 5.3.1. Prestained Marker
- 5.3.2. Unstained Marker
- 5.3.3. Specialty Marker
- 5.4. Market Analysis, Insights and Forecast - by Region
- 5.4.1. North America
- 5.4.2. Europe
- 5.4.3. Asia Pacific
- 5.4.4. Middle East and Africa
- 5.4.5. South America
- 5.1. Market Analysis, Insights and Forecast - by Product
- 6. North America Molecular Weight Marker Market Analysis, Insights and Forecast, 2019-2031
- 6.1. Market Analysis, Insights and Forecast - by Product
- 6.1.1. DNA Marker
- 6.1.2. Protein Marker
- 6.1.3. RNA Marker
- 6.2. Market Analysis, Insights and Forecast - by Application
- 6.2.1. Nucleic
- 6.2.2. Proteomi
- 6.3. Market Analysis, Insights and Forecast - by Type
- 6.3.1. Prestained Marker
- 6.3.2. Unstained Marker
- 6.3.3. Specialty Marker
- 6.1. Market Analysis, Insights and Forecast - by Product
- 7. Europe Molecular Weight Marker Market Analysis, Insights and Forecast, 2019-2031
- 7.1. Market Analysis, Insights and Forecast - by Product
- 7.1.1. DNA Marker
- 7.1.2. Protein Marker
- 7.1.3. RNA Marker
- 7.2. Market Analysis, Insights and Forecast - by Application
- 7.2.1. Nucleic
- 7.2.2. Proteomi
- 7.3. Market Analysis, Insights and Forecast - by Type
- 7.3.1. Prestained Marker
- 7.3.2. Unstained Marker
- 7.3.3. Specialty Marker
- 7.1. Market Analysis, Insights and Forecast - by Product
- 8. Asia Pacific Molecular Weight Marker Market Analysis, Insights and Forecast, 2019-2031
- 8.1. Market Analysis, Insights and Forecast - by Product
- 8.1.1. DNA Marker
- 8.1.2. Protein Marker
- 8.1.3. RNA Marker
- 8.2. Market Analysis, Insights and Forecast - by Application
- 8.2.1. Nucleic
- 8.2.2. Proteomi
- 8.3. Market Analysis, Insights and Forecast - by Type
- 8.3.1. Prestained Marker
- 8.3.2. Unstained Marker
- 8.3.3. Specialty Marker
- 8.1. Market Analysis, Insights and Forecast - by Product
- 9. Middle East and Africa Molecular Weight Marker Market Analysis, Insights and Forecast, 2019-2031
- 9.1. Market Analysis, Insights and Forecast - by Product
- 9.1.1. DNA Marker
- 9.1.2. Protein Marker
- 9.1.3. RNA Marker
- 9.2. Market Analysis, Insights and Forecast - by Application
- 9.2.1. Nucleic
- 9.2.2. Proteomi
- 9.3. Market Analysis, Insights and Forecast - by Type
- 9.3.1. Prestained Marker
- 9.3.2. Unstained Marker
- 9.3.3. Specialty Marker
- 9.1. Market Analysis, Insights and Forecast - by Product
- 10. South America Molecular Weight Marker Market Analysis, Insights and Forecast, 2019-2031
- 10.1. Market Analysis, Insights and Forecast - by Product
- 10.1.1. DNA Marker
- 10.1.2. Protein Marker
- 10.1.3. RNA Marker
- 10.2. Market Analysis, Insights and Forecast - by Application
- 10.2.1. Nucleic
- 10.2.2. Proteomi
- 10.3. Market Analysis, Insights and Forecast - by Type
- 10.3.1. Prestained Marker
- 10.3.2. Unstained Marker
- 10.3.3. Specialty Marker
- 10.1. Market Analysis, Insights and Forecast - by Product
- 11. North America Molecular Weight Marker Market Analysis, Insights and Forecast, 2019-2031
- 11.1. Market Analysis, Insights and Forecast - By Country/Sub-region
- 11.1.1 United States
- 11.1.2 Canada
- 11.1.3 Mexico
- 12. Europe Molecular Weight Marker Market Analysis, Insights and Forecast, 2019-2031
- 12.1. Market Analysis, Insights and Forecast - By Country/Sub-region
- 12.1.1 Germany
- 12.1.2 United Kingdom
- 12.1.3 France
- 12.1.4 Italy
- 12.1.5 Spain
- 12.1.6 Rest of Europe
- 13. Asia Pacific Molecular Weight Marker Market Analysis, Insights and Forecast, 2019-2031
- 13.1. Market Analysis, Insights and Forecast - By Country/Sub-region
- 13.1.1 China
- 13.1.2 Japan
- 13.1.3 India
- 13.1.4 Australia
- 13.1.5 South korea
- 13.1.6 Rest of Asia Pacific
- 14. Middle East and Africa Molecular Weight Marker Market Analysis, Insights and Forecast, 2019-2031
- 14.1. Market Analysis, Insights and Forecast - By Country/Sub-region
- 14.1.1 GCC
- 14.1.2 South Africa
- 14.1.3 Rest of Middle East and Africa
- 15. South America Molecular Weight Marker Market Analysis, Insights and Forecast, 2019-2031
- 15.1. Market Analysis, Insights and Forecast - By Country/Sub-region
- 15.1.1 Brazil
- 15.1.2 Argentina
- 15.1.3 Rest of South America
- 16. Competitive Analysis
- 16.1. Global Market Share Analysis 2024
- 16.2. Company Profiles
- 16.2.1 F Hoffmann-La Roche AG
- 16.2.1.1. Overview
- 16.2.1.2. Products
- 16.2.1.3. SWOT Analysis
- 16.2.1.4. Recent Developments
- 16.2.1.5. Financials (Based on Availability)
- 16.2.2 GeneDireX Inc
- 16.2.2.1. Overview
- 16.2.2.2. Products
- 16.2.2.3. SWOT Analysis
- 16.2.2.4. Recent Developments
- 16.2.2.5. Financials (Based on Availability)
- 16.2.3 Promega Corporation
- 16.2.3.1. Overview
- 16.2.3.2. Products
- 16.2.3.3. SWOT Analysis
- 16.2.3.4. Recent Developments
- 16.2.3.5. Financials (Based on Availability)
- 16.2.4 Bio-Rad Laboratories Inc
- 16.2.4.1. Overview
- 16.2.4.2. Products
- 16.2.4.3. SWOT Analysis
- 16.2.4.4. Recent Developments
- 16.2.4.5. Financials (Based on Availability)
- 16.2.5 Merck KGaA
- 16.2.5.1. Overview
- 16.2.5.2. Products
- 16.2.5.3. SWOT Analysis
- 16.2.5.4. Recent Developments
- 16.2.5.5. Financials (Based on Availability)
- 16.2.6 Thermo Fisher Scientific Inc
- 16.2.6.1. Overview
- 16.2.6.2. Products
- 16.2.6.3. SWOT Analysis
- 16.2.6.4. Recent Developments
- 16.2.6.5. Financials (Based on Availability)
- 16.2.7 New England Biolabs
- 16.2.7.1. Overview
- 16.2.7.2. Products
- 16.2.7.3. SWOT Analysis
- 16.2.7.4. Recent Developments
- 16.2.7.5. Financials (Based on Availability)
- 16.2.8 VWR International
- 16.2.8.1. Overview
- 16.2.8.2. Products
- 16.2.8.3. SWOT Analysis
- 16.2.8.4. Recent Developments
- 16.2.8.5. Financials (Based on Availability)
- 16.2.9 Takara Bio Inc
- 16.2.9.1. Overview
- 16.2.9.2. Products
- 16.2.9.3. SWOT Analysis
- 16.2.9.4. Recent Developments
- 16.2.9.5. Financials (Based on Availability)
- 16.2.10 QIAGEN N V
- 16.2.10.1. Overview
- 16.2.10.2. Products
- 16.2.10.3. SWOT Analysis
- 16.2.10.4. Recent Developments
- 16.2.10.5. Financials (Based on Availability)
- 16.2.11 Agilent Technologies Inc
- 16.2.11.1. Overview
- 16.2.11.2. Products
- 16.2.11.3. SWOT Analysis
- 16.2.11.4. Recent Developments
- 16.2.11.5. Financials (Based on Availability)
- 16.2.12 HiMedia Laboratories
- 16.2.12.1. Overview
- 16.2.12.2. Products
- 16.2.12.3. SWOT Analysis
- 16.2.12.4. Recent Developments
- 16.2.12.5. Financials (Based on Availability)
- 16.2.1 F Hoffmann-La Roche AG
List of Figures
- Figure 1: Global Molecular Weight Marker Market Revenue Breakdown (Million, %) by Region 2024 & 2032
- Figure 2: Global Molecular Weight Marker Market Volume Breakdown (K Unit, %) by Region 2024 & 2032
- Figure 3: North America Molecular Weight Marker Market Revenue (Million), by Country 2024 & 2032
- Figure 4: North America Molecular Weight Marker Market Volume (K Unit), by Country 2024 & 2032
- Figure 5: North America Molecular Weight Marker Market Revenue Share (%), by Country 2024 & 2032
- Figure 6: North America Molecular Weight Marker Market Volume Share (%), by Country 2024 & 2032
- Figure 7: Europe Molecular Weight Marker Market Revenue (Million), by Country 2024 & 2032
- Figure 8: Europe Molecular Weight Marker Market Volume (K Unit), by Country 2024 & 2032
- Figure 9: Europe Molecular Weight Marker Market Revenue Share (%), by Country 2024 & 2032
- Figure 10: Europe Molecular Weight Marker Market Volume Share (%), by Country 2024 & 2032
- Figure 11: Asia Pacific Molecular Weight Marker Market Revenue (Million), by Country 2024 & 2032
- Figure 12: Asia Pacific Molecular Weight Marker Market Volume (K Unit), by Country 2024 & 2032
- Figure 13: Asia Pacific Molecular Weight Marker Market Revenue Share (%), by Country 2024 & 2032
- Figure 14: Asia Pacific Molecular Weight Marker Market Volume Share (%), by Country 2024 & 2032
- Figure 15: Middle East and Africa Molecular Weight Marker Market Revenue (Million), by Country 2024 & 2032
- Figure 16: Middle East and Africa Molecular Weight Marker Market Volume (K Unit), by Country 2024 & 2032
- Figure 17: Middle East and Africa Molecular Weight Marker Market Revenue Share (%), by Country 2024 & 2032
- Figure 18: Middle East and Africa Molecular Weight Marker Market Volume Share (%), by Country 2024 & 2032
- Figure 19: South America Molecular Weight Marker Market Revenue (Million), by Country 2024 & 2032
- Figure 20: South America Molecular Weight Marker Market Volume (K Unit), by Country 2024 & 2032
- Figure 21: South America Molecular Weight Marker Market Revenue Share (%), by Country 2024 & 2032
- Figure 22: South America Molecular Weight Marker Market Volume Share (%), by Country 2024 & 2032
- Figure 23: North America Molecular Weight Marker Market Revenue (Million), by Product 2024 & 2032
- Figure 24: North America Molecular Weight Marker Market Volume (K Unit), by Product 2024 & 2032
- Figure 25: North America Molecular Weight Marker Market Revenue Share (%), by Product 2024 & 2032
- Figure 26: North America Molecular Weight Marker Market Volume Share (%), by Product 2024 & 2032
- Figure 27: North America Molecular Weight Marker Market Revenue (Million), by Application 2024 & 2032
- Figure 28: North America Molecular Weight Marker Market Volume (K Unit), by Application 2024 & 2032
- Figure 29: North America Molecular Weight Marker Market Revenue Share (%), by Application 2024 & 2032
- Figure 30: North America Molecular Weight Marker Market Volume Share (%), by Application 2024 & 2032
- Figure 31: North America Molecular Weight Marker Market Revenue (Million), by Type 2024 & 2032
- Figure 32: North America Molecular Weight Marker Market Volume (K Unit), by Type 2024 & 2032
- Figure 33: North America Molecular Weight Marker Market Revenue Share (%), by Type 2024 & 2032
- Figure 34: North America Molecular Weight Marker Market Volume Share (%), by Type 2024 & 2032
- Figure 35: North America Molecular Weight Marker Market Revenue (Million), by Country 2024 & 2032
- Figure 36: North America Molecular Weight Marker Market Volume (K Unit), by Country 2024 & 2032
- Figure 37: North America Molecular Weight Marker Market Revenue Share (%), by Country 2024 & 2032
- Figure 38: North America Molecular Weight Marker Market Volume Share (%), by Country 2024 & 2032
- Figure 39: Europe Molecular Weight Marker Market Revenue (Million), by Product 2024 & 2032
- Figure 40: Europe Molecular Weight Marker Market Volume (K Unit), by Product 2024 & 2032
- Figure 41: Europe Molecular Weight Marker Market Revenue Share (%), by Product 2024 & 2032
- Figure 42: Europe Molecular Weight Marker Market Volume Share (%), by Product 2024 & 2032
- Figure 43: Europe Molecular Weight Marker Market Revenue (Million), by Application 2024 & 2032
- Figure 44: Europe Molecular Weight Marker Market Volume (K Unit), by Application 2024 & 2032
- Figure 45: Europe Molecular Weight Marker Market Revenue Share (%), by Application 2024 & 2032
- Figure 46: Europe Molecular Weight Marker Market Volume Share (%), by Application 2024 & 2032
- Figure 47: Europe Molecular Weight Marker Market Revenue (Million), by Type 2024 & 2032
- Figure 48: Europe Molecular Weight Marker Market Volume (K Unit), by Type 2024 & 2032
- Figure 49: Europe Molecular Weight Marker Market Revenue Share (%), by Type 2024 & 2032
- Figure 50: Europe Molecular Weight Marker Market Volume Share (%), by Type 2024 & 2032
- Figure 51: Europe Molecular Weight Marker Market Revenue (Million), by Country 2024 & 2032
- Figure 52: Europe Molecular Weight Marker Market Volume (K Unit), by Country 2024 & 2032
- Figure 53: Europe Molecular Weight Marker Market Revenue Share (%), by Country 2024 & 2032
- Figure 54: Europe Molecular Weight Marker Market Volume Share (%), by Country 2024 & 2032
- Figure 55: Asia Pacific Molecular Weight Marker Market Revenue (Million), by Product 2024 & 2032
- Figure 56: Asia Pacific Molecular Weight Marker Market Volume (K Unit), by Product 2024 & 2032
- Figure 57: Asia Pacific Molecular Weight Marker Market Revenue Share (%), by Product 2024 & 2032
- Figure 58: Asia Pacific Molecular Weight Marker Market Volume Share (%), by Product 2024 & 2032
- Figure 59: Asia Pacific Molecular Weight Marker Market Revenue (Million), by Application 2024 & 2032
- Figure 60: Asia Pacific Molecular Weight Marker Market Volume (K Unit), by Application 2024 & 2032
- Figure 61: Asia Pacific Molecular Weight Marker Market Revenue Share (%), by Application 2024 & 2032
- Figure 62: Asia Pacific Molecular Weight Marker Market Volume Share (%), by Application 2024 & 2032
- Figure 63: Asia Pacific Molecular Weight Marker Market Revenue (Million), by Type 2024 & 2032
- Figure 64: Asia Pacific Molecular Weight Marker Market Volume (K Unit), by Type 2024 & 2032
- Figure 65: Asia Pacific Molecular Weight Marker Market Revenue Share (%), by Type 2024 & 2032
- Figure 66: Asia Pacific Molecular Weight Marker Market Volume Share (%), by Type 2024 & 2032
- Figure 67: Asia Pacific Molecular Weight Marker Market Revenue (Million), by Country 2024 & 2032
- Figure 68: Asia Pacific Molecular Weight Marker Market Volume (K Unit), by Country 2024 & 2032
- Figure 69: Asia Pacific Molecular Weight Marker Market Revenue Share (%), by Country 2024 & 2032
- Figure 70: Asia Pacific Molecular Weight Marker Market Volume Share (%), by Country 2024 & 2032
- Figure 71: Middle East and Africa Molecular Weight Marker Market Revenue (Million), by Product 2024 & 2032
- Figure 72: Middle East and Africa Molecular Weight Marker Market Volume (K Unit), by Product 2024 & 2032
- Figure 73: Middle East and Africa Molecular Weight Marker Market Revenue Share (%), by Product 2024 & 2032
- Figure 74: Middle East and Africa Molecular Weight Marker Market Volume Share (%), by Product 2024 & 2032
- Figure 75: Middle East and Africa Molecular Weight Marker Market Revenue (Million), by Application 2024 & 2032
- Figure 76: Middle East and Africa Molecular Weight Marker Market Volume (K Unit), by Application 2024 & 2032
- Figure 77: Middle East and Africa Molecular Weight Marker Market Revenue Share (%), by Application 2024 & 2032
- Figure 78: Middle East and Africa Molecular Weight Marker Market Volume Share (%), by Application 2024 & 2032
- Figure 79: Middle East and Africa Molecular Weight Marker Market Revenue (Million), by Type 2024 & 2032
- Figure 80: Middle East and Africa Molecular Weight Marker Market Volume (K Unit), by Type 2024 & 2032
- Figure 81: Middle East and Africa Molecular Weight Marker Market Revenue Share (%), by Type 2024 & 2032
- Figure 82: Middle East and Africa Molecular Weight Marker Market Volume Share (%), by Type 2024 & 2032
- Figure 83: Middle East and Africa Molecular Weight Marker Market Revenue (Million), by Country 2024 & 2032
- Figure 84: Middle East and Africa Molecular Weight Marker Market Volume (K Unit), by Country 2024 & 2032
- Figure 85: Middle East and Africa Molecular Weight Marker Market Revenue Share (%), by Country 2024 & 2032
- Figure 86: Middle East and Africa Molecular Weight Marker Market Volume Share (%), by Country 2024 & 2032
- Figure 87: South America Molecular Weight Marker Market Revenue (Million), by Product 2024 & 2032
- Figure 88: South America Molecular Weight Marker Market Volume (K Unit), by Product 2024 & 2032
- Figure 89: South America Molecular Weight Marker Market Revenue Share (%), by Product 2024 & 2032
- Figure 90: South America Molecular Weight Marker Market Volume Share (%), by Product 2024 & 2032
- Figure 91: South America Molecular Weight Marker Market Revenue (Million), by Application 2024 & 2032
- Figure 92: South America Molecular Weight Marker Market Volume (K Unit), by Application 2024 & 2032
- Figure 93: South America Molecular Weight Marker Market Revenue Share (%), by Application 2024 & 2032
- Figure 94: South America Molecular Weight Marker Market Volume Share (%), by Application 2024 & 2032
- Figure 95: South America Molecular Weight Marker Market Revenue (Million), by Type 2024 & 2032
- Figure 96: South America Molecular Weight Marker Market Volume (K Unit), by Type 2024 & 2032
- Figure 97: South America Molecular Weight Marker Market Revenue Share (%), by Type 2024 & 2032
- Figure 98: South America Molecular Weight Marker Market Volume Share (%), by Type 2024 & 2032
- Figure 99: South America Molecular Weight Marker Market Revenue (Million), by Country 2024 & 2032
- Figure 100: South America Molecular Weight Marker Market Volume (K Unit), by Country 2024 & 2032
- Figure 101: South America Molecular Weight Marker Market Revenue Share (%), by Country 2024 & 2032
- Figure 102: South America Molecular Weight Marker Market Volume Share (%), by Country 2024 & 2032
List of Tables
- Table 1: Global Molecular Weight Marker Market Revenue Million Forecast, by Region 2019 & 2032
- Table 2: Global Molecular Weight Marker Market Volume K Unit Forecast, by Region 2019 & 2032
- Table 3: Global Molecular Weight Marker Market Revenue Million Forecast, by Product 2019 & 2032
- Table 4: Global Molecular Weight Marker Market Volume K Unit Forecast, by Product 2019 & 2032
- Table 5: Global Molecular Weight Marker Market Revenue Million Forecast, by Application 2019 & 2032
- Table 6: Global Molecular Weight Marker Market Volume K Unit Forecast, by Application 2019 & 2032
- Table 7: Global Molecular Weight Marker Market Revenue Million Forecast, by Type 2019 & 2032
- Table 8: Global Molecular Weight Marker Market Volume K Unit Forecast, by Type 2019 & 2032
- Table 9: Global Molecular Weight Marker Market Revenue Million Forecast, by Region 2019 & 2032
- Table 10: Global Molecular Weight Marker Market Volume K Unit Forecast, by Region 2019 & 2032
- Table 11: Global Molecular Weight Marker Market Revenue Million Forecast, by Country 2019 & 2032
- Table 12: Global Molecular Weight Marker Market Volume K Unit Forecast, by Country 2019 & 2032
- Table 13: United States Molecular Weight Marker Market Revenue (Million) Forecast, by Application 2019 & 2032
- Table 14: United States Molecular Weight Marker Market Volume (K Unit) Forecast, by Application 2019 & 2032
- Table 15: Canada Molecular Weight Marker Market Revenue (Million) Forecast, by Application 2019 & 2032
- Table 16: Canada Molecular Weight Marker Market Volume (K Unit) Forecast, by Application 2019 & 2032
- Table 17: Mexico Molecular Weight Marker Market Revenue (Million) Forecast, by Application 2019 & 2032
- Table 18: Mexico Molecular Weight Marker Market Volume (K Unit) Forecast, by Application 2019 & 2032
- Table 19: Global Molecular Weight Marker Market Revenue Million Forecast, by Country 2019 & 2032
- Table 20: Global Molecular Weight Marker Market Volume K Unit Forecast, by Country 2019 & 2032
- Table 21: Germany Molecular Weight Marker Market Revenue (Million) Forecast, by Application 2019 & 2032
- Table 22: Germany Molecular Weight Marker Market Volume (K Unit) Forecast, by Application 2019 & 2032
- Table 23: United Kingdom Molecular Weight Marker Market Revenue (Million) Forecast, by Application 2019 & 2032
- Table 24: United Kingdom Molecular Weight Marker Market Volume (K Unit) Forecast, by Application 2019 & 2032
- Table 25: France Molecular Weight Marker Market Revenue (Million) Forecast, by Application 2019 & 2032
- Table 26: France Molecular Weight Marker Market Volume (K Unit) Forecast, by Application 2019 & 2032
- Table 27: Italy Molecular Weight Marker Market Revenue (Million) Forecast, by Application 2019 & 2032
- Table 28: Italy Molecular Weight Marker Market Volume (K Unit) Forecast, by Application 2019 & 2032
- Table 29: Spain Molecular Weight Marker Market Revenue (Million) Forecast, by Application 2019 & 2032
- Table 30: Spain Molecular Weight Marker Market Volume (K Unit) Forecast, by Application 2019 & 2032
- Table 31: Rest of Europe Molecular Weight Marker Market Revenue (Million) Forecast, by Application 2019 & 2032
- Table 32: Rest of Europe Molecular Weight Marker Market Volume (K Unit) Forecast, by Application 2019 & 2032
- Table 33: Global Molecular Weight Marker Market Revenue Million Forecast, by Country 2019 & 2032
- Table 34: Global Molecular Weight Marker Market Volume K Unit Forecast, by Country 2019 & 2032
- Table 35: China Molecular Weight Marker Market Revenue (Million) Forecast, by Application 2019 & 2032
- Table 36: China Molecular Weight Marker Market Volume (K Unit) Forecast, by Application 2019 & 2032
- Table 37: Japan Molecular Weight Marker Market Revenue (Million) Forecast, by Application 2019 & 2032
- Table 38: Japan Molecular Weight Marker Market Volume (K Unit) Forecast, by Application 2019 & 2032
- Table 39: India Molecular Weight Marker Market Revenue (Million) Forecast, by Application 2019 & 2032
- Table 40: India Molecular Weight Marker Market Volume (K Unit) Forecast, by Application 2019 & 2032
- Table 41: Australia Molecular Weight Marker Market Revenue (Million) Forecast, by Application 2019 & 2032
- Table 42: Australia Molecular Weight Marker Market Volume (K Unit) Forecast, by Application 2019 & 2032
- Table 43: South korea Molecular Weight Marker Market Revenue (Million) Forecast, by Application 2019 & 2032
- Table 44: South korea Molecular Weight Marker Market Volume (K Unit) Forecast, by Application 2019 & 2032
- Table 45: Rest of Asia Pacific Molecular Weight Marker Market Revenue (Million) Forecast, by Application 2019 & 2032
- Table 46: Rest of Asia Pacific Molecular Weight Marker Market Volume (K Unit) Forecast, by Application 2019 & 2032
- Table 47: Global Molecular Weight Marker Market Revenue Million Forecast, by Country 2019 & 2032
- Table 48: Global Molecular Weight Marker Market Volume K Unit Forecast, by Country 2019 & 2032
- Table 49: GCC Molecular Weight Marker Market Revenue (Million) Forecast, by Application 2019 & 2032
- Table 50: GCC Molecular Weight Marker Market Volume (K Unit) Forecast, by Application 2019 & 2032
- Table 51: South Africa Molecular Weight Marker Market Revenue (Million) Forecast, by Application 2019 & 2032
- Table 52: South Africa Molecular Weight Marker Market Volume (K Unit) Forecast, by Application 2019 & 2032
- Table 53: Rest of Middle East and Africa Molecular Weight Marker Market Revenue (Million) Forecast, by Application 2019 & 2032
- Table 54: Rest of Middle East and Africa Molecular Weight Marker Market Volume (K Unit) Forecast, by Application 2019 & 2032
- Table 55: Global Molecular Weight Marker Market Revenue Million Forecast, by Country 2019 & 2032
- Table 56: Global Molecular Weight Marker Market Volume K Unit Forecast, by Country 2019 & 2032
- Table 57: Brazil Molecular Weight Marker Market Revenue (Million) Forecast, by Application 2019 & 2032
- Table 58: Brazil Molecular Weight Marker Market Volume (K Unit) Forecast, by Application 2019 & 2032
- Table 59: Argentina Molecular Weight Marker Market Revenue (Million) Forecast, by Application 2019 & 2032
- Table 60: Argentina Molecular Weight Marker Market Volume (K Unit) Forecast, by Application 2019 & 2032
- Table 61: Rest of South America Molecular Weight Marker Market Revenue (Million) Forecast, by Application 2019 & 2032
- Table 62: Rest of South America Molecular Weight Marker Market Volume (K Unit) Forecast, by Application 2019 & 2032
- Table 63: Global Molecular Weight Marker Market Revenue Million Forecast, by Product 2019 & 2032
- Table 64: Global Molecular Weight Marker Market Volume K Unit Forecast, by Product 2019 & 2032
- Table 65: Global Molecular Weight Marker Market Revenue Million Forecast, by Application 2019 & 2032
- Table 66: Global Molecular Weight Marker Market Volume K Unit Forecast, by Application 2019 & 2032
- Table 67: Global Molecular Weight Marker Market Revenue Million Forecast, by Type 2019 & 2032
- Table 68: Global Molecular Weight Marker Market Volume K Unit Forecast, by Type 2019 & 2032
- Table 69: Global Molecular Weight Marker Market Revenue Million Forecast, by Country 2019 & 2032
- Table 70: Global Molecular Weight Marker Market Volume K Unit Forecast, by Country 2019 & 2032
- Table 71: United States Molecular Weight Marker Market Revenue (Million) Forecast, by Application 2019 & 2032
- Table 72: United States Molecular Weight Marker Market Volume (K Unit) Forecast, by Application 2019 & 2032
- Table 73: Canada Molecular Weight Marker Market Revenue (Million) Forecast, by Application 2019 & 2032
- Table 74: Canada Molecular Weight Marker Market Volume (K Unit) Forecast, by Application 2019 & 2032
- Table 75: Mexico Molecular Weight Marker Market Revenue (Million) Forecast, by Application 2019 & 2032
- Table 76: Mexico Molecular Weight Marker Market Volume (K Unit) Forecast, by Application 2019 & 2032
- Table 77: Global Molecular Weight Marker Market Revenue Million Forecast, by Product 2019 & 2032
- Table 78: Global Molecular Weight Marker Market Volume K Unit Forecast, by Product 2019 & 2032
- Table 79: Global Molecular Weight Marker Market Revenue Million Forecast, by Application 2019 & 2032
- Table 80: Global Molecular Weight Marker Market Volume K Unit Forecast, by Application 2019 & 2032
- Table 81: Global Molecular Weight Marker Market Revenue Million Forecast, by Type 2019 & 2032
- Table 82: Global Molecular Weight Marker Market Volume K Unit Forecast, by Type 2019 & 2032
- Table 83: Global Molecular Weight Marker Market Revenue Million Forecast, by Country 2019 & 2032
- Table 84: Global Molecular Weight Marker Market Volume K Unit Forecast, by Country 2019 & 2032
- Table 85: Germany Molecular Weight Marker Market Revenue (Million) Forecast, by Application 2019 & 2032
- Table 86: Germany Molecular Weight Marker Market Volume (K Unit) Forecast, by Application 2019 & 2032
- Table 87: United Kingdom Molecular Weight Marker Market Revenue (Million) Forecast, by Application 2019 & 2032
- Table 88: United Kingdom Molecular Weight Marker Market Volume (K Unit) Forecast, by Application 2019 & 2032
- Table 89: France Molecular Weight Marker Market Revenue (Million) Forecast, by Application 2019 & 2032
- Table 90: France Molecular Weight Marker Market Volume (K Unit) Forecast, by Application 2019 & 2032
- Table 91: Italy Molecular Weight Marker Market Revenue (Million) Forecast, by Application 2019 & 2032
- Table 92: Italy Molecular Weight Marker Market Volume (K Unit) Forecast, by Application 2019 & 2032
- Table 93: Spain Molecular Weight Marker Market Revenue (Million) Forecast, by Application 2019 & 2032
- Table 94: Spain Molecular Weight Marker Market Volume (K Unit) Forecast, by Application 2019 & 2032
- Table 95: Rest of Europe Molecular Weight Marker Market Revenue (Million) Forecast, by Application 2019 & 2032
- Table 96: Rest of Europe Molecular Weight Marker Market Volume (K Unit) Forecast, by Application 2019 & 2032
- Table 97: Global Molecular Weight Marker Market Revenue Million Forecast, by Product 2019 & 2032
- Table 98: Global Molecular Weight Marker Market Volume K Unit Forecast, by Product 2019 & 2032
- Table 99: Global Molecular Weight Marker Market Revenue Million Forecast, by Application 2019 & 2032
- Table 100: Global Molecular Weight Marker Market Volume K Unit Forecast, by Application 2019 & 2032
- Table 101: Global Molecular Weight Marker Market Revenue Million Forecast, by Type 2019 & 2032
- Table 102: Global Molecular Weight Marker Market Volume K Unit Forecast, by Type 2019 & 2032
- Table 103: Global Molecular Weight Marker Market Revenue Million Forecast, by Country 2019 & 2032
- Table 104: Global Molecular Weight Marker Market Volume K Unit Forecast, by Country 2019 & 2032
- Table 105: China Molecular Weight Marker Market Revenue (Million) Forecast, by Application 2019 & 2032
- Table 106: China Molecular Weight Marker Market Volume (K Unit) Forecast, by Application 2019 & 2032
- Table 107: Japan Molecular Weight Marker Market Revenue (Million) Forecast, by Application 2019 & 2032
- Table 108: Japan Molecular Weight Marker Market Volume (K Unit) Forecast, by Application 2019 & 2032
- Table 109: India Molecular Weight Marker Market Revenue (Million) Forecast, by Application 2019 & 2032
- Table 110: India Molecular Weight Marker Market Volume (K Unit) Forecast, by Application 2019 & 2032
- Table 111: Australia Molecular Weight Marker Market Revenue (Million) Forecast, by Application 2019 & 2032
- Table 112: Australia Molecular Weight Marker Market Volume (K Unit) Forecast, by Application 2019 & 2032
- Table 113: South korea Molecular Weight Marker Market Revenue (Million) Forecast, by Application 2019 & 2032
- Table 114: South korea Molecular Weight Marker Market Volume (K Unit) Forecast, by Application 2019 & 2032
- Table 115: Rest of Asia Pacific Molecular Weight Marker Market Revenue (Million) Forecast, by Application 2019 & 2032
- Table 116: Rest of Asia Pacific Molecular Weight Marker Market Volume (K Unit) Forecast, by Application 2019 & 2032
- Table 117: Global Molecular Weight Marker Market Revenue Million Forecast, by Product 2019 & 2032
- Table 118: Global Molecular Weight Marker Market Volume K Unit Forecast, by Product 2019 & 2032
- Table 119: Global Molecular Weight Marker Market Revenue Million Forecast, by Application 2019 & 2032
- Table 120: Global Molecular Weight Marker Market Volume K Unit Forecast, by Application 2019 & 2032
- Table 121: Global Molecular Weight Marker Market Revenue Million Forecast, by Type 2019 & 2032
- Table 122: Global Molecular Weight Marker Market Volume K Unit Forecast, by Type 2019 & 2032
- Table 123: Global Molecular Weight Marker Market Revenue Million Forecast, by Country 2019 & 2032
- Table 124: Global Molecular Weight Marker Market Volume K Unit Forecast, by Country 2019 & 2032
- Table 125: GCC Molecular Weight Marker Market Revenue (Million) Forecast, by Application 2019 & 2032
- Table 126: GCC Molecular Weight Marker Market Volume (K Unit) Forecast, by Application 2019 & 2032
- Table 127: South Africa Molecular Weight Marker Market Revenue (Million) Forecast, by Application 2019 & 2032
- Table 128: South Africa Molecular Weight Marker Market Volume (K Unit) Forecast, by Application 2019 & 2032
- Table 129: Rest of Middle East and Africa Molecular Weight Marker Market Revenue (Million) Forecast, by Application 2019 & 2032
- Table 130: Rest of Middle East and Africa Molecular Weight Marker Market Volume (K Unit) Forecast, by Application 2019 & 2032
- Table 131: Global Molecular Weight Marker Market Revenue Million Forecast, by Product 2019 & 2032
- Table 132: Global Molecular Weight Marker Market Volume K Unit Forecast, by Product 2019 & 2032
- Table 133: Global Molecular Weight Marker Market Revenue Million Forecast, by Application 2019 & 2032
- Table 134: Global Molecular Weight Marker Market Volume K Unit Forecast, by Application 2019 & 2032
- Table 135: Global Molecular Weight Marker Market Revenue Million Forecast, by Type 2019 & 2032
- Table 136: Global Molecular Weight Marker Market Volume K Unit Forecast, by Type 2019 & 2032
- Table 137: Global Molecular Weight Marker Market Revenue Million Forecast, by Country 2019 & 2032
- Table 138: Global Molecular Weight Marker Market Volume K Unit Forecast, by Country 2019 & 2032
- Table 139: Brazil Molecular Weight Marker Market Revenue (Million) Forecast, by Application 2019 & 2032
- Table 140: Brazil Molecular Weight Marker Market Volume (K Unit) Forecast, by Application 2019 & 2032
- Table 141: Argentina Molecular Weight Marker Market Revenue (Million) Forecast, by Application 2019 & 2032
- Table 142: Argentina Molecular Weight Marker Market Volume (K Unit) Forecast, by Application 2019 & 2032
- Table 143: Rest of South America Molecular Weight Marker Market Revenue (Million) Forecast, by Application 2019 & 2032
- Table 144: Rest of South America Molecular Weight Marker Market Volume (K Unit) Forecast, by Application 2019 & 2032
Frequently Asked Questions
1. What is the projected Compound Annual Growth Rate (CAGR) of the Molecular Weight Marker Market?
The projected CAGR is approximately 13.17%.
2. Which companies are prominent players in the Molecular Weight Marker Market?
Key companies in the market include F Hoffmann-La Roche AG, GeneDireX Inc , Promega Corporation, Bio-Rad Laboratories Inc, Merck KGaA, Thermo Fisher Scientific Inc, New England Biolabs, VWR International, Takara Bio Inc, QIAGEN N V, Agilent Technologies Inc, HiMedia Laboratories.
3. What are the main segments of the Molecular Weight Marker Market?
The market segments include Product, Application, Type.
4. Can you provide details about the market size?
The market size is estimated to be USD 0.76 Million as of 2022.
5. What are some drivers contributing to market growth?
Increasing Investment on R&D; Growing Focus on Proteomics and Genomics Technologies Research.
6. What are the notable trends driving market growth?
RNA Marker Segment is Expected to Show Significant Growth Over the Forecast Period.
7. Are there any restraints impacting market growth?
Lack of Skilled Healthcare Professionals; Strict Government Regulations.
8. Can you provide examples of recent developments in the market?
November 2022: Creative Enzymes announced the release of their new line of highly efficient and cost-effective DNA markers and ladders, which quickly gained popularity in the research market.
9. What pricing options are available for accessing the report?
Pricing options include single-user, multi-user, and enterprise licenses priced at USD 4750, USD 5250, and USD 8750 respectively.
10. Is the market size provided in terms of value or volume?
The market size is provided in terms of value, measured in Million and volume, measured in K Unit.
11. Are there any specific market keywords associated with the report?
Yes, the market keyword associated with the report is "Molecular Weight Marker Market," which aids in identifying and referencing the specific market segment covered.
12. How do I determine which pricing option suits my needs best?
The pricing options vary based on user requirements and access needs. Individual users may opt for single-user licenses, while businesses requiring broader access may choose multi-user or enterprise licenses for cost-effective access to the report.
13. Are there any additional resources or data provided in the Molecular Weight Marker Market report?
While the report offers comprehensive insights, it's advisable to review the specific contents or supplementary materials provided to ascertain if additional resources or data are available.
14. How can I stay updated on further developments or reports in the Molecular Weight Marker Market?
To stay informed about further developments, trends, and reports in the Molecular Weight Marker Market, consider subscribing to industry newsletters, following relevant companies and organizations, or regularly checking reputable industry news sources and publications.
Methodology
Step 1 - Identification of Relevant Samples Size from Population Database


Step 2 - Approaches for Defining Global Market Size (Value, Volume* & Price*)

Note*: In applicable scenarios
Step 3 - Data Sources
Primary Research
- Web Analytics
- Survey Reports
- Research Institute
- Latest Research Reports
- Opinion Leaders
Secondary Research
- Annual Reports
- White Paper
- Latest Press Release
- Industry Association
- Paid Database
- Investor Presentations

Step 4 - Data Triangulation
Involves using different sources of information in order to increase the validity of a study
These sources are likely to be stakeholders in a program - participants, other researchers, program staff, other community members, and so on.
Then we put all data in single framework & apply various statistical tools to find out the dynamic on the market.
During the analysis stage, feedback from the stakeholder groups would be compared to determine areas of agreement as well as areas of divergence
