

Key Insights
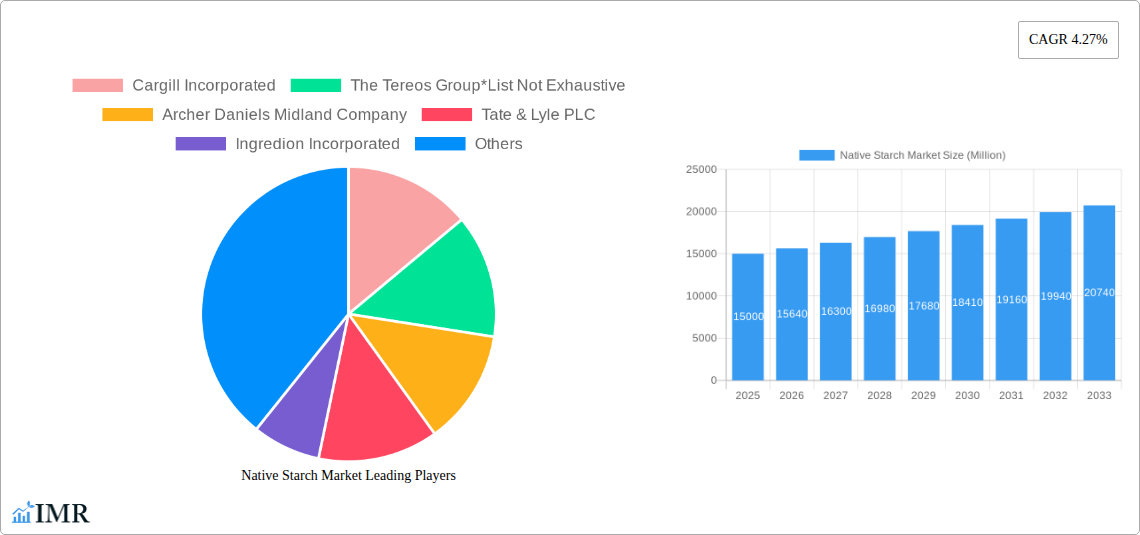
The global native starch market, valued at approximately $XX million in 2025, is projected to experience steady growth, exhibiting a compound annual growth rate (CAGR) of 4.27% from 2025 to 2033. This expansion is driven primarily by the increasing demand for starch in the food and beverage industries, fueled by rising global populations and changing dietary habits. The growing preference for natural and clean-label ingredients further bolsters market growth, as native starch is a readily available, versatile, and cost-effective natural thickener and stabilizer. Corn, wheat, and cassava remain dominant sources of native starch, although the market is seeing increased interest in potato starch due to its unique functional properties. Geographic segmentation reveals significant market shares for North America and Europe, owing to established food processing industries and high consumption rates. However, the Asia-Pacific region is poised for significant growth, driven by rapid economic development and expanding food and beverage sectors in countries like China and India. While the market faces challenges like fluctuating raw material prices and potential competition from modified starches, innovative applications in areas such as bioplastics and biofuels offer promising avenues for future expansion.
Key players such as Cargill, Tereos, ADM, Tate & Lyle, Ingredion, Roquette, AGRANA, and Altia Industrial Services are actively shaping the market landscape through strategic partnerships, acquisitions, and product innovation. The increasing emphasis on sustainability and traceability within the food industry is prompting manufacturers to adopt environmentally friendly production practices and sourcing strategies. This focus on sustainable practices is expected to further influence market dynamics and drive consumer preference for native starches derived from responsible and ethically sourced raw materials. Future growth will depend on the successful introduction of new applications, particularly in emerging markets, and further development of value-added starch products catering to specific consumer demands for functionality and health benefits. Competitive pressure necessitates constant innovation to maintain market share and meet evolving consumer preferences.
Native Starch Market: A Comprehensive Report (2019-2033)
This in-depth report provides a comprehensive analysis of the Native Starch Market, encompassing market dynamics, growth trends, regional dominance, product landscape, key players, and future outlook. The report covers the period 2019-2033, with 2025 serving as the base and estimated year. The study meticulously examines the parent market (Starch Market) and its child segment (Native Starch Market), offering granular insights for informed decision-making. The market size is presented in million units.
Keywords: Native Starch Market, Starch Market, Corn Starch, Wheat Starch, Cassava Starch, Potato Starch, Food Starch, Beverage Starch, Cargill, Tereos, ADM, Tate & Lyle, Ingredion, Roquette, AGRANA, Altia, Market Size, Market Share, CAGR, Market Growth, Industry Trends, Competitive Landscape, Market Analysis, Market Forecast.
Native Starch Market Market Dynamics & Structure
The Native Starch Market, a significant segment within the broader starch market, exhibits a moderately concentrated structure. Leading players like Cargill Incorporated, The Tereos Group, Archer Daniels Midland Company, Tate & Lyle PLC, Ingredion Incorporated, Roquette Freres, AGRANA Beteiligungs AG, and Altia Industrial Services hold substantial market share, though the exact percentages vary by region and application. Technological innovation, primarily focused on enhancing starch properties for specific applications (e.g., improved viscosity, texture, and functionality), is a key driver. Regulatory frameworks, particularly concerning food safety and labeling, significantly influence market dynamics. Competition from alternative thickeners and stabilizers (e.g., hydrocolloids, modified starches) poses a challenge. M&A activity has been relatively moderate in recent years, with xx deals recorded between 2019 and 2024, primarily focused on expanding geographical reach and product portfolios. End-user demographics, especially the growing demand from the food and beverage industries in developing economies, are shaping market growth.
- Market Concentration: Moderately concentrated, with top players holding xx% of the market share in 2024.
- Technological Innovation: Focus on enhanced properties (viscosity, texture) for specific applications.
- Regulatory Landscape: Stringent food safety and labeling regulations impacting market dynamics.
- Competitive Substitutes: Hydrocolloids, modified starches present competition.
- M&A Activity: xx deals between 2019 and 2024, mostly for geographical expansion and product diversification.
- Innovation Barriers: High R&D costs, stringent regulatory approvals.
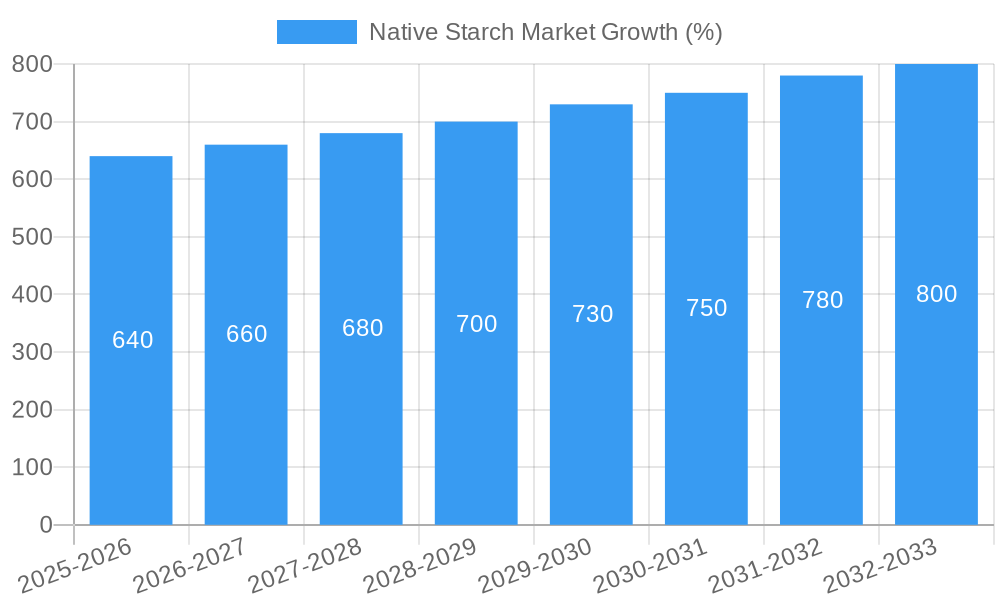
Native Starch Market Growth Trends & Insights
The Native Starch Market witnessed a CAGR of xx% during the historical period (2019-2024), reaching a market size of xx million units in 2024. This growth is primarily fueled by increasing demand from the food and beverage industries, driven by rising global populations and changing dietary habits. The adoption rate of native starches in various applications, particularly in processed foods and beverages, has steadily increased. Technological advancements, including improved extraction and processing techniques, have enhanced product quality and efficiency, further accelerating market growth. Consumer preferences for natural and clean-label ingredients have also positively influenced the market. The forecast period (2025-2033) projects a CAGR of xx%, with the market expected to reach xx million units by 2033. This growth will be influenced by factors such as expanding applications in other industries (e.g., pharmaceuticals, textiles), sustainable sourcing initiatives, and innovations in starch modification technologies.
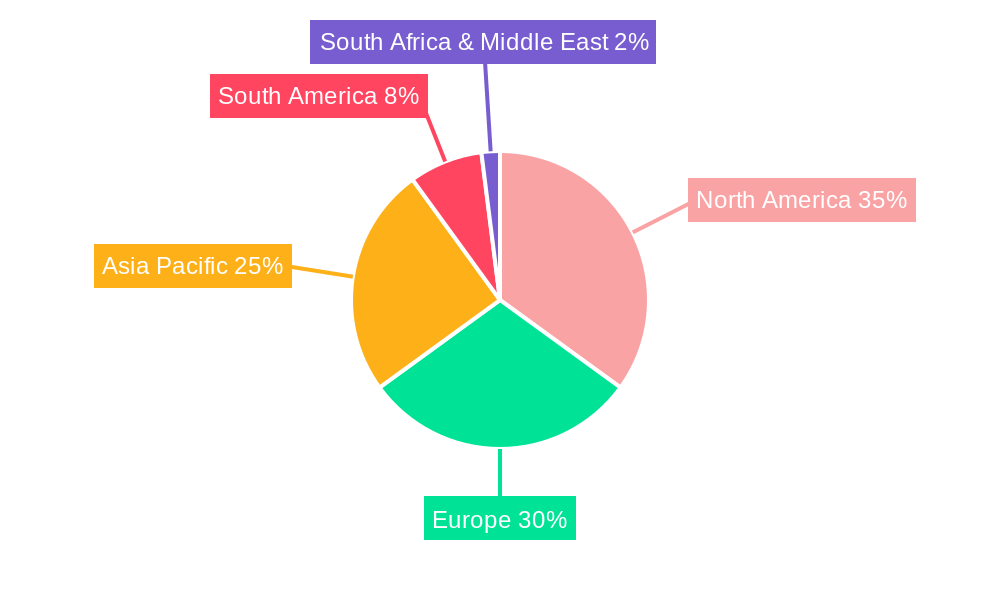
Dominant Regions, Countries, or Segments in Native Starch Market
Asia-Pacific dominates the Native Starch Market, accounting for xx% of the global market share in 2024. This dominance is attributable to factors such as a large and growing population, rapid economic development, rising disposable incomes, and a burgeoning food processing industry. Within this region, countries like China and India are major consumers of native starches. Among the source segments, Corn starch holds the largest share, followed by wheat and cassava. In terms of applications, the food industry remains the primary driver, contributing xx% of total demand in 2024. The beverage industry shows significant growth potential, with a projected CAGR of xx% during the forecast period.
- Key Drivers in Asia-Pacific: Rapid economic growth, rising population, expanding food processing sector.
- Dominant Source: Corn starch, owing to its wide availability and cost-effectiveness.
- Leading Application: Food industry, followed by the beverage sector.
- Growth Potential: Beverage industry, with increased adoption of natural thickeners and stabilizers.
Native Starch Market Product Landscape
Native starch products are characterized by their diverse functionalities, stemming from their varying origins (corn, wheat, cassava, potato, etc.). Innovations focus on enhancing specific properties like viscosity, clarity, and gelling capacity to cater to diverse applications. Technological advancements in extraction and purification processes contribute to improved product quality and consistency. Unique selling propositions often revolve around origin (e.g., organic, non-GMO), specific functionalities, and sustainable sourcing practices.
Key Drivers, Barriers & Challenges in Native Starch Market
Key Drivers: Growing demand from food and beverage industries, increasing consumer preference for natural ingredients, advancements in extraction and processing technologies, and expansion into new applications.
Challenges: Fluctuations in raw material prices, stringent regulatory compliance requirements, intense competition from synthetic alternatives, and supply chain disruptions due to geopolitical uncertainties. These factors can significantly impact profitability and market growth. For example, a 10% increase in corn prices could reduce profitability by xx%.
Emerging Opportunities in Native Starch Market
Emerging opportunities lie in expanding into untapped markets in developing regions, particularly in Africa and Latin America. Innovative applications in areas like bioplastics, biofuels, and pharmaceuticals offer significant growth potential. Evolving consumer preferences toward healthier and more sustainable products drive demand for organically sourced and sustainably produced native starches.
Growth Accelerators in the Native Starch Market Industry
Technological breakthroughs in starch modification, allowing for tailored functionalities, are driving growth. Strategic partnerships between starch producers and food and beverage companies ensure consistent supply and customized product development. Market expansion strategies, focusing on emerging economies and diverse applications, are key growth catalysts.
Key Players Shaping the Native Starch Market Market
- Cargill Incorporated
- The Tereos Group
- Archer Daniels Midland Company
- Tate & Lyle PLC
- Ingredion Incorporated
- Roquette Freres
- AGRANA Beteiligungs AG
- Altia Industrial Services
Notable Milestones in Native Starch Market Sector
- 2022-Q3: Ingredion Incorporated launched a new line of sustainably sourced corn starch.
- 2023-Q1: Cargill Incorporated announced a strategic partnership with a major beverage company.
- 2024-Q2: Roquette Freres invested in a new production facility for cassava starch.
- (Further milestones to be added based on available data)
In-Depth Native Starch Market Market Outlook
The Native Starch Market is poised for significant growth in the coming years, driven by several factors, including the rising global demand for natural and sustainable food ingredients, expanding applications in various industries beyond food and beverage, and continuous technological innovations. Strategic partnerships and investments in research and development are expected to play a crucial role in shaping future market dynamics. The market presents substantial opportunities for existing players and new entrants who can leverage innovative products, sustainable practices, and efficient supply chains.
Native Starch Market Segmentation
-
1. Source
- 1.1. Corn
- 1.2. Wheat
- 1.3. Cassava
- 1.4. Potato
- 1.5. Other Sources
-
2. Application
-
2.1. Food
- 2.1.1. Bakery
- 2.1.2. Confectionery
- 2.1.3. Soups and Sauces
- 2.1.4. Other Processed Foods
- 2.2. Beverage
- 2.3. Other Applications
-
2.1. Food
Native Starch Market Segmentation By Geography
-
1. North America
- 1.1. United States
- 1.2. Canada
- 1.3. Mexico
- 1.4. Rest of North America
-
2. Europe
- 2.1. Spain
- 2.2. United Kingdom
- 2.3. Germany
- 2.4. France
- 2.5. Italy
- 2.6. Rest of Europe
-
3. Asia Pacific
- 3.1. China
- 3.2. Japan
- 3.3. India
- 3.4. Australia
- 3.5. Rest of Asia Pacific
-
4. South America
- 4.1. Brazil
- 4.2. Argentina
- 4.3. Rest of South America
- 5. Middle East
-
6. South Africa
- 6.1. Saudi Arabia
- 6.2. Rest of Middle East
Native Starch Market REPORT HIGHLIGHTS
| Aspects | Details |
|---|---|
| Study Period | 2019-2033 |
| Base Year | 2024 |
| Estimated Year | 2025 |
| Forecast Period | 2025-2033 |
| Historical Period | 2019-2024 |
| Growth Rate | CAGR of 4.27% from 2019-2033 |
| Segmentation |
|
Table of Contents
- 1. Introduction
- 1.1. Research Scope
- 1.2. Market Segmentation
- 1.3. Research Methodology
- 1.4. Definitions and Assumptions
- 2. Executive Summary
- 2.1. Introduction
- 3. Market Dynamics
- 3.1. Introduction
- 3.2. Market Drivers
- 3.2.1. Growing Demand for Plant Based Alternatives; Expanding Application of Pea Protein Toward Food Fortification
- 3.3. Market Restrains
- 3.3.1. Low Awareness and Application of the Additive
- 3.4. Market Trends
- 3.4.1 Increasing Investment in the Starch Market
- 3.4.2 to Strengthen the Growth
- 4. Market Factor Analysis
- 4.1. Porters Five Forces
- 4.2. Supply/Value Chain
- 4.3. PESTEL analysis
- 4.4. Market Entropy
- 4.5. Patent/Trademark Analysis
- 5. Global Native Starch Market Analysis, Insights and Forecast, 2019-2031
- 5.1. Market Analysis, Insights and Forecast - by Source
- 5.1.1. Corn
- 5.1.2. Wheat
- 5.1.3. Cassava
- 5.1.4. Potato
- 5.1.5. Other Sources
- 5.2. Market Analysis, Insights and Forecast - by Application
- 5.2.1. Food
- 5.2.1.1. Bakery
- 5.2.1.2. Confectionery
- 5.2.1.3. Soups and Sauces
- 5.2.1.4. Other Processed Foods
- 5.2.2. Beverage
- 5.2.3. Other Applications
- 5.2.1. Food
- 5.3. Market Analysis, Insights and Forecast - by Region
- 5.3.1. North America
- 5.3.2. Europe
- 5.3.3. Asia Pacific
- 5.3.4. South America
- 5.3.5. Middle East
- 5.3.6. South Africa
- 5.1. Market Analysis, Insights and Forecast - by Source
- 6. North America Native Starch Market Analysis, Insights and Forecast, 2019-2031
- 6.1. Market Analysis, Insights and Forecast - by Source
- 6.1.1. Corn
- 6.1.2. Wheat
- 6.1.3. Cassava
- 6.1.4. Potato
- 6.1.5. Other Sources
- 6.2. Market Analysis, Insights and Forecast - by Application
- 6.2.1. Food
- 6.2.1.1. Bakery
- 6.2.1.2. Confectionery
- 6.2.1.3. Soups and Sauces
- 6.2.1.4. Other Processed Foods
- 6.2.2. Beverage
- 6.2.3. Other Applications
- 6.2.1. Food
- 6.1. Market Analysis, Insights and Forecast - by Source
- 7. Europe Native Starch Market Analysis, Insights and Forecast, 2019-2031
- 7.1. Market Analysis, Insights and Forecast - by Source
- 7.1.1. Corn
- 7.1.2. Wheat
- 7.1.3. Cassava
- 7.1.4. Potato
- 7.1.5. Other Sources
- 7.2. Market Analysis, Insights and Forecast - by Application
- 7.2.1. Food
- 7.2.1.1. Bakery
- 7.2.1.2. Confectionery
- 7.2.1.3. Soups and Sauces
- 7.2.1.4. Other Processed Foods
- 7.2.2. Beverage
- 7.2.3. Other Applications
- 7.2.1. Food
- 7.1. Market Analysis, Insights and Forecast - by Source
- 8. Asia Pacific Native Starch Market Analysis, Insights and Forecast, 2019-2031
- 8.1. Market Analysis, Insights and Forecast - by Source
- 8.1.1. Corn
- 8.1.2. Wheat
- 8.1.3. Cassava
- 8.1.4. Potato
- 8.1.5. Other Sources
- 8.2. Market Analysis, Insights and Forecast - by Application
- 8.2.1. Food
- 8.2.1.1. Bakery
- 8.2.1.2. Confectionery
- 8.2.1.3. Soups and Sauces
- 8.2.1.4. Other Processed Foods
- 8.2.2. Beverage
- 8.2.3. Other Applications
- 8.2.1. Food
- 8.1. Market Analysis, Insights and Forecast - by Source
- 9. South America Native Starch Market Analysis, Insights and Forecast, 2019-2031
- 9.1. Market Analysis, Insights and Forecast - by Source
- 9.1.1. Corn
- 9.1.2. Wheat
- 9.1.3. Cassava
- 9.1.4. Potato
- 9.1.5. Other Sources
- 9.2. Market Analysis, Insights and Forecast - by Application
- 9.2.1. Food
- 9.2.1.1. Bakery
- 9.2.1.2. Confectionery
- 9.2.1.3. Soups and Sauces
- 9.2.1.4. Other Processed Foods
- 9.2.2. Beverage
- 9.2.3. Other Applications
- 9.2.1. Food
- 9.1. Market Analysis, Insights and Forecast - by Source
- 10. Middle East Native Starch Market Analysis, Insights and Forecast, 2019-2031
- 10.1. Market Analysis, Insights and Forecast - by Source
- 10.1.1. Corn
- 10.1.2. Wheat
- 10.1.3. Cassava
- 10.1.4. Potato
- 10.1.5. Other Sources
- 10.2. Market Analysis, Insights and Forecast - by Application
- 10.2.1. Food
- 10.2.1.1. Bakery
- 10.2.1.2. Confectionery
- 10.2.1.3. Soups and Sauces
- 10.2.1.4. Other Processed Foods
- 10.2.2. Beverage
- 10.2.3. Other Applications
- 10.2.1. Food
- 10.1. Market Analysis, Insights and Forecast - by Source
- 11. South Africa Native Starch Market Analysis, Insights and Forecast, 2019-2031
- 11.1. Market Analysis, Insights and Forecast - by Source
- 11.1.1. Corn
- 11.1.2. Wheat
- 11.1.3. Cassava
- 11.1.4. Potato
- 11.1.5. Other Sources
- 11.2. Market Analysis, Insights and Forecast - by Application
- 11.2.1. Food
- 11.2.1.1. Bakery
- 11.2.1.2. Confectionery
- 11.2.1.3. Soups and Sauces
- 11.2.1.4. Other Processed Foods
- 11.2.2. Beverage
- 11.2.3. Other Applications
- 11.2.1. Food
- 11.1. Market Analysis, Insights and Forecast - by Source
- 12. North America Native Starch Market Analysis, Insights and Forecast, 2019-2031
- 12.1. Market Analysis, Insights and Forecast - By Country/Sub-region
- 12.1.1 United States
- 12.1.2 Canada
- 12.1.3 Mexico
- 12.1.4 Rest of North America
- 13. Europe Native Starch Market Analysis, Insights and Forecast, 2019-2031
- 13.1. Market Analysis, Insights and Forecast - By Country/Sub-region
- 13.1.1 Spain
- 13.1.2 United Kingdom
- 13.1.3 Germany
- 13.1.4 France
- 13.1.5 Italy
- 13.1.6 Rest of Europe
- 14. Asia Pacific Native Starch Market Analysis, Insights and Forecast, 2019-2031
- 14.1. Market Analysis, Insights and Forecast - By Country/Sub-region
- 14.1.1 China
- 14.1.2 Japan
- 14.1.3 India
- 14.1.4 Australia
- 14.1.5 Rest of Asia Pacific
- 15. South America Native Starch Market Analysis, Insights and Forecast, 2019-2031
- 15.1. Market Analysis, Insights and Forecast - By Country/Sub-region
- 15.1.1 Brazil
- 15.1.2 Argentina
- 15.1.3 Rest of South America
- 16. South Africa Native Starch Market Analysis, Insights and Forecast, 2019-2031
- 16.1. Market Analysis, Insights and Forecast - By Country/Sub-region
- 16.1.1 Saudi Arabia
- 16.1.2 Rest of Middle East
- 17. Competitive Analysis
- 17.1. Global Market Share Analysis 2024
- 17.2. Company Profiles
- 17.2.1 Cargill Incorporated
- 17.2.1.1. Overview
- 17.2.1.2. Products
- 17.2.1.3. SWOT Analysis
- 17.2.1.4. Recent Developments
- 17.2.1.5. Financials (Based on Availability)
- 17.2.2 The Tereos Group*List Not Exhaustive
- 17.2.2.1. Overview
- 17.2.2.2. Products
- 17.2.2.3. SWOT Analysis
- 17.2.2.4. Recent Developments
- 17.2.2.5. Financials (Based on Availability)
- 17.2.3 Archer Daniels Midland Company
- 17.2.3.1. Overview
- 17.2.3.2. Products
- 17.2.3.3. SWOT Analysis
- 17.2.3.4. Recent Developments
- 17.2.3.5. Financials (Based on Availability)
- 17.2.4 Tate & Lyle PLC
- 17.2.4.1. Overview
- 17.2.4.2. Products
- 17.2.4.3. SWOT Analysis
- 17.2.4.4. Recent Developments
- 17.2.4.5. Financials (Based on Availability)
- 17.2.5 Ingredion Incorporated
- 17.2.5.1. Overview
- 17.2.5.2. Products
- 17.2.5.3. SWOT Analysis
- 17.2.5.4. Recent Developments
- 17.2.5.5. Financials (Based on Availability)
- 17.2.6 Roquette Freres
- 17.2.6.1. Overview
- 17.2.6.2. Products
- 17.2.6.3. SWOT Analysis
- 17.2.6.4. Recent Developments
- 17.2.6.5. Financials (Based on Availability)
- 17.2.7 AGRANA Beteiligungs AG
- 17.2.7.1. Overview
- 17.2.7.2. Products
- 17.2.7.3. SWOT Analysis
- 17.2.7.4. Recent Developments
- 17.2.7.5. Financials (Based on Availability)
- 17.2.8 Altia Industrial Services
- 17.2.8.1. Overview
- 17.2.8.2. Products
- 17.2.8.3. SWOT Analysis
- 17.2.8.4. Recent Developments
- 17.2.8.5. Financials (Based on Availability)
- 17.2.1 Cargill Incorporated
List of Figures
- Figure 1: Global Native Starch Market Revenue Breakdown (Million, %) by Region 2024 & 2032
- Figure 2: North America Native Starch Market Revenue (Million), by Country 2024 & 2032
- Figure 3: North America Native Starch Market Revenue Share (%), by Country 2024 & 2032
- Figure 4: Europe Native Starch Market Revenue (Million), by Country 2024 & 2032
- Figure 5: Europe Native Starch Market Revenue Share (%), by Country 2024 & 2032
- Figure 6: Asia Pacific Native Starch Market Revenue (Million), by Country 2024 & 2032
- Figure 7: Asia Pacific Native Starch Market Revenue Share (%), by Country 2024 & 2032
- Figure 8: South America Native Starch Market Revenue (Million), by Country 2024 & 2032
- Figure 9: South America Native Starch Market Revenue Share (%), by Country 2024 & 2032
- Figure 10: South Africa Native Starch Market Revenue (Million), by Country 2024 & 2032
- Figure 11: South Africa Native Starch Market Revenue Share (%), by Country 2024 & 2032
- Figure 12: North America Native Starch Market Revenue (Million), by Source 2024 & 2032
- Figure 13: North America Native Starch Market Revenue Share (%), by Source 2024 & 2032
- Figure 14: North America Native Starch Market Revenue (Million), by Application 2024 & 2032
- Figure 15: North America Native Starch Market Revenue Share (%), by Application 2024 & 2032
- Figure 16: North America Native Starch Market Revenue (Million), by Country 2024 & 2032
- Figure 17: North America Native Starch Market Revenue Share (%), by Country 2024 & 2032
- Figure 18: Europe Native Starch Market Revenue (Million), by Source 2024 & 2032
- Figure 19: Europe Native Starch Market Revenue Share (%), by Source 2024 & 2032
- Figure 20: Europe Native Starch Market Revenue (Million), by Application 2024 & 2032
- Figure 21: Europe Native Starch Market Revenue Share (%), by Application 2024 & 2032
- Figure 22: Europe Native Starch Market Revenue (Million), by Country 2024 & 2032
- Figure 23: Europe Native Starch Market Revenue Share (%), by Country 2024 & 2032
- Figure 24: Asia Pacific Native Starch Market Revenue (Million), by Source 2024 & 2032
- Figure 25: Asia Pacific Native Starch Market Revenue Share (%), by Source 2024 & 2032
- Figure 26: Asia Pacific Native Starch Market Revenue (Million), by Application 2024 & 2032
- Figure 27: Asia Pacific Native Starch Market Revenue Share (%), by Application 2024 & 2032
- Figure 28: Asia Pacific Native Starch Market Revenue (Million), by Country 2024 & 2032
- Figure 29: Asia Pacific Native Starch Market Revenue Share (%), by Country 2024 & 2032
- Figure 30: South America Native Starch Market Revenue (Million), by Source 2024 & 2032
- Figure 31: South America Native Starch Market Revenue Share (%), by Source 2024 & 2032
- Figure 32: South America Native Starch Market Revenue (Million), by Application 2024 & 2032
- Figure 33: South America Native Starch Market Revenue Share (%), by Application 2024 & 2032
- Figure 34: South America Native Starch Market Revenue (Million), by Country 2024 & 2032
- Figure 35: South America Native Starch Market Revenue Share (%), by Country 2024 & 2032
- Figure 36: Middle East Native Starch Market Revenue (Million), by Source 2024 & 2032
- Figure 37: Middle East Native Starch Market Revenue Share (%), by Source 2024 & 2032
- Figure 38: Middle East Native Starch Market Revenue (Million), by Application 2024 & 2032
- Figure 39: Middle East Native Starch Market Revenue Share (%), by Application 2024 & 2032
- Figure 40: Middle East Native Starch Market Revenue (Million), by Country 2024 & 2032
- Figure 41: Middle East Native Starch Market Revenue Share (%), by Country 2024 & 2032
- Figure 42: South Africa Native Starch Market Revenue (Million), by Source 2024 & 2032
- Figure 43: South Africa Native Starch Market Revenue Share (%), by Source 2024 & 2032
- Figure 44: South Africa Native Starch Market Revenue (Million), by Application 2024 & 2032
- Figure 45: South Africa Native Starch Market Revenue Share (%), by Application 2024 & 2032
- Figure 46: South Africa Native Starch Market Revenue (Million), by Country 2024 & 2032
- Figure 47: South Africa Native Starch Market Revenue Share (%), by Country 2024 & 2032
List of Tables
- Table 1: Global Native Starch Market Revenue Million Forecast, by Region 2019 & 2032
- Table 2: Global Native Starch Market Revenue Million Forecast, by Source 2019 & 2032
- Table 3: Global Native Starch Market Revenue Million Forecast, by Application 2019 & 2032
- Table 4: Global Native Starch Market Revenue Million Forecast, by Region 2019 & 2032
- Table 5: Global Native Starch Market Revenue Million Forecast, by Country 2019 & 2032
- Table 6: United States Native Starch Market Revenue (Million) Forecast, by Application 2019 & 2032
- Table 7: Canada Native Starch Market Revenue (Million) Forecast, by Application 2019 & 2032
- Table 8: Mexico Native Starch Market Revenue (Million) Forecast, by Application 2019 & 2032
- Table 9: Rest of North America Native Starch Market Revenue (Million) Forecast, by Application 2019 & 2032
- Table 10: Global Native Starch Market Revenue Million Forecast, by Country 2019 & 2032
- Table 11: Spain Native Starch Market Revenue (Million) Forecast, by Application 2019 & 2032
- Table 12: United Kingdom Native Starch Market Revenue (Million) Forecast, by Application 2019 & 2032
- Table 13: Germany Native Starch Market Revenue (Million) Forecast, by Application 2019 & 2032
- Table 14: France Native Starch Market Revenue (Million) Forecast, by Application 2019 & 2032
- Table 15: Italy Native Starch Market Revenue (Million) Forecast, by Application 2019 & 2032
- Table 16: Rest of Europe Native Starch Market Revenue (Million) Forecast, by Application 2019 & 2032
- Table 17: Global Native Starch Market Revenue Million Forecast, by Country 2019 & 2032
- Table 18: China Native Starch Market Revenue (Million) Forecast, by Application 2019 & 2032
- Table 19: Japan Native Starch Market Revenue (Million) Forecast, by Application 2019 & 2032
- Table 20: India Native Starch Market Revenue (Million) Forecast, by Application 2019 & 2032
- Table 21: Australia Native Starch Market Revenue (Million) Forecast, by Application 2019 & 2032
- Table 22: Rest of Asia Pacific Native Starch Market Revenue (Million) Forecast, by Application 2019 & 2032
- Table 23: Global Native Starch Market Revenue Million Forecast, by Country 2019 & 2032
- Table 24: Brazil Native Starch Market Revenue (Million) Forecast, by Application 2019 & 2032
- Table 25: Argentina Native Starch Market Revenue (Million) Forecast, by Application 2019 & 2032
- Table 26: Rest of South America Native Starch Market Revenue (Million) Forecast, by Application 2019 & 2032
- Table 27: Global Native Starch Market Revenue Million Forecast, by Country 2019 & 2032
- Table 28: Saudi Arabia Native Starch Market Revenue (Million) Forecast, by Application 2019 & 2032
- Table 29: Rest of Middle East Native Starch Market Revenue (Million) Forecast, by Application 2019 & 2032
- Table 30: Global Native Starch Market Revenue Million Forecast, by Source 2019 & 2032
- Table 31: Global Native Starch Market Revenue Million Forecast, by Application 2019 & 2032
- Table 32: Global Native Starch Market Revenue Million Forecast, by Country 2019 & 2032
- Table 33: United States Native Starch Market Revenue (Million) Forecast, by Application 2019 & 2032
- Table 34: Canada Native Starch Market Revenue (Million) Forecast, by Application 2019 & 2032
- Table 35: Mexico Native Starch Market Revenue (Million) Forecast, by Application 2019 & 2032
- Table 36: Rest of North America Native Starch Market Revenue (Million) Forecast, by Application 2019 & 2032
- Table 37: Global Native Starch Market Revenue Million Forecast, by Source 2019 & 2032
- Table 38: Global Native Starch Market Revenue Million Forecast, by Application 2019 & 2032
- Table 39: Global Native Starch Market Revenue Million Forecast, by Country 2019 & 2032
- Table 40: Spain Native Starch Market Revenue (Million) Forecast, by Application 2019 & 2032
- Table 41: United Kingdom Native Starch Market Revenue (Million) Forecast, by Application 2019 & 2032
- Table 42: Germany Native Starch Market Revenue (Million) Forecast, by Application 2019 & 2032
- Table 43: France Native Starch Market Revenue (Million) Forecast, by Application 2019 & 2032
- Table 44: Italy Native Starch Market Revenue (Million) Forecast, by Application 2019 & 2032
- Table 45: Rest of Europe Native Starch Market Revenue (Million) Forecast, by Application 2019 & 2032
- Table 46: Global Native Starch Market Revenue Million Forecast, by Source 2019 & 2032
- Table 47: Global Native Starch Market Revenue Million Forecast, by Application 2019 & 2032
- Table 48: Global Native Starch Market Revenue Million Forecast, by Country 2019 & 2032
- Table 49: China Native Starch Market Revenue (Million) Forecast, by Application 2019 & 2032
- Table 50: Japan Native Starch Market Revenue (Million) Forecast, by Application 2019 & 2032
- Table 51: India Native Starch Market Revenue (Million) Forecast, by Application 2019 & 2032
- Table 52: Australia Native Starch Market Revenue (Million) Forecast, by Application 2019 & 2032
- Table 53: Rest of Asia Pacific Native Starch Market Revenue (Million) Forecast, by Application 2019 & 2032
- Table 54: Global Native Starch Market Revenue Million Forecast, by Source 2019 & 2032
- Table 55: Global Native Starch Market Revenue Million Forecast, by Application 2019 & 2032
- Table 56: Global Native Starch Market Revenue Million Forecast, by Country 2019 & 2032
- Table 57: Brazil Native Starch Market Revenue (Million) Forecast, by Application 2019 & 2032
- Table 58: Argentina Native Starch Market Revenue (Million) Forecast, by Application 2019 & 2032
- Table 59: Rest of South America Native Starch Market Revenue (Million) Forecast, by Application 2019 & 2032
- Table 60: Global Native Starch Market Revenue Million Forecast, by Source 2019 & 2032
- Table 61: Global Native Starch Market Revenue Million Forecast, by Application 2019 & 2032
- Table 62: Global Native Starch Market Revenue Million Forecast, by Country 2019 & 2032
- Table 63: Global Native Starch Market Revenue Million Forecast, by Source 2019 & 2032
- Table 64: Global Native Starch Market Revenue Million Forecast, by Application 2019 & 2032
- Table 65: Global Native Starch Market Revenue Million Forecast, by Country 2019 & 2032
- Table 66: Saudi Arabia Native Starch Market Revenue (Million) Forecast, by Application 2019 & 2032
- Table 67: Rest of Middle East Native Starch Market Revenue (Million) Forecast, by Application 2019 & 2032
Frequently Asked Questions
1. What is the projected Compound Annual Growth Rate (CAGR) of the Native Starch Market?
The projected CAGR is approximately 4.27%.
2. Which companies are prominent players in the Native Starch Market?
Key companies in the market include Cargill Incorporated, The Tereos Group*List Not Exhaustive, Archer Daniels Midland Company, Tate & Lyle PLC, Ingredion Incorporated, Roquette Freres, AGRANA Beteiligungs AG, Altia Industrial Services.
3. What are the main segments of the Native Starch Market?
The market segments include Source, Application.
4. Can you provide details about the market size?
The market size is estimated to be USD XX Million as of 2022.
5. What are some drivers contributing to market growth?
Growing Demand for Plant Based Alternatives; Expanding Application of Pea Protein Toward Food Fortification.
6. What are the notable trends driving market growth?
Increasing Investment in the Starch Market. to Strengthen the Growth.
7. Are there any restraints impacting market growth?
Low Awareness and Application of the Additive.
8. Can you provide examples of recent developments in the market?
N/A
9. What pricing options are available for accessing the report?
Pricing options include single-user, multi-user, and enterprise licenses priced at USD 4750, USD 5250, and USD 8750 respectively.
10. Is the market size provided in terms of value or volume?
The market size is provided in terms of value, measured in Million.
11. Are there any specific market keywords associated with the report?
Yes, the market keyword associated with the report is "Native Starch Market," which aids in identifying and referencing the specific market segment covered.
12. How do I determine which pricing option suits my needs best?
The pricing options vary based on user requirements and access needs. Individual users may opt for single-user licenses, while businesses requiring broader access may choose multi-user or enterprise licenses for cost-effective access to the report.
13. Are there any additional resources or data provided in the Native Starch Market report?
While the report offers comprehensive insights, it's advisable to review the specific contents or supplementary materials provided to ascertain if additional resources or data are available.
14. How can I stay updated on further developments or reports in the Native Starch Market?
To stay informed about further developments, trends, and reports in the Native Starch Market, consider subscribing to industry newsletters, following relevant companies and organizations, or regularly checking reputable industry news sources and publications.
Methodology
Step 1 - Identification of Relevant Samples Size from Population Database


Step 2 - Approaches for Defining Global Market Size (Value, Volume* & Price*)

Note*: In applicable scenarios
Step 3 - Data Sources
Primary Research
- Web Analytics
- Survey Reports
- Research Institute
- Latest Research Reports
- Opinion Leaders
Secondary Research
- Annual Reports
- White Paper
- Latest Press Release
- Industry Association
- Paid Database
- Investor Presentations

Step 4 - Data Triangulation
Involves using different sources of information in order to increase the validity of a study
These sources are likely to be stakeholders in a program - participants, other researchers, program staff, other community members, and so on.
Then we put all data in single framework & apply various statistical tools to find out the dynamic on the market.
During the analysis stage, feedback from the stakeholder groups would be compared to determine areas of agreement as well as areas of divergence
