

Key Insights
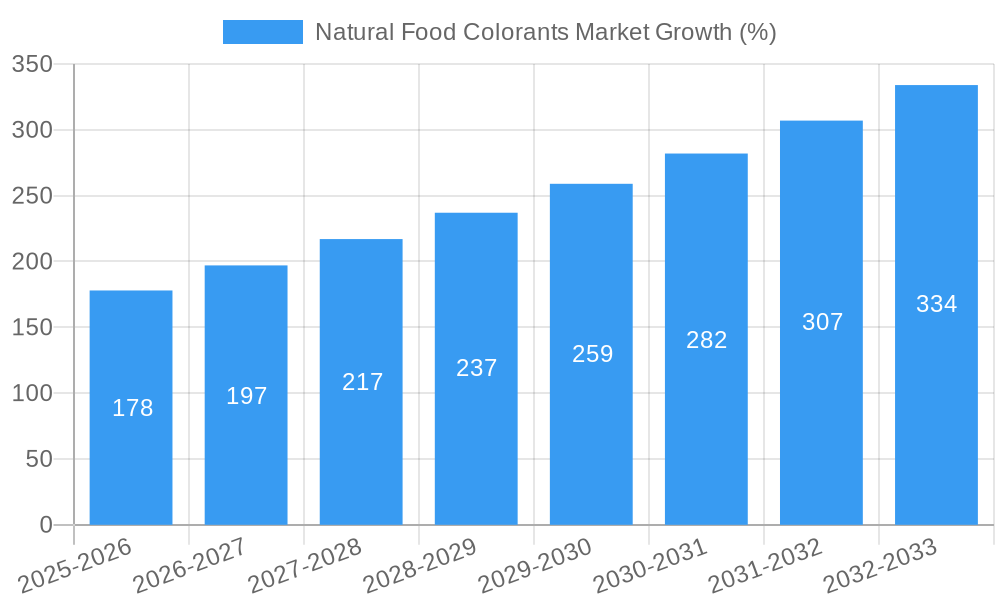
The global natural food colorants market, valued at $2.07 billion in 2025, is projected to experience robust growth, driven by the increasing consumer demand for clean-label products and the rising awareness of the health implications of artificial food colorings. The market's compound annual growth rate (CAGR) of 8.47% from 2019 to 2024 suggests a continued upward trajectory through 2033. Key drivers include the expanding food and beverage industry, particularly in segments like bakery, dairy, confectionery, and beverages, where natural colors enhance product appeal and meet consumer preferences for natural ingredients. Growing health consciousness and concerns about potential side effects of synthetic dyes are further propelling market expansion. The market is segmented by application, with bakery and dairy-based products holding significant shares, followed by confectionery, nutraceuticals, snacks and cereals, and beverages. Major players like Kalsec Inc, DDW Inc, Chr Hansen Holding AS, and Sensient Technologies are strategically investing in research and development to expand their product portfolios and cater to evolving consumer needs. Regional variations exist, with North America and Europe currently dominating the market, however, the Asia-Pacific region presents a significant growth opportunity due to its expanding middle class and increasing demand for processed foods.
While the market demonstrates significant promise, certain challenges persist. Fluctuations in raw material prices and the complexity and cost associated with sourcing and processing natural colorants pose potential restraints. Furthermore, maintaining the stability and consistency of natural colors in different food applications can be technically challenging. However, ongoing innovation in extraction technologies and the development of novel natural colorants are expected to mitigate these challenges. The overall outlook for the natural food colorants market remains exceptionally positive, fueled by increasing consumer preference for natural and clean-label products, along with ongoing technological advancements in the sector. This robust growth is expected to continue throughout the forecast period (2025-2033), driven by the aforementioned factors and a significant expansion in the global food and beverage sector.

Natural Food Colorants Market: A Comprehensive Report (2019-2033)
This in-depth report provides a comprehensive analysis of the Natural Food Colorants market, encompassing market dynamics, growth trends, regional segmentation, product landscape, key players, and future outlook. The study period spans from 2019 to 2033, with 2025 serving as the base and estimated year. The report is crucial for industry professionals, investors, and stakeholders seeking to understand and capitalize on opportunities within this dynamic market segment, a child market under the parent market of Food Additives. The global market is valued at xx Million in 2025 and is projected to reach xx Million by 2033, exhibiting a CAGR of xx% during the forecast period (2025-2033).
Natural Food Colorants Market Dynamics & Structure
The Natural Food Colorants market is characterized by a moderately concentrated structure, with key players such as Kalsec Inc, DDW Inc, Chr. Hansen Holding AS, Sensient Technologies, Givaudan SA, Koninklijke DSM NV, Synthite Industries Private Ltd, Symrise AG, and Archer Daniels Midland Company holding significant market share. However, the market also features a number of smaller, specialized players. Technological innovation plays a crucial role, driven by the demand for more vibrant, stable, and naturally-sourced colors. Stringent regulatory frameworks concerning food safety and labeling influence product development and market access. The increasing consumer preference for natural and clean-label products is a major driver, while synthetic food colorants act as primary competitive substitutes. Mergers and acquisitions (M&A) are frequent, reflecting industry consolidation and the pursuit of technological advancements and broader market reach. The overall market structure is shaped by a complex interplay of factors:
- Market Concentration: The top 10 players account for approximately xx% of the global market share in 2025.
- Technological Innovation: R&D efforts are focused on developing novel extraction methods, improving color stability, and expanding the color palette of natural options.
- Regulatory Landscape: Compliance with regulations regarding labeling, permitted colorants, and safety standards is critical for market entry and sustained growth.
- Competitive Substitutes: Synthetic food colorants continue to pose a challenge to natural alternatives, particularly in terms of cost and performance.
- End-User Demographics: Growing consumer awareness regarding health and wellness is a key driver for natural food colorants.
- M&A Activity: An average of xx M&A deals per year were recorded in the historical period (2019-2024).
Natural Food Colorants Market Growth Trends & Insights
The Natural Food Colorants market has experienced robust growth over the historical period (2019-2024), fueled by several key factors. The rising demand for natural and organic food products, coupled with increasing consumer awareness of the potential health risks associated with artificial food colorings, has significantly boosted the adoption rate of natural alternatives. Technological advancements in extraction techniques and color stabilization have improved the quality and performance of natural food colorants, further driving market growth. Shifting consumer preferences towards clean-label products, transparency in ingredient sourcing, and the growing popularity of plant-based and functional foods are additional key growth drivers. The market is expected to continue its growth trajectory throughout the forecast period, with a significant expansion anticipated in developing economies where the consumption of processed food is on the rise. The CAGR for the forecast period (2025-2033) is projected at xx%, indicating a robust and sustained market expansion. Market penetration is expected to increase from xx% in 2025 to xx% by 2033. Technological disruptions, such as advancements in precision fermentation and bio-manufacturing, will continue to shape the market's future.
Dominant Regions, Countries, or Segments in Natural Food Colorants Market
North America currently holds the largest market share in the global Natural Food Colorants market, driven by the high adoption of natural and organic food products and stringent regulations concerning artificial food coloring. Europe follows closely, with a strong emphasis on natural ingredients and health-conscious consumer behavior. Asia-Pacific is experiencing rapid growth, fueled by the expanding processed food industry and rising disposable incomes. Within the application segments, the Bakery and Confectionery sectors currently dominate, accounting for a combined xx% market share, due to the high volume of colored products in these categories. However, the Nutraceuticals and Beverages segments show significant growth potential, with an anticipated CAGR of xx% and xx% respectively during the forecast period.
- Key Drivers in North America: Strong regulatory environment favoring natural ingredients, high consumer awareness of health benefits.
- Key Drivers in Europe: High demand for clean-label products, stringent regulations on artificial colorings.
- Key Drivers in Asia-Pacific: Growing processed food industry, rising disposable incomes, increasing health consciousness.
- Dominant Application Segments: Bakery and Confectionery demonstrate strong growth driven by high demand for visually appealing and naturally colored products.
Natural Food Colorants Market Product Landscape
The Natural Food Colorants market offers a diverse range of products derived from various natural sources, including fruits, vegetables, and algae. These colorants are available in different forms, such as powders, liquids, and pastes, to cater to various applications. Key innovations include the development of heat-stable colorants, which enhance their application in processed foods, and the expansion of color hues to meet the diverse needs of the food and beverage industry. Unique selling propositions include superior color intensity, excellent stability, and clean-label attributes, making them increasingly attractive to manufacturers. Technological advancements are focused on improving extraction methods, creating new colors using biotechnology, and enhancing color stability across a broader range of processing conditions.
Key Drivers, Barriers & Challenges in Natural Food Colorants Market
Key Drivers: The increasing preference for natural and organic food products, stringent regulations restricting artificial colorants, and growing health consciousness among consumers are the major drivers for market expansion. Technological advancements in extraction and stabilization techniques also contribute to this growth.
Key Challenges and Restraints: The higher cost of production compared to synthetic alternatives presents a major barrier. The limited availability of certain natural colorants and their susceptibility to degradation under specific processing conditions pose additional challenges. Fluctuations in raw material prices and supply chain disruptions can also impact market dynamics, potentially leading to price instability. Regulatory hurdles and varying standards across different regions pose further complexities for manufacturers seeking to expand their operations globally. The competitive landscape is intense, with both established players and new entrants vying for market share.
Emerging Opportunities in Natural Food Colorants Market
Untapped markets in developing economies offer significant growth opportunities. The increasing demand for naturally colored beverages, functional foods, and plant-based products presents a fertile ground for expansion. Innovation in color stability and the development of new hues are crucial for broadening applications. Exploring alternative sources of natural colorants, such as microorganisms and precision fermentation, offers exciting potential for sustainable and cost-effective production. Catering to specific consumer preferences, such as vegan-friendly or allergen-free options, can create further niche opportunities.
Growth Accelerators in the Natural Food Colorants Market Industry
Technological breakthroughs in extraction and purification techniques are accelerating market growth. Strategic partnerships between raw material suppliers, color manufacturers, and food processors are facilitating innovation and market penetration. Market expansion strategies focusing on emerging economies with a growing demand for processed foods and a shift towards clean-label products are key catalysts.
Key Players Shaping the Natural Food Colorants Market Market
- Kalsec Inc
- DDW Inc
- Chr. Hansen Holding AS
- Sensient Technologies
- Givaudan SA
- Koninklijke DSM NV
- Synthite Industries Private Ltd
- Symrise AG
- Archer Daniels Midland Company
Notable Milestones in Natural Food Colorants Market Sector
- April 2016: Sensient® Colors launched SupraRed™, a heat-stable natural red color.
- September 2018: Givaudan SA acquired Naturex, expanding its natural ingredient portfolio.
- October 2020: Chr. Hansen Natural Colors established an R&D center in Montpellier, France.
- January 2021: GNT Group added EXBERRY® Shade Pink - OD to its product line.
In-Depth Natural Food Colorants Market Market Outlook
The Natural Food Colorants market is poised for continued robust growth, driven by strong consumer demand for natural ingredients and technological advancements. Strategic investments in R&D, strategic partnerships, and expansion into untapped markets will be crucial for capturing future opportunities. The focus on sustainability and the exploration of novel sources of natural colorants will further shape the market's trajectory. The long-term outlook is positive, with considerable potential for market expansion and value creation.
Natural Food Colorants Market Segmentation
-
1. Application
- 1.1. Bakery
-
1.2. Dairy-based Products
- 1.2.1. Ice Cream
- 1.2.2. Other Products
-
1.3. Beverages
- 1.3.1. Alcoholic Beverages
- 1.3.2. Non-alcoholic Beverages
- 1.4. Confectionery
- 1.5. Nutraceuticals
- 1.6. Snacks and Cereals
- 1.7. Other Applications
Natural Food Colorants Market Segmentation By Geography
-
1. North America
- 1.1. United States
- 1.2. Canada
- 1.3. Mexico
- 1.4. Rest of North America
-
2. Europe
- 2.1. United Kingdom
- 2.2. Germany
- 2.3. Italy
- 2.4. Russia
- 2.5. Spain
- 2.6. France
- 2.7. Rest of Europe
-
3. Asia Pacific
- 3.1. China
- 3.2. Japan
- 3.3. India
- 3.4. Australia
- 3.5. Rest of Asia Pacific
-
4. South America
- 4.1. Brazil
- 4.2. Argentina
- 4.3. Rest of South America
- 5. Middle East
-
6. United Arab Emirates
- 6.1. Saudi Arabia
- 6.2. Egypt
- 6.3. South Africa
- 6.4. Rest of Middle East

Natural Food Colorants Market REPORT HIGHLIGHTS
| Aspects | Details |
|---|---|
| Study Period | 2019-2033 |
| Base Year | 2024 |
| Estimated Year | 2025 |
| Forecast Period | 2025-2033 |
| Historical Period | 2019-2024 |
| Growth Rate | CAGR of 8.47% from 2019-2033 |
| Segmentation |
|
Table of Contents
- 1. Introduction
- 1.1. Research Scope
- 1.2. Market Segmentation
- 1.3. Research Methodology
- 1.4. Definitions and Assumptions
- 2. Executive Summary
- 2.1. Introduction
- 3. Market Dynamics
- 3.1. Introduction
- 3.2. Market Drivers
- 3.2.1. Rising Health Consciousness among consumer
- 3.3. Market Restrains
- 3.3.1. High Cost of natural Ingredients
- 3.4. Market Trends
- 3.4.1. Brightening Spotlight on Coloring Foodstuff
- 4. Market Factor Analysis
- 4.1. Porters Five Forces
- 4.2. Supply/Value Chain
- 4.3. PESTEL analysis
- 4.4. Market Entropy
- 4.5. Patent/Trademark Analysis
- 5. Global Natural Food Colorants Market Analysis, Insights and Forecast, 2019-2031
- 5.1. Market Analysis, Insights and Forecast - by Application
- 5.1.1. Bakery
- 5.1.2. Dairy-based Products
- 5.1.2.1. Ice Cream
- 5.1.2.2. Other Products
- 5.1.3. Beverages
- 5.1.3.1. Alcoholic Beverages
- 5.1.3.2. Non-alcoholic Beverages
- 5.1.4. Confectionery
- 5.1.5. Nutraceuticals
- 5.1.6. Snacks and Cereals
- 5.1.7. Other Applications
- 5.2. Market Analysis, Insights and Forecast - by Region
- 5.2.1. North America
- 5.2.2. Europe
- 5.2.3. Asia Pacific
- 5.2.4. South America
- 5.2.5. Middle East
- 5.2.6. United Arab Emirates
- 5.1. Market Analysis, Insights and Forecast - by Application
- 6. North America Natural Food Colorants Market Analysis, Insights and Forecast, 2019-2031
- 6.1. Market Analysis, Insights and Forecast - by Application
- 6.1.1. Bakery
- 6.1.2. Dairy-based Products
- 6.1.2.1. Ice Cream
- 6.1.2.2. Other Products
- 6.1.3. Beverages
- 6.1.3.1. Alcoholic Beverages
- 6.1.3.2. Non-alcoholic Beverages
- 6.1.4. Confectionery
- 6.1.5. Nutraceuticals
- 6.1.6. Snacks and Cereals
- 6.1.7. Other Applications
- 6.1. Market Analysis, Insights and Forecast - by Application
- 7. Europe Natural Food Colorants Market Analysis, Insights and Forecast, 2019-2031
- 7.1. Market Analysis, Insights and Forecast - by Application
- 7.1.1. Bakery
- 7.1.2. Dairy-based Products
- 7.1.2.1. Ice Cream
- 7.1.2.2. Other Products
- 7.1.3. Beverages
- 7.1.3.1. Alcoholic Beverages
- 7.1.3.2. Non-alcoholic Beverages
- 7.1.4. Confectionery
- 7.1.5. Nutraceuticals
- 7.1.6. Snacks and Cereals
- 7.1.7. Other Applications
- 7.1. Market Analysis, Insights and Forecast - by Application
- 8. Asia Pacific Natural Food Colorants Market Analysis, Insights and Forecast, 2019-2031
- 8.1. Market Analysis, Insights and Forecast - by Application
- 8.1.1. Bakery
- 8.1.2. Dairy-based Products
- 8.1.2.1. Ice Cream
- 8.1.2.2. Other Products
- 8.1.3. Beverages
- 8.1.3.1. Alcoholic Beverages
- 8.1.3.2. Non-alcoholic Beverages
- 8.1.4. Confectionery
- 8.1.5. Nutraceuticals
- 8.1.6. Snacks and Cereals
- 8.1.7. Other Applications
- 8.1. Market Analysis, Insights and Forecast - by Application
- 9. South America Natural Food Colorants Market Analysis, Insights and Forecast, 2019-2031
- 9.1. Market Analysis, Insights and Forecast - by Application
- 9.1.1. Bakery
- 9.1.2. Dairy-based Products
- 9.1.2.1. Ice Cream
- 9.1.2.2. Other Products
- 9.1.3. Beverages
- 9.1.3.1. Alcoholic Beverages
- 9.1.3.2. Non-alcoholic Beverages
- 9.1.4. Confectionery
- 9.1.5. Nutraceuticals
- 9.1.6. Snacks and Cereals
- 9.1.7. Other Applications
- 9.1. Market Analysis, Insights and Forecast - by Application
- 10. Middle East Natural Food Colorants Market Analysis, Insights and Forecast, 2019-2031
- 10.1. Market Analysis, Insights and Forecast - by Application
- 10.1.1. Bakery
- 10.1.2. Dairy-based Products
- 10.1.2.1. Ice Cream
- 10.1.2.2. Other Products
- 10.1.3. Beverages
- 10.1.3.1. Alcoholic Beverages
- 10.1.3.2. Non-alcoholic Beverages
- 10.1.4. Confectionery
- 10.1.5. Nutraceuticals
- 10.1.6. Snacks and Cereals
- 10.1.7. Other Applications
- 10.1. Market Analysis, Insights and Forecast - by Application
- 11. United Arab Emirates Natural Food Colorants Market Analysis, Insights and Forecast, 2019-2031
- 11.1. Market Analysis, Insights and Forecast - by Application
- 11.1.1. Bakery
- 11.1.2. Dairy-based Products
- 11.1.2.1. Ice Cream
- 11.1.2.2. Other Products
- 11.1.3. Beverages
- 11.1.3.1. Alcoholic Beverages
- 11.1.3.2. Non-alcoholic Beverages
- 11.1.4. Confectionery
- 11.1.5. Nutraceuticals
- 11.1.6. Snacks and Cereals
- 11.1.7. Other Applications
- 11.1. Market Analysis, Insights and Forecast - by Application
- 12. North America Natural Food Colorants Market Analysis, Insights and Forecast, 2019-2031
- 12.1. Market Analysis, Insights and Forecast - By Country/Sub-region
- 12.1.1 United States
- 12.1.2 Canada
- 12.1.3 Mexico
- 12.1.4 Rest of North America
- 13. Europe Natural Food Colorants Market Analysis, Insights and Forecast, 2019-2031
- 13.1. Market Analysis, Insights and Forecast - By Country/Sub-region
- 13.1.1 United Kingdom
- 13.1.2 Germany
- 13.1.3 Italy
- 13.1.4 Russia
- 13.1.5 Spain
- 13.1.6 France
- 13.1.7 Rest of Europe
- 14. Asia Pacific Natural Food Colorants Market Analysis, Insights and Forecast, 2019-2031
- 14.1. Market Analysis, Insights and Forecast - By Country/Sub-region
- 14.1.1 China
- 14.1.2 Japan
- 14.1.3 India
- 14.1.4 Australia
- 14.1.5 Rest of Asia Pacific
- 15. South America Natural Food Colorants Market Analysis, Insights and Forecast, 2019-2031
- 15.1. Market Analysis, Insights and Forecast - By Country/Sub-region
- 15.1.1 Brazil
- 15.1.2 Argentina
- 15.1.3 Rest of South America
- 16. Middle East Natural Food Colorants Market Analysis, Insights and Forecast, 2019-2031
- 16.1. Market Analysis, Insights and Forecast - By Country/Sub-region
- 16.1.1.
- 17. United Arab Emirates Natural Food Colorants Market Analysis, Insights and Forecast, 2019-2031
- 17.1. Market Analysis, Insights and Forecast - By Country/Sub-region
- 17.1.1 Saudi Arabia
- 17.1.2 Egypt
- 17.1.3 South Africa
- 17.1.4 Rest of Middle East
- 18. Competitive Analysis
- 18.1. Global Market Share Analysis 2024
- 18.2. Company Profiles
- 18.2.1 Kalsec Inc
- 18.2.1.1. Overview
- 18.2.1.2. Products
- 18.2.1.3. SWOT Analysis
- 18.2.1.4. Recent Developments
- 18.2.1.5. Financials (Based on Availability)
- 18.2.2 DDW Inc
- 18.2.2.1. Overview
- 18.2.2.2. Products
- 18.2.2.3. SWOT Analysis
- 18.2.2.4. Recent Developments
- 18.2.2.5. Financials (Based on Availability)
- 18.2.3 Chr Hansen Holding AS
- 18.2.3.1. Overview
- 18.2.3.2. Products
- 18.2.3.3. SWOT Analysis
- 18.2.3.4. Recent Developments
- 18.2.3.5. Financials (Based on Availability)
- 18.2.4 Sensient Technologies
- 18.2.4.1. Overview
- 18.2.4.2. Products
- 18.2.4.3. SWOT Analysis
- 18.2.4.4. Recent Developments
- 18.2.4.5. Financials (Based on Availability)
- 18.2.5 Givaudan SA
- 18.2.5.1. Overview
- 18.2.5.2. Products
- 18.2.5.3. SWOT Analysis
- 18.2.5.4. Recent Developments
- 18.2.5.5. Financials (Based on Availability)
- 18.2.6 Koninklijke DSM NV
- 18.2.6.1. Overview
- 18.2.6.2. Products
- 18.2.6.3. SWOT Analysis
- 18.2.6.4. Recent Developments
- 18.2.6.5. Financials (Based on Availability)
- 18.2.7 Synthite Industries Private Ltd
- 18.2.7.1. Overview
- 18.2.7.2. Products
- 18.2.7.3. SWOT Analysis
- 18.2.7.4. Recent Developments
- 18.2.7.5. Financials (Based on Availability)
- 18.2.8 Symrise AG
- 18.2.8.1. Overview
- 18.2.8.2. Products
- 18.2.8.3. SWOT Analysis
- 18.2.8.4. Recent Developments
- 18.2.8.5. Financials (Based on Availability)
- 18.2.9 Archer Daniels Midland Company*List Not Exhaustive
- 18.2.9.1. Overview
- 18.2.9.2. Products
- 18.2.9.3. SWOT Analysis
- 18.2.9.4. Recent Developments
- 18.2.9.5. Financials (Based on Availability)
- 18.2.1 Kalsec Inc
List of Figures
- Figure 1: Global Natural Food Colorants Market Revenue Breakdown (Million, %) by Region 2024 & 2032
- Figure 2: North America Natural Food Colorants Market Revenue (Million), by Country 2024 & 2032
- Figure 3: North America Natural Food Colorants Market Revenue Share (%), by Country 2024 & 2032
- Figure 4: Europe Natural Food Colorants Market Revenue (Million), by Country 2024 & 2032
- Figure 5: Europe Natural Food Colorants Market Revenue Share (%), by Country 2024 & 2032
- Figure 6: Asia Pacific Natural Food Colorants Market Revenue (Million), by Country 2024 & 2032
- Figure 7: Asia Pacific Natural Food Colorants Market Revenue Share (%), by Country 2024 & 2032
- Figure 8: South America Natural Food Colorants Market Revenue (Million), by Country 2024 & 2032
- Figure 9: South America Natural Food Colorants Market Revenue Share (%), by Country 2024 & 2032
- Figure 10: Middle East Natural Food Colorants Market Revenue (Million), by Country 2024 & 2032
- Figure 11: Middle East Natural Food Colorants Market Revenue Share (%), by Country 2024 & 2032
- Figure 12: United Arab Emirates Natural Food Colorants Market Revenue (Million), by Country 2024 & 2032
- Figure 13: United Arab Emirates Natural Food Colorants Market Revenue Share (%), by Country 2024 & 2032
- Figure 14: North America Natural Food Colorants Market Revenue (Million), by Application 2024 & 2032
- Figure 15: North America Natural Food Colorants Market Revenue Share (%), by Application 2024 & 2032
- Figure 16: North America Natural Food Colorants Market Revenue (Million), by Country 2024 & 2032
- Figure 17: North America Natural Food Colorants Market Revenue Share (%), by Country 2024 & 2032
- Figure 18: Europe Natural Food Colorants Market Revenue (Million), by Application 2024 & 2032
- Figure 19: Europe Natural Food Colorants Market Revenue Share (%), by Application 2024 & 2032
- Figure 20: Europe Natural Food Colorants Market Revenue (Million), by Country 2024 & 2032
- Figure 21: Europe Natural Food Colorants Market Revenue Share (%), by Country 2024 & 2032
- Figure 22: Asia Pacific Natural Food Colorants Market Revenue (Million), by Application 2024 & 2032
- Figure 23: Asia Pacific Natural Food Colorants Market Revenue Share (%), by Application 2024 & 2032
- Figure 24: Asia Pacific Natural Food Colorants Market Revenue (Million), by Country 2024 & 2032
- Figure 25: Asia Pacific Natural Food Colorants Market Revenue Share (%), by Country 2024 & 2032
- Figure 26: South America Natural Food Colorants Market Revenue (Million), by Application 2024 & 2032
- Figure 27: South America Natural Food Colorants Market Revenue Share (%), by Application 2024 & 2032
- Figure 28: South America Natural Food Colorants Market Revenue (Million), by Country 2024 & 2032
- Figure 29: South America Natural Food Colorants Market Revenue Share (%), by Country 2024 & 2032
- Figure 30: Middle East Natural Food Colorants Market Revenue (Million), by Application 2024 & 2032
- Figure 31: Middle East Natural Food Colorants Market Revenue Share (%), by Application 2024 & 2032
- Figure 32: Middle East Natural Food Colorants Market Revenue (Million), by Country 2024 & 2032
- Figure 33: Middle East Natural Food Colorants Market Revenue Share (%), by Country 2024 & 2032
- Figure 34: United Arab Emirates Natural Food Colorants Market Revenue (Million), by Application 2024 & 2032
- Figure 35: United Arab Emirates Natural Food Colorants Market Revenue Share (%), by Application 2024 & 2032
- Figure 36: United Arab Emirates Natural Food Colorants Market Revenue (Million), by Country 2024 & 2032
- Figure 37: United Arab Emirates Natural Food Colorants Market Revenue Share (%), by Country 2024 & 2032
List of Tables
- Table 1: Global Natural Food Colorants Market Revenue Million Forecast, by Region 2019 & 2032
- Table 2: Global Natural Food Colorants Market Revenue Million Forecast, by Application 2019 & 2032
- Table 3: Global Natural Food Colorants Market Revenue Million Forecast, by Region 2019 & 2032
- Table 4: Global Natural Food Colorants Market Revenue Million Forecast, by Country 2019 & 2032
- Table 5: United States Natural Food Colorants Market Revenue (Million) Forecast, by Application 2019 & 2032
- Table 6: Canada Natural Food Colorants Market Revenue (Million) Forecast, by Application 2019 & 2032
- Table 7: Mexico Natural Food Colorants Market Revenue (Million) Forecast, by Application 2019 & 2032
- Table 8: Rest of North America Natural Food Colorants Market Revenue (Million) Forecast, by Application 2019 & 2032
- Table 9: Global Natural Food Colorants Market Revenue Million Forecast, by Country 2019 & 2032
- Table 10: United Kingdom Natural Food Colorants Market Revenue (Million) Forecast, by Application 2019 & 2032
- Table 11: Germany Natural Food Colorants Market Revenue (Million) Forecast, by Application 2019 & 2032
- Table 12: Italy Natural Food Colorants Market Revenue (Million) Forecast, by Application 2019 & 2032
- Table 13: Russia Natural Food Colorants Market Revenue (Million) Forecast, by Application 2019 & 2032
- Table 14: Spain Natural Food Colorants Market Revenue (Million) Forecast, by Application 2019 & 2032
- Table 15: France Natural Food Colorants Market Revenue (Million) Forecast, by Application 2019 & 2032
- Table 16: Rest of Europe Natural Food Colorants Market Revenue (Million) Forecast, by Application 2019 & 2032
- Table 17: Global Natural Food Colorants Market Revenue Million Forecast, by Country 2019 & 2032
- Table 18: China Natural Food Colorants Market Revenue (Million) Forecast, by Application 2019 & 2032
- Table 19: Japan Natural Food Colorants Market Revenue (Million) Forecast, by Application 2019 & 2032
- Table 20: India Natural Food Colorants Market Revenue (Million) Forecast, by Application 2019 & 2032
- Table 21: Australia Natural Food Colorants Market Revenue (Million) Forecast, by Application 2019 & 2032
- Table 22: Rest of Asia Pacific Natural Food Colorants Market Revenue (Million) Forecast, by Application 2019 & 2032
- Table 23: Global Natural Food Colorants Market Revenue Million Forecast, by Country 2019 & 2032
- Table 24: Brazil Natural Food Colorants Market Revenue (Million) Forecast, by Application 2019 & 2032
- Table 25: Argentina Natural Food Colorants Market Revenue (Million) Forecast, by Application 2019 & 2032
- Table 26: Rest of South America Natural Food Colorants Market Revenue (Million) Forecast, by Application 2019 & 2032
- Table 27: Global Natural Food Colorants Market Revenue Million Forecast, by Country 2019 & 2032
- Table 28: Natural Food Colorants Market Revenue (Million) Forecast, by Application 2019 & 2032
- Table 29: Global Natural Food Colorants Market Revenue Million Forecast, by Country 2019 & 2032
- Table 30: Saudi Arabia Natural Food Colorants Market Revenue (Million) Forecast, by Application 2019 & 2032
- Table 31: Egypt Natural Food Colorants Market Revenue (Million) Forecast, by Application 2019 & 2032
- Table 32: South Africa Natural Food Colorants Market Revenue (Million) Forecast, by Application 2019 & 2032
- Table 33: Rest of Middle East Natural Food Colorants Market Revenue (Million) Forecast, by Application 2019 & 2032
- Table 34: Global Natural Food Colorants Market Revenue Million Forecast, by Application 2019 & 2032
- Table 35: Global Natural Food Colorants Market Revenue Million Forecast, by Country 2019 & 2032
- Table 36: United States Natural Food Colorants Market Revenue (Million) Forecast, by Application 2019 & 2032
- Table 37: Canada Natural Food Colorants Market Revenue (Million) Forecast, by Application 2019 & 2032
- Table 38: Mexico Natural Food Colorants Market Revenue (Million) Forecast, by Application 2019 & 2032
- Table 39: Rest of North America Natural Food Colorants Market Revenue (Million) Forecast, by Application 2019 & 2032
- Table 40: Global Natural Food Colorants Market Revenue Million Forecast, by Application 2019 & 2032
- Table 41: Global Natural Food Colorants Market Revenue Million Forecast, by Country 2019 & 2032
- Table 42: United Kingdom Natural Food Colorants Market Revenue (Million) Forecast, by Application 2019 & 2032
- Table 43: Germany Natural Food Colorants Market Revenue (Million) Forecast, by Application 2019 & 2032
- Table 44: Italy Natural Food Colorants Market Revenue (Million) Forecast, by Application 2019 & 2032
- Table 45: Russia Natural Food Colorants Market Revenue (Million) Forecast, by Application 2019 & 2032
- Table 46: Spain Natural Food Colorants Market Revenue (Million) Forecast, by Application 2019 & 2032
- Table 47: France Natural Food Colorants Market Revenue (Million) Forecast, by Application 2019 & 2032
- Table 48: Rest of Europe Natural Food Colorants Market Revenue (Million) Forecast, by Application 2019 & 2032
- Table 49: Global Natural Food Colorants Market Revenue Million Forecast, by Application 2019 & 2032
- Table 50: Global Natural Food Colorants Market Revenue Million Forecast, by Country 2019 & 2032
- Table 51: China Natural Food Colorants Market Revenue (Million) Forecast, by Application 2019 & 2032
- Table 52: Japan Natural Food Colorants Market Revenue (Million) Forecast, by Application 2019 & 2032
- Table 53: India Natural Food Colorants Market Revenue (Million) Forecast, by Application 2019 & 2032
- Table 54: Australia Natural Food Colorants Market Revenue (Million) Forecast, by Application 2019 & 2032
- Table 55: Rest of Asia Pacific Natural Food Colorants Market Revenue (Million) Forecast, by Application 2019 & 2032
- Table 56: Global Natural Food Colorants Market Revenue Million Forecast, by Application 2019 & 2032
- Table 57: Global Natural Food Colorants Market Revenue Million Forecast, by Country 2019 & 2032
- Table 58: Brazil Natural Food Colorants Market Revenue (Million) Forecast, by Application 2019 & 2032
- Table 59: Argentina Natural Food Colorants Market Revenue (Million) Forecast, by Application 2019 & 2032
- Table 60: Rest of South America Natural Food Colorants Market Revenue (Million) Forecast, by Application 2019 & 2032
- Table 61: Global Natural Food Colorants Market Revenue Million Forecast, by Application 2019 & 2032
- Table 62: Global Natural Food Colorants Market Revenue Million Forecast, by Country 2019 & 2032
- Table 63: Global Natural Food Colorants Market Revenue Million Forecast, by Application 2019 & 2032
- Table 64: Global Natural Food Colorants Market Revenue Million Forecast, by Country 2019 & 2032
- Table 65: Saudi Arabia Natural Food Colorants Market Revenue (Million) Forecast, by Application 2019 & 2032
- Table 66: Egypt Natural Food Colorants Market Revenue (Million) Forecast, by Application 2019 & 2032
- Table 67: South Africa Natural Food Colorants Market Revenue (Million) Forecast, by Application 2019 & 2032
- Table 68: Rest of Middle East Natural Food Colorants Market Revenue (Million) Forecast, by Application 2019 & 2032
Frequently Asked Questions
1. What is the projected Compound Annual Growth Rate (CAGR) of the Natural Food Colorants Market?
The projected CAGR is approximately 8.47%.
2. Which companies are prominent players in the Natural Food Colorants Market?
Key companies in the market include Kalsec Inc, DDW Inc, Chr Hansen Holding AS, Sensient Technologies, Givaudan SA, Koninklijke DSM NV, Synthite Industries Private Ltd, Symrise AG, Archer Daniels Midland Company*List Not Exhaustive.
3. What are the main segments of the Natural Food Colorants Market?
The market segments include Application.
4. Can you provide details about the market size?
The market size is estimated to be USD 2.07 Million as of 2022.
5. What are some drivers contributing to market growth?
Rising Health Consciousness among consumer.
6. What are the notable trends driving market growth?
Brightening Spotlight on Coloring Foodstuff.
7. Are there any restraints impacting market growth?
High Cost of natural Ingredients.
8. Can you provide examples of recent developments in the market?
In January 2021, GNT Group added a new pink shade coloring agent under its EXBERRY® brand with the name EXBERRY® Shade Pink - OD, which is developed for use in fat-based applications. It is also available in red, yellow, orange, blue, and green variants.
9. What pricing options are available for accessing the report?
Pricing options include single-user, multi-user, and enterprise licenses priced at USD 4750, USD 5250, and USD 8750 respectively.
10. Is the market size provided in terms of value or volume?
The market size is provided in terms of value, measured in Million.
11. Are there any specific market keywords associated with the report?
Yes, the market keyword associated with the report is "Natural Food Colorants Market," which aids in identifying and referencing the specific market segment covered.
12. How do I determine which pricing option suits my needs best?
The pricing options vary based on user requirements and access needs. Individual users may opt for single-user licenses, while businesses requiring broader access may choose multi-user or enterprise licenses for cost-effective access to the report.
13. Are there any additional resources or data provided in the Natural Food Colorants Market report?
While the report offers comprehensive insights, it's advisable to review the specific contents or supplementary materials provided to ascertain if additional resources or data are available.
14. How can I stay updated on further developments or reports in the Natural Food Colorants Market?
To stay informed about further developments, trends, and reports in the Natural Food Colorants Market, consider subscribing to industry newsletters, following relevant companies and organizations, or regularly checking reputable industry news sources and publications.
Methodology
Step 1 - Identification of Relevant Samples Size from Population Database


Step 2 - Approaches for Defining Global Market Size (Value, Volume* & Price*)

Note*: In applicable scenarios
Step 3 - Data Sources
Primary Research
- Web Analytics
- Survey Reports
- Research Institute
- Latest Research Reports
- Opinion Leaders
Secondary Research
- Annual Reports
- White Paper
- Latest Press Release
- Industry Association
- Paid Database
- Investor Presentations

Step 4 - Data Triangulation
Involves using different sources of information in order to increase the validity of a study
These sources are likely to be stakeholders in a program - participants, other researchers, program staff, other community members, and so on.
Then we put all data in single framework & apply various statistical tools to find out the dynamic on the market.
During the analysis stage, feedback from the stakeholder groups would be compared to determine areas of agreement as well as areas of divergence
