

Key Insights
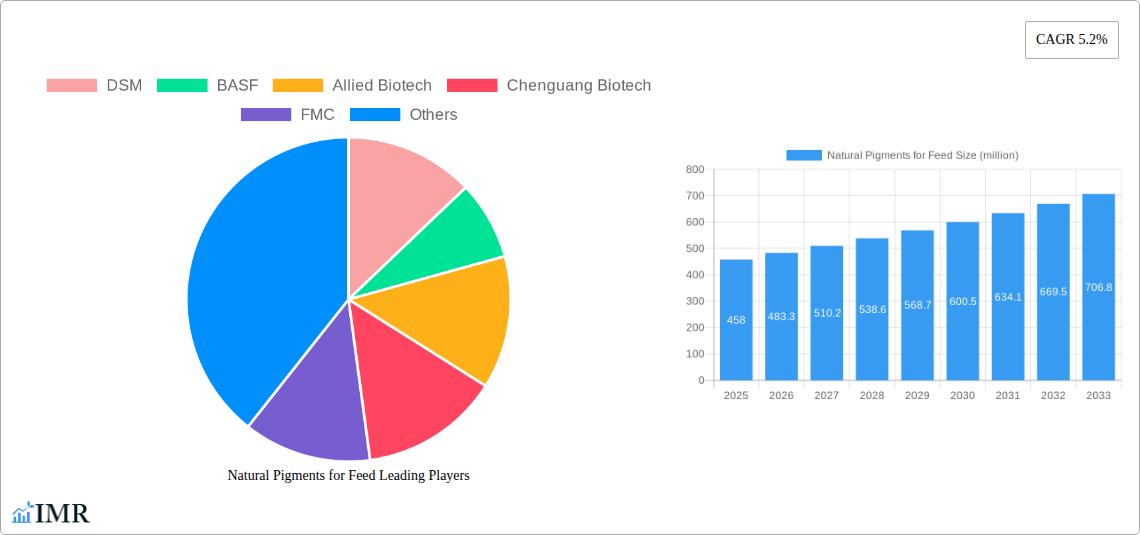
The global market for natural pigments in animal feed is experiencing robust growth, projected to reach \$458 million in 2025 and expanding at a Compound Annual Growth Rate (CAGR) of 5.2% from 2025 to 2033. This expansion is fueled by several key drivers. Increasing consumer demand for naturally sourced food products is pushing the animal feed industry towards cleaner labels and more sustainable practices. This trend necessitates a shift away from synthetic colorants towards natural alternatives like carotenoids, anthocyanins, and chlorophyll. Furthermore, the growing awareness of the potential health benefits associated with natural pigments, such as enhanced immune function and improved animal welfare, is further stimulating market growth. Regulations restricting the use of synthetic pigments in certain regions are also contributing to the adoption of natural alternatives. Competition within the market is strong, with key players like DSM, BASF, and Chr. Hansen actively innovating and expanding their product portfolios to meet the rising demand. The market is segmented based on pigment type, animal species, and geographical region, with regional variations reflecting differing regulatory landscapes and consumer preferences. While challenges remain, such as the higher cost and potentially lower color intensity of some natural pigments compared to synthetics, the long-term outlook for the natural pigments for feed market remains positive.
The forecast period of 2025-2033 suggests continued growth, driven by ongoing innovation in pigment extraction and processing technologies, leading to improved stability and cost-effectiveness. Emerging applications in aquaculture and poultry feed segments present lucrative opportunities for market expansion. Strategic partnerships and mergers & acquisitions among leading companies are reshaping the competitive landscape, fostering innovation and market penetration. Future growth will depend on the successful navigation of challenges related to supply chain stability, standardization of quality control, and maintaining a balance between cost and consumer demand for premium, naturally colored animal products.
Natural Pigments for Feed Market Report: 2019-2033
This comprehensive report provides a detailed analysis of the global natural pigments for feed market, offering invaluable insights for industry professionals, investors, and strategic decision-makers. The study period covers 2019-2033, with 2025 as the base year and the forecast period spanning 2025-2033. The report meticulously examines market dynamics, growth trends, regional segmentation, product landscape, key players, and emerging opportunities within the animal feed and pet food industries (parent market) focusing specifically on the natural pigment sub-segment (child market). The total market size in 2025 is estimated at $XX million.
Natural Pigments for Feed Market Dynamics & Structure
This section analyzes the competitive landscape, technological advancements, regulatory influences, and market trends shaping the natural pigments for feed industry. The market exhibits moderate concentration, with key players like DSM, BASF, and FMC holding significant shares. Technological innovation focuses on enhancing pigment stability, bio-availability, and color consistency. Regulatory frameworks regarding food safety and environmental impact are continuously evolving, influencing product development and market access. Mergers and acquisitions (M&A) activity has been relatively modest in recent years, with approximately xx deals recorded between 2019 and 2024, primarily driven by expansion into new geographical markets and product diversification.
- Market Concentration: Moderately concentrated, with top 5 players holding approximately xx% market share in 2025.
- Technological Innovation: Focus on enhancing pigment stability, bio-availability, and color consistency through sustainable extraction methods.
- Regulatory Framework: Stringent regulations regarding food safety and environmental impact, driving demand for natural and sustainable alternatives.
- Competitive Substitutes: Synthetic pigments pose a competitive threat, but increasing consumer preference for natural products is driving market growth.
- End-User Demographics: Poultry, aquaculture, and swine farming represent major end-use segments.
- M&A Trends: Moderate M&A activity (xx deals 2019-2024), primarily focused on geographical expansion and product diversification.
Natural Pigments for Feed Growth Trends & Insights
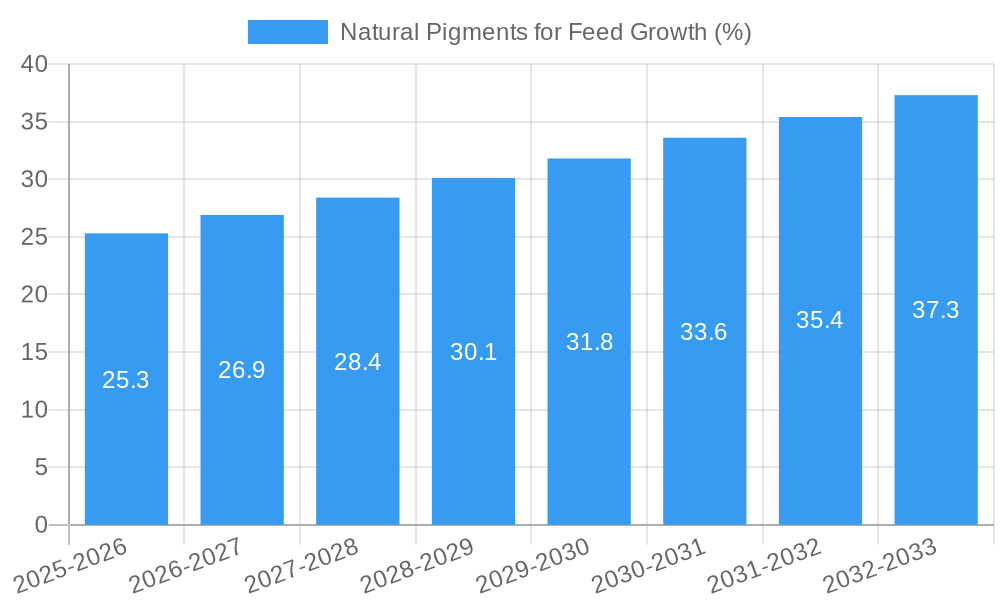
The global natural pigments for feed market has witnessed consistent growth during the historical period (2019-2024), driven by increasing consumer demand for natural and clean-label products, coupled with rising awareness of the health benefits of natural colorants in animal feed. The market is expected to continue this trajectory during the forecast period (2025-2033), with a projected CAGR of xx%. This growth is fueled by the expanding animal feed industry, technological innovations enabling improved pigment extraction and formulation, and stricter regulations on synthetic pigments in several regions. The market penetration of natural pigments in animal feed remains relatively low, but is expected to increase significantly due to increasing consumer preference for naturally colored animal products. Technological advancements, such as improved extraction techniques and nanoencapsulation, further enhance product efficacy and stability.
Dominant Regions, Countries, or Segments in Natural Pigments for Feed
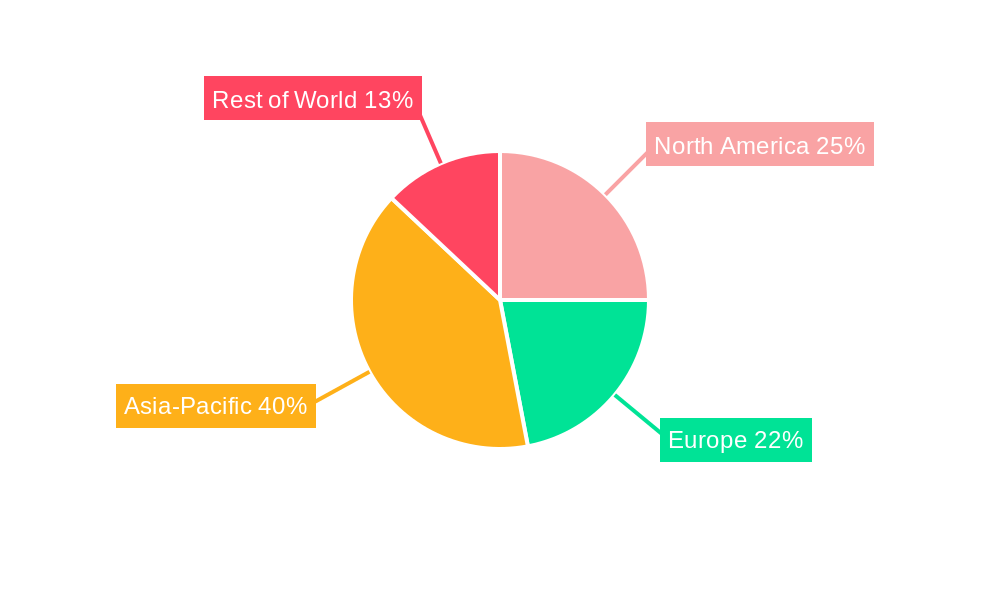
The North American and European regions currently dominate the natural pigments for feed market, owing to stringent regulations on synthetic colorants, high consumer awareness of natural ingredients, and established animal feed industries. However, Asia-Pacific is projected to experience the fastest growth rate during the forecast period driven by increasing demand for animal protein and favorable economic conditions supporting investments in the animal feed industry. Within the segments, poultry feed accounts for the largest share, followed by aquaculture and swine feed.
- North America: Strong regulatory environment, high consumer demand for natural ingredients.
- Europe: Similar to North America, with stringent regulations and consumer preference driving market growth.
- Asia-Pacific: Fastest-growing region, driven by expanding animal protein consumption and increasing investment in the feed industry.
- Key Drivers: Increasing demand for natural and clean-label products, stringent regulations on synthetic pigments, growth of the animal feed industry.
Natural Pigments for Feed Product Landscape
The natural pigments for feed market offers a diverse range of products derived from various natural sources, including carotenoids (from algae, bacteria, or plants), anthocyanins, and chlorophyll. These pigments provide diverse color options and are increasingly formulated for enhanced stability, bioavailability, and efficacy in different animal feed applications. Technological advancements like microencapsulation and nano-encapsulation improve pigment stability and protect them from degradation during processing and storage. Key innovations include water-dispersible formulations and targeted delivery systems to maximize pigment utilization in animals.
Key Drivers, Barriers & Challenges in Natural Pigments for Feed
Key Drivers:
- Growing consumer demand for natural and clean-label products in the animal feed industry.
- Stringent regulations on synthetic pigments in several regions globally.
- Expanding global animal feed industry driven by increasing meat consumption.
- Technological advancements in extraction, formulation, and delivery systems.
Key Barriers & Challenges:
- High production costs compared to synthetic pigments limit wider adoption.
- Fluctuations in raw material prices and supply chain disruptions create instability.
- Product stability and color consistency can be challenging to maintain.
- Regulatory hurdles for new products and varying approvals across different regions.
Emerging Opportunities in Natural Pigments for Feed
Untapped markets in developing economies offer significant growth potential. Demand for natural pigments is expanding across various animal species and feed types, including pet food. Innovative applications, such as functional pigments with added health benefits, are gaining traction. Evolving consumer preferences towards sustainably sourced ingredients create opportunities for eco-friendly pigment production methods.
Growth Accelerators in the Natural Pigments for Feed Industry
Technological breakthroughs in pigment extraction and formulation will drive cost reductions and enhance product quality. Strategic partnerships between pigment manufacturers and animal feed companies will foster innovation and expand market reach. Market expansion strategies targeting emerging economies and niche segments will fuel long-term growth.
Key Players Shaping the Natural Pigments for Feed Market
- DSM
- BASF
- Allied Biotech
- Chenguang Biotech
- FMC
- Dohler
- Chr. Hansen
- Carotech
- DDW
- Excelvite
- Anhui Wisdom
- Tian Yin
- Kemin
Notable Milestones in Natural Pigments for Feed Sector
- 2020: DSM launched a new range of sustainable natural pigments for poultry feed.
- 2021: BASF acquired a smaller natural pigment producer, expanding its portfolio.
- 2022: New EU regulations on synthetic pigments further accelerated the shift towards natural alternatives.
- 2023: Several companies invested heavily in R&D to improve pigment extraction and formulation efficiency.
In-Depth Natural Pigments for Feed Market Outlook
The natural pigments for feed market is poised for significant growth, fueled by strong tailwinds from consumer preference, regulatory changes, and technological advancements. Strategic opportunities abound for companies focused on innovation, sustainability, and cost-effective production. The market is expected to surpass $XX million by 2033, offering attractive investment prospects and creating a compelling environment for established players and new entrants alike.
Natural Pigments for Feed Segmentation
-
1. Application
- 1.1. Laying Hens
- 1.2. Broiler
- 1.3. Duck
- 1.4. Others
-
2. Types
- 2.1. Astaxanthin
- 2.2. Beta-Carotene
- 2.3. Canthaxanthin
- 2.4. Lycopene
- 2.5. Lutein
Natural Pigments for Feed Segmentation By Geography
-
1. North America
- 1.1. United States
- 1.2. Canada
- 1.3. Mexico
-
2. South America
- 2.1. Brazil
- 2.2. Argentina
- 2.3. Rest of South America
-
3. Europe
- 3.1. United Kingdom
- 3.2. Germany
- 3.3. France
- 3.4. Italy
- 3.5. Spain
- 3.6. Russia
- 3.7. Benelux
- 3.8. Nordics
- 3.9. Rest of Europe
-
4. Middle East & Africa
- 4.1. Turkey
- 4.2. Israel
- 4.3. GCC
- 4.4. North Africa
- 4.5. South Africa
- 4.6. Rest of Middle East & Africa
-
5. Asia Pacific
- 5.1. China
- 5.2. India
- 5.3. Japan
- 5.4. South Korea
- 5.5. ASEAN
- 5.6. Oceania
- 5.7. Rest of Asia Pacific
Natural Pigments for Feed REPORT HIGHLIGHTS
| Aspects | Details |
|---|---|
| Study Period | 2019-2033 |
| Base Year | 2024 |
| Estimated Year | 2025 |
| Forecast Period | 2025-2033 |
| Historical Period | 2019-2024 |
| Growth Rate | CAGR of 5.2% from 2019-2033 |
| Segmentation |
|
Table of Contents
- 1. Introduction
- 1.1. Research Scope
- 1.2. Market Segmentation
- 1.3. Research Methodology
- 1.4. Definitions and Assumptions
- 2. Executive Summary
- 2.1. Introduction
- 3. Market Dynamics
- 3.1. Introduction
- 3.2. Market Drivers
- 3.3. Market Restrains
- 3.4. Market Trends
- 4. Market Factor Analysis
- 4.1. Porters Five Forces
- 4.2. Supply/Value Chain
- 4.3. PESTEL analysis
- 4.4. Market Entropy
- 4.5. Patent/Trademark Analysis
- 5. Global Natural Pigments for Feed Analysis, Insights and Forecast, 2019-2031
- 5.1. Market Analysis, Insights and Forecast - by Application
- 5.1.1. Laying Hens
- 5.1.2. Broiler
- 5.1.3. Duck
- 5.1.4. Others
- 5.2. Market Analysis, Insights and Forecast - by Types
- 5.2.1. Astaxanthin
- 5.2.2. Beta-Carotene
- 5.2.3. Canthaxanthin
- 5.2.4. Lycopene
- 5.2.5. Lutein
- 5.3. Market Analysis, Insights and Forecast - by Region
- 5.3.1. North America
- 5.3.2. South America
- 5.3.3. Europe
- 5.3.4. Middle East & Africa
- 5.3.5. Asia Pacific
- 5.1. Market Analysis, Insights and Forecast - by Application
- 6. North America Natural Pigments for Feed Analysis, Insights and Forecast, 2019-2031
- 6.1. Market Analysis, Insights and Forecast - by Application
- 6.1.1. Laying Hens
- 6.1.2. Broiler
- 6.1.3. Duck
- 6.1.4. Others
- 6.2. Market Analysis, Insights and Forecast - by Types
- 6.2.1. Astaxanthin
- 6.2.2. Beta-Carotene
- 6.2.3. Canthaxanthin
- 6.2.4. Lycopene
- 6.2.5. Lutein
- 6.1. Market Analysis, Insights and Forecast - by Application
- 7. South America Natural Pigments for Feed Analysis, Insights and Forecast, 2019-2031
- 7.1. Market Analysis, Insights and Forecast - by Application
- 7.1.1. Laying Hens
- 7.1.2. Broiler
- 7.1.3. Duck
- 7.1.4. Others
- 7.2. Market Analysis, Insights and Forecast - by Types
- 7.2.1. Astaxanthin
- 7.2.2. Beta-Carotene
- 7.2.3. Canthaxanthin
- 7.2.4. Lycopene
- 7.2.5. Lutein
- 7.1. Market Analysis, Insights and Forecast - by Application
- 8. Europe Natural Pigments for Feed Analysis, Insights and Forecast, 2019-2031
- 8.1. Market Analysis, Insights and Forecast - by Application
- 8.1.1. Laying Hens
- 8.1.2. Broiler
- 8.1.3. Duck
- 8.1.4. Others
- 8.2. Market Analysis, Insights and Forecast - by Types
- 8.2.1. Astaxanthin
- 8.2.2. Beta-Carotene
- 8.2.3. Canthaxanthin
- 8.2.4. Lycopene
- 8.2.5. Lutein
- 8.1. Market Analysis, Insights and Forecast - by Application
- 9. Middle East & Africa Natural Pigments for Feed Analysis, Insights and Forecast, 2019-2031
- 9.1. Market Analysis, Insights and Forecast - by Application
- 9.1.1. Laying Hens
- 9.1.2. Broiler
- 9.1.3. Duck
- 9.1.4. Others
- 9.2. Market Analysis, Insights and Forecast - by Types
- 9.2.1. Astaxanthin
- 9.2.2. Beta-Carotene
- 9.2.3. Canthaxanthin
- 9.2.4. Lycopene
- 9.2.5. Lutein
- 9.1. Market Analysis, Insights and Forecast - by Application
- 10. Asia Pacific Natural Pigments for Feed Analysis, Insights and Forecast, 2019-2031
- 10.1. Market Analysis, Insights and Forecast - by Application
- 10.1.1. Laying Hens
- 10.1.2. Broiler
- 10.1.3. Duck
- 10.1.4. Others
- 10.2. Market Analysis, Insights and Forecast - by Types
- 10.2.1. Astaxanthin
- 10.2.2. Beta-Carotene
- 10.2.3. Canthaxanthin
- 10.2.4. Lycopene
- 10.2.5. Lutein
- 10.1. Market Analysis, Insights and Forecast - by Application
- 11. Competitive Analysis
- 11.1. Global Market Share Analysis 2024
- 11.2. Company Profiles
- 11.2.1 DSM
- 11.2.1.1. Overview
- 11.2.1.2. Products
- 11.2.1.3. SWOT Analysis
- 11.2.1.4. Recent Developments
- 11.2.1.5. Financials (Based on Availability)
- 11.2.2 BASF
- 11.2.2.1. Overview
- 11.2.2.2. Products
- 11.2.2.3. SWOT Analysis
- 11.2.2.4. Recent Developments
- 11.2.2.5. Financials (Based on Availability)
- 11.2.3 Allied Biotech
- 11.2.3.1. Overview
- 11.2.3.2. Products
- 11.2.3.3. SWOT Analysis
- 11.2.3.4. Recent Developments
- 11.2.3.5. Financials (Based on Availability)
- 11.2.4 Chenguang Biotech
- 11.2.4.1. Overview
- 11.2.4.2. Products
- 11.2.4.3. SWOT Analysis
- 11.2.4.4. Recent Developments
- 11.2.4.5. Financials (Based on Availability)
- 11.2.5 FMC
- 11.2.5.1. Overview
- 11.2.5.2. Products
- 11.2.5.3. SWOT Analysis
- 11.2.5.4. Recent Developments
- 11.2.5.5. Financials (Based on Availability)
- 11.2.6 Dohler
- 11.2.6.1. Overview
- 11.2.6.2. Products
- 11.2.6.3. SWOT Analysis
- 11.2.6.4. Recent Developments
- 11.2.6.5. Financials (Based on Availability)
- 11.2.7 Chr. Hansen
- 11.2.7.1. Overview
- 11.2.7.2. Products
- 11.2.7.3. SWOT Analysis
- 11.2.7.4. Recent Developments
- 11.2.7.5. Financials (Based on Availability)
- 11.2.8 Carotech
- 11.2.8.1. Overview
- 11.2.8.2. Products
- 11.2.8.3. SWOT Analysis
- 11.2.8.4. Recent Developments
- 11.2.8.5. Financials (Based on Availability)
- 11.2.9 DDW
- 11.2.9.1. Overview
- 11.2.9.2. Products
- 11.2.9.3. SWOT Analysis
- 11.2.9.4. Recent Developments
- 11.2.9.5. Financials (Based on Availability)
- 11.2.10 Excelvite
- 11.2.10.1. Overview
- 11.2.10.2. Products
- 11.2.10.3. SWOT Analysis
- 11.2.10.4. Recent Developments
- 11.2.10.5. Financials (Based on Availability)
- 11.2.11 Anhui Wisdom
- 11.2.11.1. Overview
- 11.2.11.2. Products
- 11.2.11.3. SWOT Analysis
- 11.2.11.4. Recent Developments
- 11.2.11.5. Financials (Based on Availability)
- 11.2.12 Tian Yin
- 11.2.12.1. Overview
- 11.2.12.2. Products
- 11.2.12.3. SWOT Analysis
- 11.2.12.4. Recent Developments
- 11.2.12.5. Financials (Based on Availability)
- 11.2.13 Kemin
- 11.2.13.1. Overview
- 11.2.13.2. Products
- 11.2.13.3. SWOT Analysis
- 11.2.13.4. Recent Developments
- 11.2.13.5. Financials (Based on Availability)
- 11.2.1 DSM
List of Figures
- Figure 1: Global Natural Pigments for Feed Revenue Breakdown (million, %) by Region 2024 & 2032
- Figure 2: North America Natural Pigments for Feed Revenue (million), by Application 2024 & 2032
- Figure 3: North America Natural Pigments for Feed Revenue Share (%), by Application 2024 & 2032
- Figure 4: North America Natural Pigments for Feed Revenue (million), by Types 2024 & 2032
- Figure 5: North America Natural Pigments for Feed Revenue Share (%), by Types 2024 & 2032
- Figure 6: North America Natural Pigments for Feed Revenue (million), by Country 2024 & 2032
- Figure 7: North America Natural Pigments for Feed Revenue Share (%), by Country 2024 & 2032
- Figure 8: South America Natural Pigments for Feed Revenue (million), by Application 2024 & 2032
- Figure 9: South America Natural Pigments for Feed Revenue Share (%), by Application 2024 & 2032
- Figure 10: South America Natural Pigments for Feed Revenue (million), by Types 2024 & 2032
- Figure 11: South America Natural Pigments for Feed Revenue Share (%), by Types 2024 & 2032
- Figure 12: South America Natural Pigments for Feed Revenue (million), by Country 2024 & 2032
- Figure 13: South America Natural Pigments for Feed Revenue Share (%), by Country 2024 & 2032
- Figure 14: Europe Natural Pigments for Feed Revenue (million), by Application 2024 & 2032
- Figure 15: Europe Natural Pigments for Feed Revenue Share (%), by Application 2024 & 2032
- Figure 16: Europe Natural Pigments for Feed Revenue (million), by Types 2024 & 2032
- Figure 17: Europe Natural Pigments for Feed Revenue Share (%), by Types 2024 & 2032
- Figure 18: Europe Natural Pigments for Feed Revenue (million), by Country 2024 & 2032
- Figure 19: Europe Natural Pigments for Feed Revenue Share (%), by Country 2024 & 2032
- Figure 20: Middle East & Africa Natural Pigments for Feed Revenue (million), by Application 2024 & 2032
- Figure 21: Middle East & Africa Natural Pigments for Feed Revenue Share (%), by Application 2024 & 2032
- Figure 22: Middle East & Africa Natural Pigments for Feed Revenue (million), by Types 2024 & 2032
- Figure 23: Middle East & Africa Natural Pigments for Feed Revenue Share (%), by Types 2024 & 2032
- Figure 24: Middle East & Africa Natural Pigments for Feed Revenue (million), by Country 2024 & 2032
- Figure 25: Middle East & Africa Natural Pigments for Feed Revenue Share (%), by Country 2024 & 2032
- Figure 26: Asia Pacific Natural Pigments for Feed Revenue (million), by Application 2024 & 2032
- Figure 27: Asia Pacific Natural Pigments for Feed Revenue Share (%), by Application 2024 & 2032
- Figure 28: Asia Pacific Natural Pigments for Feed Revenue (million), by Types 2024 & 2032
- Figure 29: Asia Pacific Natural Pigments for Feed Revenue Share (%), by Types 2024 & 2032
- Figure 30: Asia Pacific Natural Pigments for Feed Revenue (million), by Country 2024 & 2032
- Figure 31: Asia Pacific Natural Pigments for Feed Revenue Share (%), by Country 2024 & 2032
List of Tables
- Table 1: Global Natural Pigments for Feed Revenue million Forecast, by Region 2019 & 2032
- Table 2: Global Natural Pigments for Feed Revenue million Forecast, by Application 2019 & 2032
- Table 3: Global Natural Pigments for Feed Revenue million Forecast, by Types 2019 & 2032
- Table 4: Global Natural Pigments for Feed Revenue million Forecast, by Region 2019 & 2032
- Table 5: Global Natural Pigments for Feed Revenue million Forecast, by Application 2019 & 2032
- Table 6: Global Natural Pigments for Feed Revenue million Forecast, by Types 2019 & 2032
- Table 7: Global Natural Pigments for Feed Revenue million Forecast, by Country 2019 & 2032
- Table 8: United States Natural Pigments for Feed Revenue (million) Forecast, by Application 2019 & 2032
- Table 9: Canada Natural Pigments for Feed Revenue (million) Forecast, by Application 2019 & 2032
- Table 10: Mexico Natural Pigments for Feed Revenue (million) Forecast, by Application 2019 & 2032
- Table 11: Global Natural Pigments for Feed Revenue million Forecast, by Application 2019 & 2032
- Table 12: Global Natural Pigments for Feed Revenue million Forecast, by Types 2019 & 2032
- Table 13: Global Natural Pigments for Feed Revenue million Forecast, by Country 2019 & 2032
- Table 14: Brazil Natural Pigments for Feed Revenue (million) Forecast, by Application 2019 & 2032
- Table 15: Argentina Natural Pigments for Feed Revenue (million) Forecast, by Application 2019 & 2032
- Table 16: Rest of South America Natural Pigments for Feed Revenue (million) Forecast, by Application 2019 & 2032
- Table 17: Global Natural Pigments for Feed Revenue million Forecast, by Application 2019 & 2032
- Table 18: Global Natural Pigments for Feed Revenue million Forecast, by Types 2019 & 2032
- Table 19: Global Natural Pigments for Feed Revenue million Forecast, by Country 2019 & 2032
- Table 20: United Kingdom Natural Pigments for Feed Revenue (million) Forecast, by Application 2019 & 2032
- Table 21: Germany Natural Pigments for Feed Revenue (million) Forecast, by Application 2019 & 2032
- Table 22: France Natural Pigments for Feed Revenue (million) Forecast, by Application 2019 & 2032
- Table 23: Italy Natural Pigments for Feed Revenue (million) Forecast, by Application 2019 & 2032
- Table 24: Spain Natural Pigments for Feed Revenue (million) Forecast, by Application 2019 & 2032
- Table 25: Russia Natural Pigments for Feed Revenue (million) Forecast, by Application 2019 & 2032
- Table 26: Benelux Natural Pigments for Feed Revenue (million) Forecast, by Application 2019 & 2032
- Table 27: Nordics Natural Pigments for Feed Revenue (million) Forecast, by Application 2019 & 2032
- Table 28: Rest of Europe Natural Pigments for Feed Revenue (million) Forecast, by Application 2019 & 2032
- Table 29: Global Natural Pigments for Feed Revenue million Forecast, by Application 2019 & 2032
- Table 30: Global Natural Pigments for Feed Revenue million Forecast, by Types 2019 & 2032
- Table 31: Global Natural Pigments for Feed Revenue million Forecast, by Country 2019 & 2032
- Table 32: Turkey Natural Pigments for Feed Revenue (million) Forecast, by Application 2019 & 2032
- Table 33: Israel Natural Pigments for Feed Revenue (million) Forecast, by Application 2019 & 2032
- Table 34: GCC Natural Pigments for Feed Revenue (million) Forecast, by Application 2019 & 2032
- Table 35: North Africa Natural Pigments for Feed Revenue (million) Forecast, by Application 2019 & 2032
- Table 36: South Africa Natural Pigments for Feed Revenue (million) Forecast, by Application 2019 & 2032
- Table 37: Rest of Middle East & Africa Natural Pigments for Feed Revenue (million) Forecast, by Application 2019 & 2032
- Table 38: Global Natural Pigments for Feed Revenue million Forecast, by Application 2019 & 2032
- Table 39: Global Natural Pigments for Feed Revenue million Forecast, by Types 2019 & 2032
- Table 40: Global Natural Pigments for Feed Revenue million Forecast, by Country 2019 & 2032
- Table 41: China Natural Pigments for Feed Revenue (million) Forecast, by Application 2019 & 2032
- Table 42: India Natural Pigments for Feed Revenue (million) Forecast, by Application 2019 & 2032
- Table 43: Japan Natural Pigments for Feed Revenue (million) Forecast, by Application 2019 & 2032
- Table 44: South Korea Natural Pigments for Feed Revenue (million) Forecast, by Application 2019 & 2032
- Table 45: ASEAN Natural Pigments for Feed Revenue (million) Forecast, by Application 2019 & 2032
- Table 46: Oceania Natural Pigments for Feed Revenue (million) Forecast, by Application 2019 & 2032
- Table 47: Rest of Asia Pacific Natural Pigments for Feed Revenue (million) Forecast, by Application 2019 & 2032
Frequently Asked Questions
1. What is the projected Compound Annual Growth Rate (CAGR) of the Natural Pigments for Feed?
The projected CAGR is approximately 5.2%.
2. Which companies are prominent players in the Natural Pigments for Feed?
Key companies in the market include DSM, BASF, Allied Biotech, Chenguang Biotech, FMC, Dohler, Chr. Hansen, Carotech, DDW, Excelvite, Anhui Wisdom, Tian Yin, Kemin.
3. What are the main segments of the Natural Pigments for Feed?
The market segments include Application, Types.
4. Can you provide details about the market size?
The market size is estimated to be USD 458 million as of 2022.
5. What are some drivers contributing to market growth?
N/A
6. What are the notable trends driving market growth?
N/A
7. Are there any restraints impacting market growth?
N/A
8. Can you provide examples of recent developments in the market?
N/A
9. What pricing options are available for accessing the report?
Pricing options include single-user, multi-user, and enterprise licenses priced at USD 2900.00, USD 4350.00, and USD 5800.00 respectively.
10. Is the market size provided in terms of value or volume?
The market size is provided in terms of value, measured in million.
11. Are there any specific market keywords associated with the report?
Yes, the market keyword associated with the report is "Natural Pigments for Feed," which aids in identifying and referencing the specific market segment covered.
12. How do I determine which pricing option suits my needs best?
The pricing options vary based on user requirements and access needs. Individual users may opt for single-user licenses, while businesses requiring broader access may choose multi-user or enterprise licenses for cost-effective access to the report.
13. Are there any additional resources or data provided in the Natural Pigments for Feed report?
While the report offers comprehensive insights, it's advisable to review the specific contents or supplementary materials provided to ascertain if additional resources or data are available.
14. How can I stay updated on further developments or reports in the Natural Pigments for Feed?
To stay informed about further developments, trends, and reports in the Natural Pigments for Feed, consider subscribing to industry newsletters, following relevant companies and organizations, or regularly checking reputable industry news sources and publications.
Methodology
Step 1 - Identification of Relevant Samples Size from Population Database


Step 2 - Approaches for Defining Global Market Size (Value, Volume* & Price*)

Note*: In applicable scenarios
Step 3 - Data Sources
Primary Research
- Web Analytics
- Survey Reports
- Research Institute
- Latest Research Reports
- Opinion Leaders
Secondary Research
- Annual Reports
- White Paper
- Latest Press Release
- Industry Association
- Paid Database
- Investor Presentations

Step 4 - Data Triangulation
Involves using different sources of information in order to increase the validity of a study
These sources are likely to be stakeholders in a program - participants, other researchers, program staff, other community members, and so on.
Then we put all data in single framework & apply various statistical tools to find out the dynamic on the market.
During the analysis stage, feedback from the stakeholder groups would be compared to determine areas of agreement as well as areas of divergence
