

Key Insights
The global aromatics market is projected to reach $297087.2 million by 2025, exhibiting a Compound Annual Growth Rate (CAGR) of 5.5% through 2033. This expansion is propelled by escalating demand from downstream sectors including plastics, synthetic fibers, and rubber. Key drivers include the growing production of polyethylene terephthalate (PET) for packaging applications and the automotive industry's need for advanced polymers. Technological innovations enhancing production efficiency and the development of sustainable aromatics manufacturing processes also contribute to market growth. Ethylbenzene, cumene, and alkylbenzene derivatives are prominent due to their widespread industrial applications. Nevertheless, stringent environmental regulations on emissions and waste management present a challenge, necessitating the adoption of cleaner production technologies and sustainable practices. The Asia-Pacific region, led by China and India, holds a significant market share, supported by rapid industrialization and increasing consumer demand. North America and Europe are also key markets, although experiencing slower growth due to market maturity.
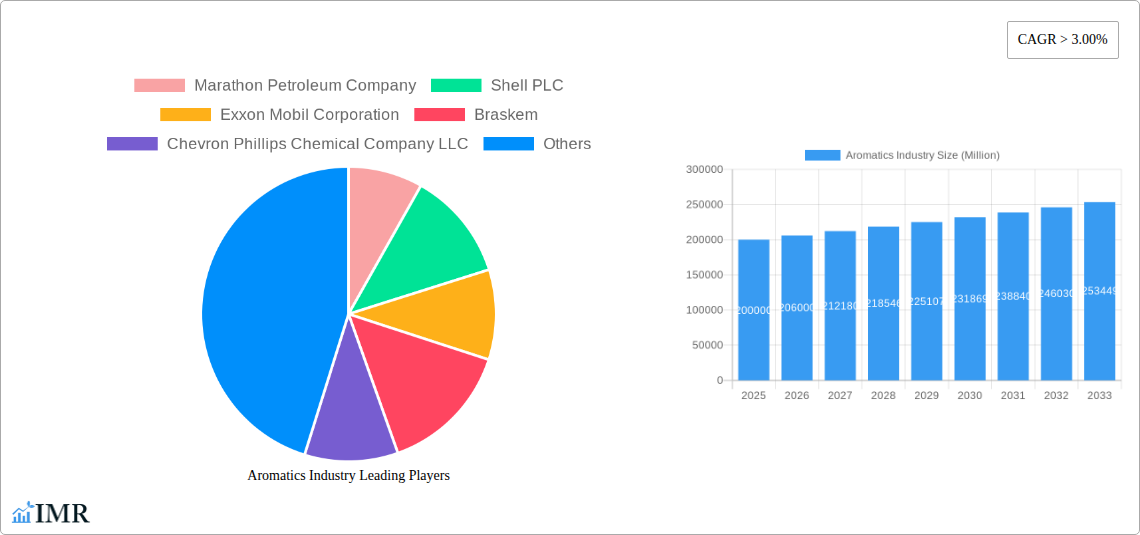
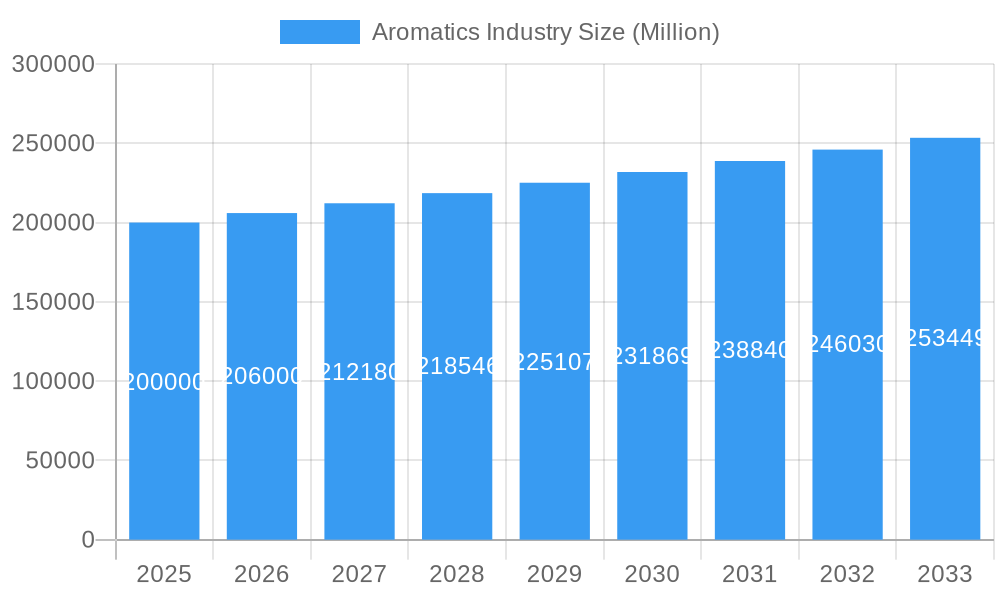
Aromatics Industry Market Size (In Billion)
The competitive environment is characterized by industry consolidation through mergers and acquisitions, alongside ongoing research and development aimed at improving product quality and operational efficiency. While fluctuations in crude oil prices and environmental considerations remain challenges, the market outlook is positive, driven by sustained demand across diverse end-use industries. The emerging adoption of bio-based aromatics presents considerable opportunities for market participants. Growth in developing economies will continue to stimulate demand, counterbalancing slower growth in mature markets.
Aromatics Industry Company Market Share
Aromatics Industry Market Report: 2019-2033
This comprehensive report provides a detailed analysis of the Aromatics Industry, encompassing market dynamics, growth trends, regional insights, and key player strategies from 2019 to 2033. With a focus on parent markets (Petrochemicals) and child markets (Ethylbenzene, Cumene, Alkylbenzene, etc.), this report is an essential resource for industry professionals, investors, and strategic decision-makers. The study period covers 2019-2033, with 2025 as the base and estimated year.
Aromatics Industry Market Dynamics & Structure
The global aromatics market, valued at xx Million units in 2024, is characterized by moderate concentration, with a few major players holding significant market share. Technological innovation, particularly in process efficiency and product diversification, is a key driver. Stringent environmental regulations are shaping production methods, pushing companies towards sustainable practices. Competitive substitutes, such as bio-based aromatics, are emerging, although their market penetration remains limited. End-user industries, including plastics, fibers, and rubber, significantly influence demand. Mergers and acquisitions (M&A) activity has been substantial, with major players strategically expanding their footprint.
- Market Concentration: Highly concentrated, with top 10 players holding approximately xx% market share in 2024.
- Technological Innovation: Focus on improving catalyst efficiency, reducing energy consumption, and developing advanced materials.
- Regulatory Framework: Stringent emission standards and environmental regulations are driving technological advancements and influencing production costs.
- Competitive Substitutes: Bio-based aromatics pose a long-term threat, but their current market share is relatively small (xx%).
- End-User Demographics: Demand is primarily driven by the plastics, fibers, and rubber industries, with automotive and construction sectors also contributing significantly.
- M&A Trends: Significant M&A activity observed, particularly in Asia, aiming to expand production capacity and market access. xx major deals in the last 5 years with a total value of xx Million units.
Aromatics Industry Growth Trends & Insights
The global aromatics market is projected to witness robust growth throughout the forecast period (2025-2033). Driven by increasing demand from downstream industries and expanding applications in various sectors, the market is expected to achieve a Compound Annual Growth Rate (CAGR) of xx% from 2025 to 2033, reaching a projected value of xx Million units by 2033. This growth is fueled by several factors, including rapid industrialization in developing economies, technological advancements leading to improved product performance, and increasing adoption of aromatics-based products across diverse applications. Consumer preference shifts towards durable and high-performance materials also contribute positively to market growth. Technological disruptions, such as the emergence of advanced polymerization techniques, are further enhancing market dynamics. The increasing use of aromatics in high-value applications like specialty chemicals and advanced materials is another key growth driver. However, fluctuating crude oil prices and potential supply chain disruptions remain challenges.
Dominant Regions, Countries, or Segments in Aromatics Industry
Asia-Pacific, particularly China, dominates the global aromatics market, driven by robust economic growth, expanding industrial capacity, and increasing downstream demand. The region accounts for approximately xx% of the global market share in 2024. Within the derivative segments, Ethylbenzene and Cumene hold the largest market shares, driven by their extensive applications in the production of styrene and phenol, respectively. The growth in these segments is further propelled by government incentives, investments in petrochemical infrastructure, and increasing demand from diverse end-use sectors such as packaging, automotive, and construction.
Key Drivers (Asia-Pacific):
- Rapid industrialization and urbanization.
- Substantial investments in petrochemical infrastructure.
- Favorable government policies supporting industrial growth.
- Increasing consumer demand for products using aromatics.
Ethylbenzene and Cumene Dominance: High demand from styrene and phenol production, respectively; wide applications across various industries.
Aromatics Industry Product Landscape
The aromatics product landscape is characterized by continuous innovation, with a focus on developing high-performance materials with enhanced properties like improved thermal stability, superior strength, and better resistance to chemicals. New applications are constantly emerging, extending beyond traditional uses in polymers to encompass specialized materials for electronics, healthcare, and aerospace. Technological advancements are primarily centered around improving catalyst efficiency and developing more sustainable production processes. Key selling propositions include cost-effectiveness, performance enhancement, and environmentally friendly production methods.
Key Drivers, Barriers & Challenges in Aromatics Industry
Key Drivers:
- Rising demand from downstream industries.
- Technological advancements in production processes.
- Growing applications in diverse sectors.
- Favorable government policies in key regions.
Key Challenges:
- Fluctuating crude oil prices impacting production costs.
- Stringent environmental regulations requiring substantial investments in compliance.
- Intense competition among major players.
- Potential supply chain disruptions due to geopolitical uncertainties. (Estimated impact on market growth: xx% in 2024)
Emerging Opportunities in Aromatics Industry
- Expanding into high-growth regions with increasing demand.
- Developing sustainable and bio-based aromatics.
- Leveraging advanced technologies to improve product efficiency and reduce environmental impact.
- Exploring new applications in specialized industries such as advanced materials and electronics.
Growth Accelerators in the Aromatics Industry
Technological breakthroughs in catalyst design and process optimization are significantly accelerating growth. Strategic partnerships between major players are enhancing supply chain efficiency and market access. Expansion into emerging markets with strong industrial growth potential is another key accelerator, further enhancing the market outlook.
Key Players Shaping the Aromatics Industry Market
- Marathon Petroleum Company
- Shell PLC
- Exxon Mobil Corporation
- Braskem
- Chevron Phillips Chemical Company LLC
- INEOS
- Mitsubishi Chemical Corporation
- Reliance Industries Limited
- China Petroleum & Chemical Corporation
- BASF SE
- SABIC
- LG Chem
- Eastman Chemical Company
- Maruzen Petrochemical
- LyondellBasell Industries Holdings BV
- Flint Hills Resources
- SIBUR
- Hengyi Industries Sdn Bhd
Notable Milestones in Aromatics Industry Sector
- July 2022: INEOS acquires a 50% stake in Shanghai SECCO Petrochemical Company Limited, significantly expanding its presence in the Chinese aromatics market and gaining access to a substantial production capacity of 4.2 MMT of petrochemicals. This milestone highlights the ongoing consolidation within the industry and the strategic importance of the Chinese market.
In-Depth Aromatics Industry Market Outlook
The aromatics market is poised for sustained growth, driven by the factors mentioned earlier. Strategic opportunities lie in developing sustainable production methods, expanding into high-growth markets, and diversifying product applications into emerging sectors like advanced materials and renewable energy. Continued technological innovation, particularly in catalyst development and process optimization, will further enhance market potential, leading to a larger and more sustainable aromatics industry in the coming years.
Aromatics Industry Segmentation
-
1. Derivative
- 1.1. Ethylbenzene
- 1.2. Cumene
- 1.3. Alkylbenzene
- 1.4. Cyclohexane
- 1.5. Nitrobenzene
- 1.6. Other De
Aromatics Industry Segmentation By Geography
-
1. Asia Pacific
- 1.1. China
- 1.2. India
- 1.3. Japan
- 1.4. South Korea
- 1.5. Rest of Asia Pacific
-
2. North America
- 2.1. United States
- 2.2. Canada
- 2.3. Mexico
-
3. Europe
- 3.1. Germany
- 3.2. United Kingdom
- 3.3. Italy
- 3.4. France
- 3.5. Russia
- 3.6. Rest of Europe
-
4. South America
- 4.1. Brazil
- 4.2. Argentina
- 4.3. Rest of South America
-
5. Middle East and Africa
- 5.1. Saudi Arabia
- 5.2. South Africa
- 5.3. Rest of Middle East and Africa
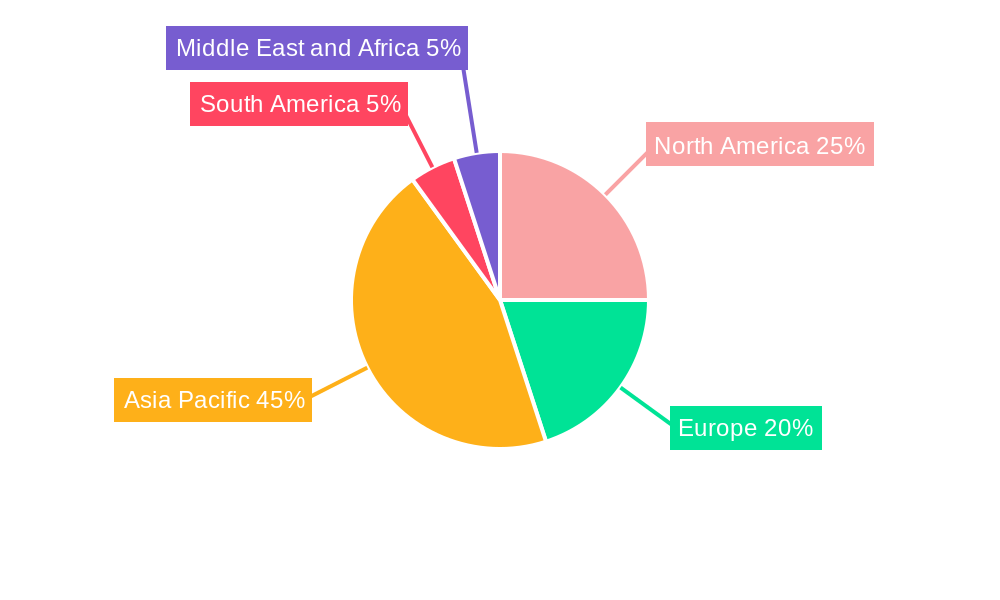
Aromatics Industry Regional Market Share
Geographic Coverage of Aromatics Industry
Aromatics Industry REPORT HIGHLIGHTS
| Aspects | Details |
|---|---|
| Study Period | 2020-2034 |
| Base Year | 2025 |
| Estimated Year | 2026 |
| Forecast Period | 2026-2034 |
| Historical Period | 2020-2025 |
| Growth Rate | CAGR of 5.5% from 2020-2034 |
| Segmentation |
|
Table of Contents
- 1. Introduction
- 1.1. Research Scope
- 1.2. Market Segmentation
- 1.3. Research Objective
- 1.4. Definitions and Assumptions
- 2. Executive Summary
- 2.1. Market Snapshot
- 3. Market Dynamics
- 3.1. Market Drivers
- 3.2. Market Restrains
- 3.3. Market Trends
- 3.4. Market Opportunities
- 4. Market Factor Analysis
- 4.1. Porters Five Forces
- 4.1.1. Bargaining Power of Suppliers
- 4.1.2. Bargaining Power of Buyers
- 4.1.3. Threat of New Entrants
- 4.1.4. Threat of Substitutes
- 4.1.5. Competitive Rivalry
- 4.2. PESTEL analysis
- 4.3. BCG Analysis
- 4.3.1. Stars (High Growth, High Market Share)
- 4.3.2. Cash Cows (Low Growth, High Market Share)
- 4.3.3. Question Mark (High Growth, Low Market Share)
- 4.3.4. Dogs (Low Growth, Low Market Share)
- 4.4. Ansoff Matrix Analysis
- 4.5. Supply Chain Analysis
- 4.6. Regulatory Landscape
- 4.7. Current Market Potential and Opportunity Assessment (TAM–SAM–SOM Framework)
- 4.8. IMR Analyst Note
- 4.1. Porters Five Forces
- 5. Market Analysis, Insights and Forecast 2021-2033
- 5.1. Market Analysis, Insights and Forecast - by Derivative
- 5.1.1. Ethylbenzene
- 5.1.2. Cumene
- 5.1.3. Alkylbenzene
- 5.1.4. Cyclohexane
- 5.1.5. Nitrobenzene
- 5.1.6. Other De
- 5.2. Market Analysis, Insights and Forecast - by Region
- 5.2.1. Asia Pacific
- 5.2.2. North America
- 5.2.3. Europe
- 5.2.4. South America
- 5.2.5. Middle East and Africa
- 5.1. Market Analysis, Insights and Forecast - by Derivative
- 6. Global Aromatics Industry Analysis, Insights and Forecast, 2021-2033
- 6.1. Market Analysis, Insights and Forecast - by Derivative
- 6.1.1. Ethylbenzene
- 6.1.2. Cumene
- 6.1.3. Alkylbenzene
- 6.1.4. Cyclohexane
- 6.1.5. Nitrobenzene
- 6.1.6. Other De
- 6.1. Market Analysis, Insights and Forecast - by Derivative
- 7. Asia Pacific Aromatics Industry Analysis, Insights and Forecast, 2020-2032
- 7.1. Market Analysis, Insights and Forecast - by Derivative
- 7.1.1. Ethylbenzene
- 7.1.2. Cumene
- 7.1.3. Alkylbenzene
- 7.1.4. Cyclohexane
- 7.1.5. Nitrobenzene
- 7.1.6. Other De
- 7.1. Market Analysis, Insights and Forecast - by Derivative
- 8. North America Aromatics Industry Analysis, Insights and Forecast, 2020-2032
- 8.1. Market Analysis, Insights and Forecast - by Derivative
- 8.1.1. Ethylbenzene
- 8.1.2. Cumene
- 8.1.3. Alkylbenzene
- 8.1.4. Cyclohexane
- 8.1.5. Nitrobenzene
- 8.1.6. Other De
- 8.1. Market Analysis, Insights and Forecast - by Derivative
- 9. Europe Aromatics Industry Analysis, Insights and Forecast, 2020-2032
- 9.1. Market Analysis, Insights and Forecast - by Derivative
- 9.1.1. Ethylbenzene
- 9.1.2. Cumene
- 9.1.3. Alkylbenzene
- 9.1.4. Cyclohexane
- 9.1.5. Nitrobenzene
- 9.1.6. Other De
- 9.1. Market Analysis, Insights and Forecast - by Derivative
- 10. South America Aromatics Industry Analysis, Insights and Forecast, 2020-2032
- 10.1. Market Analysis, Insights and Forecast - by Derivative
- 10.1.1. Ethylbenzene
- 10.1.2. Cumene
- 10.1.3. Alkylbenzene
- 10.1.4. Cyclohexane
- 10.1.5. Nitrobenzene
- 10.1.6. Other De
- 10.1. Market Analysis, Insights and Forecast - by Derivative
- 11. Middle East and Africa Aromatics Industry Analysis, Insights and Forecast, 2020-2032
- 11.1. Market Analysis, Insights and Forecast - by Derivative
- 11.1.1. Ethylbenzene
- 11.1.2. Cumene
- 11.1.3. Alkylbenzene
- 11.1.4. Cyclohexane
- 11.1.5. Nitrobenzene
- 11.1.6. Other De
- 11.1. Market Analysis, Insights and Forecast - by Derivative
- 12. Competitive Analysis
- 12.1. Company Profiles
- 12.1.1 Marathon Petroleum Company
- 12.1.1.1. Company Overview
- 12.1.1.2. Products
- 12.1.1.3. Company Financials
- 12.1.1.4. SWOT Analysis
- 12.1.2 Shell PLC
- 12.1.2.1. Company Overview
- 12.1.2.2. Products
- 12.1.2.3. Company Financials
- 12.1.2.4. SWOT Analysis
- 12.1.3 Exxon Mobil Corporation
- 12.1.3.1. Company Overview
- 12.1.3.2. Products
- 12.1.3.3. Company Financials
- 12.1.3.4. SWOT Analysis
- 12.1.4 Braskem
- 12.1.4.1. Company Overview
- 12.1.4.2. Products
- 12.1.4.3. Company Financials
- 12.1.4.4. SWOT Analysis
- 12.1.5 Chevron Phillips Chemical Company LLC
- 12.1.5.1. Company Overview
- 12.1.5.2. Products
- 12.1.5.3. Company Financials
- 12.1.5.4. SWOT Analysis
- 12.1.6 INEOS
- 12.1.6.1. Company Overview
- 12.1.6.2. Products
- 12.1.6.3. Company Financials
- 12.1.6.4. SWOT Analysis
- 12.1.7 Mitsubishi Chemical Corporation
- 12.1.7.1. Company Overview
- 12.1.7.2. Products
- 12.1.7.3. Company Financials
- 12.1.7.4. SWOT Analysis
- 12.1.8 Reliance Industries Limited
- 12.1.8.1. Company Overview
- 12.1.8.2. Products
- 12.1.8.3. Company Financials
- 12.1.8.4. SWOT Analysis
- 12.1.9 China Petroleum & Chemical Corporation
- 12.1.9.1. Company Overview
- 12.1.9.2. Products
- 12.1.9.3. Company Financials
- 12.1.9.4. SWOT Analysis
- 12.1.10 BASF SE
- 12.1.10.1. Company Overview
- 12.1.10.2. Products
- 12.1.10.3. Company Financials
- 12.1.10.4. SWOT Analysis
- 12.1.11 SABIC
- 12.1.11.1. Company Overview
- 12.1.11.2. Products
- 12.1.11.3. Company Financials
- 12.1.11.4. SWOT Analysis
- 12.1.12 LG Chem
- 12.1.12.1. Company Overview
- 12.1.12.2. Products
- 12.1.12.3. Company Financials
- 12.1.12.4. SWOT Analysis
- 12.1.13 Eastman Chemical Company
- 12.1.13.1. Company Overview
- 12.1.13.2. Products
- 12.1.13.3. Company Financials
- 12.1.13.4. SWOT Analysis
- 12.1.14 Maruzen Petrochemical
- 12.1.14.1. Company Overview
- 12.1.14.2. Products
- 12.1.14.3. Company Financials
- 12.1.14.4. SWOT Analysis
- 12.1.15 LyondellBasell Industries Holdings BV
- 12.1.15.1. Company Overview
- 12.1.15.2. Products
- 12.1.15.3. Company Financials
- 12.1.15.4. SWOT Analysis
- 12.1.16 Flint Hills Resources
- 12.1.16.1. Company Overview
- 12.1.16.2. Products
- 12.1.16.3. Company Financials
- 12.1.16.4. SWOT Analysis
- 12.1.17 SIBUR*List Not Exhaustive
- 12.1.17.1. Company Overview
- 12.1.17.2. Products
- 12.1.17.3. Company Financials
- 12.1.17.4. SWOT Analysis
- 12.1.18 Hengyi Industries Sdn Bhd
- 12.1.18.1. Company Overview
- 12.1.18.2. Products
- 12.1.18.3. Company Financials
- 12.1.18.4. SWOT Analysis
- 12.1.1 Marathon Petroleum Company
- 12.2. Market Entropy
- 12.2.1 Company's Key Areas Served
- 12.2.2 Recent Developments
- 12.3. Company Market Share Analysis 2025
- 12.3.1 Top 5 Companies Market Share Analysis
- 12.3.2 Top 3 Companies Market Share Analysis
- 12.4. List of Potential Customers
- 13. Research Methodology
List of Figures
- Figure 1: Global Aromatics Industry Revenue Breakdown (million, %) by Region 2025 & 2033
- Figure 2: Asia Pacific Aromatics Industry Revenue (million), by Derivative 2025 & 2033
- Figure 3: Asia Pacific Aromatics Industry Revenue Share (%), by Derivative 2025 & 2033
- Figure 4: Asia Pacific Aromatics Industry Revenue (million), by Country 2025 & 2033
- Figure 5: Asia Pacific Aromatics Industry Revenue Share (%), by Country 2025 & 2033
- Figure 6: North America Aromatics Industry Revenue (million), by Derivative 2025 & 2033
- Figure 7: North America Aromatics Industry Revenue Share (%), by Derivative 2025 & 2033
- Figure 8: North America Aromatics Industry Revenue (million), by Country 2025 & 2033
- Figure 9: North America Aromatics Industry Revenue Share (%), by Country 2025 & 2033
- Figure 10: Europe Aromatics Industry Revenue (million), by Derivative 2025 & 2033
- Figure 11: Europe Aromatics Industry Revenue Share (%), by Derivative 2025 & 2033
- Figure 12: Europe Aromatics Industry Revenue (million), by Country 2025 & 2033
- Figure 13: Europe Aromatics Industry Revenue Share (%), by Country 2025 & 2033
- Figure 14: South America Aromatics Industry Revenue (million), by Derivative 2025 & 2033
- Figure 15: South America Aromatics Industry Revenue Share (%), by Derivative 2025 & 2033
- Figure 16: South America Aromatics Industry Revenue (million), by Country 2025 & 2033
- Figure 17: South America Aromatics Industry Revenue Share (%), by Country 2025 & 2033
- Figure 18: Middle East and Africa Aromatics Industry Revenue (million), by Derivative 2025 & 2033
- Figure 19: Middle East and Africa Aromatics Industry Revenue Share (%), by Derivative 2025 & 2033
- Figure 20: Middle East and Africa Aromatics Industry Revenue (million), by Country 2025 & 2033
- Figure 21: Middle East and Africa Aromatics Industry Revenue Share (%), by Country 2025 & 2033
List of Tables
- Table 1: Global Aromatics Industry Revenue million Forecast, by Derivative 2020 & 2033
- Table 2: Global Aromatics Industry Revenue million Forecast, by Region 2020 & 2033
- Table 3: Global Aromatics Industry Revenue million Forecast, by Derivative 2020 & 2033
- Table 4: Global Aromatics Industry Revenue million Forecast, by Country 2020 & 2033
- Table 5: China Aromatics Industry Revenue (million) Forecast, by Application 2020 & 2033
- Table 6: India Aromatics Industry Revenue (million) Forecast, by Application 2020 & 2033
- Table 7: Japan Aromatics Industry Revenue (million) Forecast, by Application 2020 & 2033
- Table 8: South Korea Aromatics Industry Revenue (million) Forecast, by Application 2020 & 2033
- Table 9: Rest of Asia Pacific Aromatics Industry Revenue (million) Forecast, by Application 2020 & 2033
- Table 10: Global Aromatics Industry Revenue million Forecast, by Derivative 2020 & 2033
- Table 11: Global Aromatics Industry Revenue million Forecast, by Country 2020 & 2033
- Table 12: United States Aromatics Industry Revenue (million) Forecast, by Application 2020 & 2033
- Table 13: Canada Aromatics Industry Revenue (million) Forecast, by Application 2020 & 2033
- Table 14: Mexico Aromatics Industry Revenue (million) Forecast, by Application 2020 & 2033
- Table 15: Global Aromatics Industry Revenue million Forecast, by Derivative 2020 & 2033
- Table 16: Global Aromatics Industry Revenue million Forecast, by Country 2020 & 2033
- Table 17: Germany Aromatics Industry Revenue (million) Forecast, by Application 2020 & 2033
- Table 18: United Kingdom Aromatics Industry Revenue (million) Forecast, by Application 2020 & 2033
- Table 19: Italy Aromatics Industry Revenue (million) Forecast, by Application 2020 & 2033
- Table 20: France Aromatics Industry Revenue (million) Forecast, by Application 2020 & 2033
- Table 21: Russia Aromatics Industry Revenue (million) Forecast, by Application 2020 & 2033
- Table 22: Rest of Europe Aromatics Industry Revenue (million) Forecast, by Application 2020 & 2033
- Table 23: Global Aromatics Industry Revenue million Forecast, by Derivative 2020 & 2033
- Table 24: Global Aromatics Industry Revenue million Forecast, by Country 2020 & 2033
- Table 25: Brazil Aromatics Industry Revenue (million) Forecast, by Application 2020 & 2033
- Table 26: Argentina Aromatics Industry Revenue (million) Forecast, by Application 2020 & 2033
- Table 27: Rest of South America Aromatics Industry Revenue (million) Forecast, by Application 2020 & 2033
- Table 28: Global Aromatics Industry Revenue million Forecast, by Derivative 2020 & 2033
- Table 29: Global Aromatics Industry Revenue million Forecast, by Country 2020 & 2033
- Table 30: Saudi Arabia Aromatics Industry Revenue (million) Forecast, by Application 2020 & 2033
- Table 31: South Africa Aromatics Industry Revenue (million) Forecast, by Application 2020 & 2033
- Table 32: Rest of Middle East and Africa Aromatics Industry Revenue (million) Forecast, by Application 2020 & 2033
Frequently Asked Questions
1. What is the projected Compound Annual Growth Rate (CAGR) of the Aromatics Industry?
The projected CAGR is approximately 5.5%.
2. Which companies are prominent players in the Aromatics Industry?
Key companies in the market include Marathon Petroleum Company, Shell PLC, Exxon Mobil Corporation, Braskem, Chevron Phillips Chemical Company LLC, INEOS, Mitsubishi Chemical Corporation, Reliance Industries Limited, China Petroleum & Chemical Corporation, BASF SE, SABIC, LG Chem, Eastman Chemical Company, Maruzen Petrochemical, LyondellBasell Industries Holdings BV, Flint Hills Resources, SIBUR*List Not Exhaustive, Hengyi Industries Sdn Bhd.
3. What are the main segments of the Aromatics Industry?
The market segments include Derivative.
4. Can you provide details about the market size?
The market size is estimated to be USD 297087.2 million as of 2022.
5. What are some drivers contributing to market growth?
Increasing Demand for Styrene Polymers from Various End-user Industries; Other Drivers.
6. What are the notable trends driving market growth?
Increasing Demand for Ethylbenzene.
7. Are there any restraints impacting market growth?
Detrimental Effects of Benzene Exposure; Other Restraints.
8. Can you provide examples of recent developments in the market?
July 2022: INEOS agreed to acquire a 50% stake in Shanghai SECCO Petrochemical Company Limited, a subsidiary of China Petroleum & Chemical Corporation (SINOPEC). SECCO currently has a production capacity of 4.2 MMT of petrochemicals - including ethylene, propylene, polyethylene, polypropylene, styrene, polystyrene, acrylonitrile, butadiene, benzene, and toluene. It is a 200-hectare facility, located inside the Shanghai Chemical Industry Park. This will help the company to strengthen the company's hold in China.
9. What pricing options are available for accessing the report?
Pricing options include single-user, multi-user, and enterprise licenses priced at USD 4750, USD 5250, and USD 8750 respectively.
10. Is the market size provided in terms of value or volume?
The market size is provided in terms of value, measured in million.
11. Are there any specific market keywords associated with the report?
Yes, the market keyword associated with the report is "Aromatics Industry," which aids in identifying and referencing the specific market segment covered.
12. How do I determine which pricing option suits my needs best?
The pricing options vary based on user requirements and access needs. Individual users may opt for single-user licenses, while businesses requiring broader access may choose multi-user or enterprise licenses for cost-effective access to the report.
13. Are there any additional resources or data provided in the Aromatics Industry report?
While the report offers comprehensive insights, it's advisable to review the specific contents or supplementary materials provided to ascertain if additional resources or data are available.
14. How can I stay updated on further developments or reports in the Aromatics Industry?
To stay informed about further developments, trends, and reports in the Aromatics Industry, consider subscribing to industry newsletters, following relevant companies and organizations, or regularly checking reputable industry news sources and publications.
Methodology
Step 1 - Identification of Relevant Samples Size from Population Database


Step 2 - Approaches for Defining Global Market Size (Value, Volume* & Price*)

Note*: In applicable scenarios
Step 3 - Data Sources
Primary Research
- Web Analytics
- Survey Reports
- Research Institute
- Latest Research Reports
- Opinion Leaders
Secondary Research
- Annual Reports
- White Paper
- Latest Press Release
- Industry Association
- Paid Database
- Investor Presentations

Step 4 - Data Triangulation
Involves using different sources of information in order to increase the validity of a study
These sources are likely to be stakeholders in a program - participants, other researchers, program staff, other community members, and so on.
Then we put all data in single framework & apply various statistical tools to find out the dynamic on the market.
During the analysis stage, feedback from the stakeholder groups would be compared to determine areas of agreement as well as areas of divergence