

Key Insights
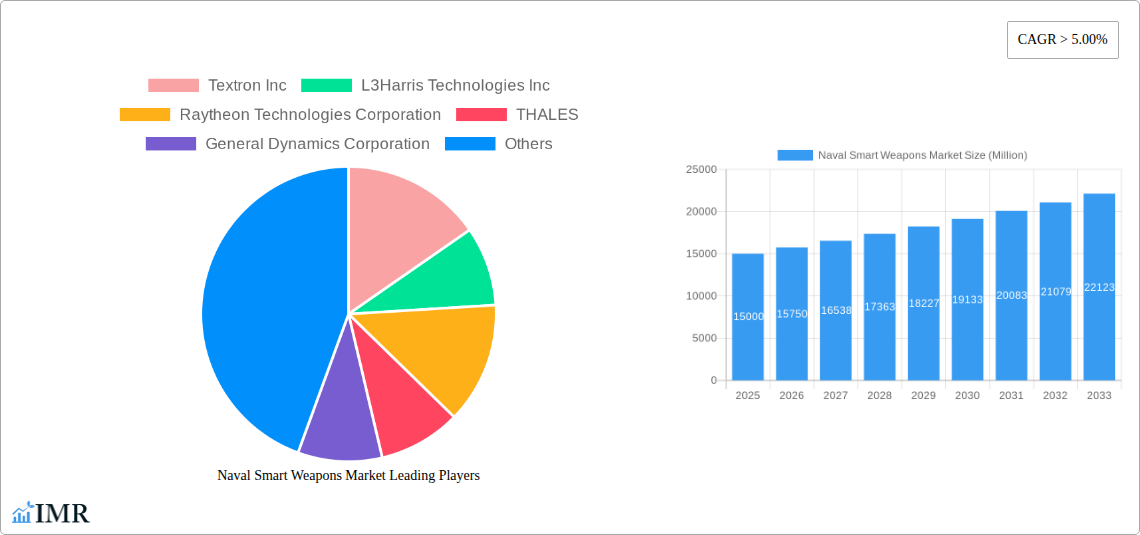
The naval smart weapons market is experiencing robust growth, driven by escalating geopolitical tensions, modernization of naval fleets globally, and the increasing demand for precision-guided munitions. The market, valued at approximately $15 billion in 2025, is projected to maintain a Compound Annual Growth Rate (CAGR) exceeding 5% through 2033. This growth is fueled by several key factors. Firstly, advancements in guidance technologies, such as laser, radar, satellite, and infrared guidance systems, are enhancing the accuracy and effectiveness of naval smart weapons, leading to increased adoption. Secondly, the rising emphasis on asymmetric warfare necessitates the deployment of precision-guided munitions to minimize collateral damage and enhance operational efficiency. Furthermore, major naval powers are actively investing in upgrading their arsenals with advanced smart weapon systems, contributing significantly to market expansion. Competition among leading defense contractors is also fostering innovation and driving down costs, making these advanced weapons more accessible to a broader range of naval forces.
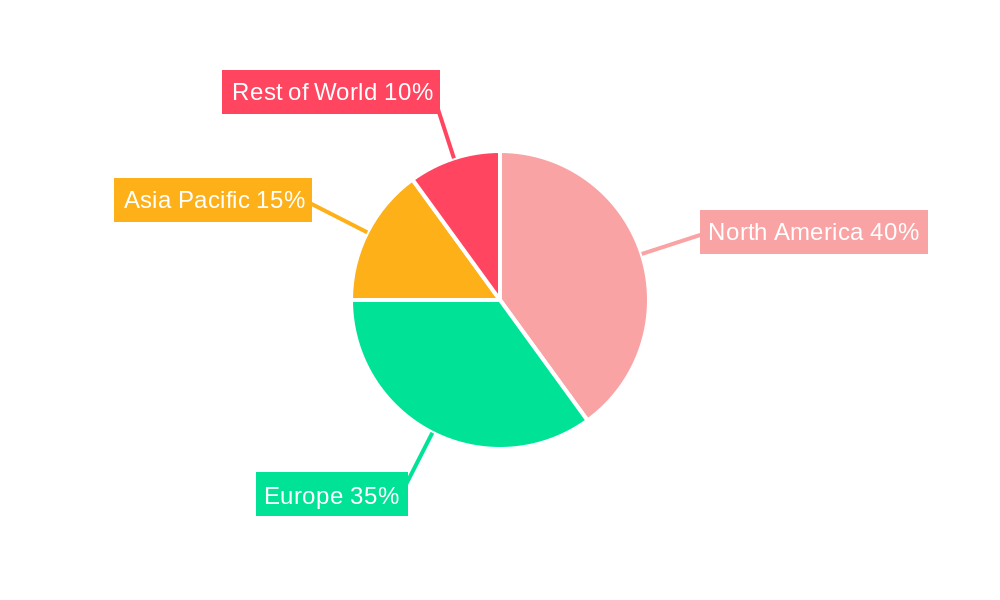
Segment-wise analysis reveals a significant demand for missiles, followed by ammunition and other supporting products. Within guidance technologies, laser and radar guidance systems currently dominate the market due to their proven reliability and cost-effectiveness. However, satellite and infrared guidance systems are witnessing rapid growth, driven by their enhanced precision and ability to engage targets in challenging environments. Regionally, North America and Europe are currently the largest markets, owing to robust defense budgets and technological advancements. However, the Asia-Pacific region is expected to experience the fastest growth rate in the forecast period, fueled by increasing military expenditure and modernization efforts in countries like China and India. The continued development of hypersonic weapons and the integration of artificial intelligence in smart weapon systems are key long-term trends that will further shape this dynamic market.
Naval Smart Weapons Market: A Comprehensive Market Report (2019-2033)
This in-depth report provides a comprehensive analysis of the Naval Smart Weapons market, encompassing market dynamics, growth trends, regional dominance, product landscape, challenges, opportunities, and key players. The report covers the period 2019-2033, with a focus on the forecast period 2025-2033 and a base year of 2025. The parent market is the defense industry, and the child market is naval weaponry. This report is essential for industry professionals, investors, and stakeholders seeking to understand and capitalize on the growth potential within this dynamic sector. Market values are presented in million units.
Naval Smart Weapons Market Dynamics & Structure
The Naval Smart Weapons market is characterized by a moderately concentrated structure, with several major players holding significant market share. Technological innovation, particularly in guidance systems and lethality, is a key driver. Stringent regulatory frameworks and export controls influence market access and growth. Competitive product substitutes, such as traditional unguided munitions, continue to exist, albeit with decreasing market share. The end-user demographic is primarily comprised of naval forces globally, with spending patterns influenced by geopolitical factors and defense budgets. M&A activity has been moderate, with a focus on consolidating technological capabilities and expanding global reach. Over the historical period (2019-2024), approximately xx M&A deals were recorded, resulting in a xx% market share shift among the top 5 players.
- Market Concentration: Moderately concentrated, with top 5 players holding xx% market share (2024).
- Technological Innovation: Focus on precision-guided munitions, AI integration, and advanced sensor technologies.
- Regulatory Frameworks: Stringent export controls and safety regulations impacting market access.
- Competitive Substitutes: Traditional unguided munitions pose a limited threat.
- End-User Demographics: Primarily naval forces of major global powers.
- M&A Trends: Moderate activity, driven by technological consolidation and market expansion.
Naval Smart Weapons Market Growth Trends & Insights
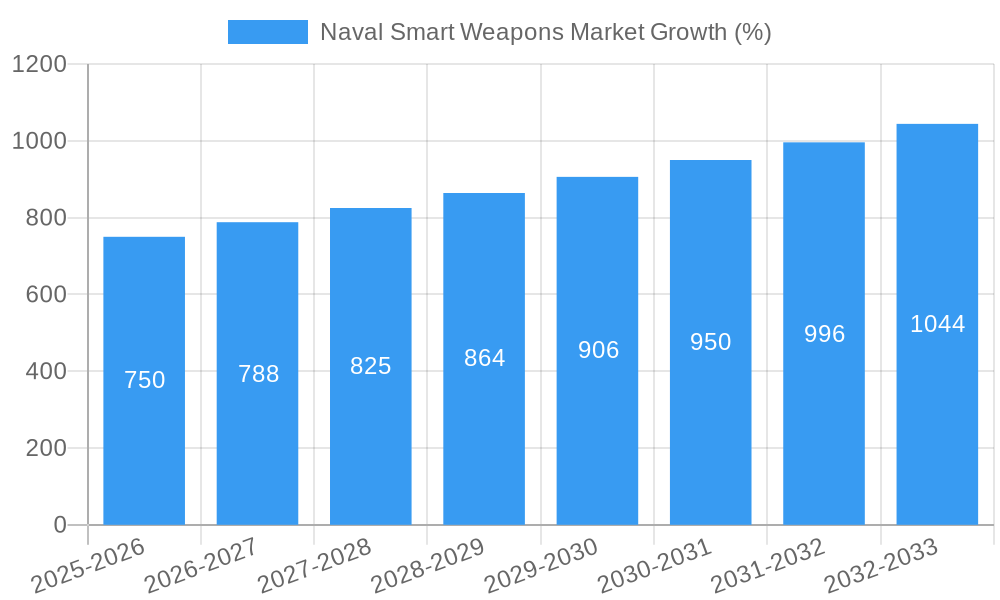
The Naval Smart Weapons market has witnessed consistent growth over the historical period (2019-2024), driven by increasing defense budgets, modernization programs, and the demand for precision-guided munitions. The market size reached xx million units in 2024 and is projected to grow at a Compound Annual Growth Rate (CAGR) of xx% during the forecast period (2025-2033), reaching xx million units by 2033. This growth is fueled by technological advancements, such as the increasing adoption of laser and satellite guidance systems, and the integration of Artificial Intelligence (AI) for improved targeting and autonomous operation. Shifts in consumer (naval forces) behavior are evident in the increasing preference for smart weapons due to their improved accuracy, reduced collateral damage, and enhanced operational effectiveness.
Dominant Regions, Countries, or Segments in Naval Smart Weapons Market
The North American region (primarily the US) has historically dominated the Naval Smart Weapons market, followed by Europe. Within Weapon Types, Missiles hold the largest market share (xx%), driven by their long-range capabilities and precision targeting. In terms of technology, the demand for Laser Guidance systems and Radar Guidance systems is high, each holding a significant market share. The growth in this segment is attributed to continuous improvements in accuracy and range as well as increased defense spending.
- Key Drivers (North America): High defense budgets, technological advancements, strong domestic industry.
- Key Drivers (Europe): Increased defense spending in response to geopolitical tensions, modernization of naval fleets.
- Weapon Type Dominance: Missiles (xx% market share), driven by range and precision.
- Technology Dominance: Laser Guidance and Radar Guidance systems, driven by accuracy and reliability.
Naval Smart Weapons Market Product Landscape
The Naval Smart Weapons market is characterized by a diverse range of products, encompassing various missile types, ammunition, and other supporting systems. Recent innovations focus on enhanced precision, improved lethality, reduced collateral damage, and improved network-centric capabilities. Key performance indicators include accuracy, range, payload capacity, and reliability. Unique selling propositions often center around advanced guidance systems, improved target acquisition, and reduced life-cycle costs. Technological advancements continue to drive product differentiation, with AI and autonomous capabilities shaping the next generation of naval smart weapons.
Key Drivers, Barriers & Challenges in Naval Smart Weapons Market
Key Drivers:
- Increasing defense budgets globally.
- Growing demand for precision-guided munitions.
- Technological advancements in guidance systems and lethality.
- Modernization of naval fleets.
Challenges & Restraints:
- High research and development costs.
- Stringent regulatory hurdles and export controls.
- Supply chain disruptions impacting production and delivery.
- Intense competition among major players. The impact of these challenges is estimated to reduce the overall market growth by approximately xx% in the coming years.
Emerging Opportunities in Naval Smart Weapons Market
- Untapped markets in developing nations.
- Integration of AI and machine learning for autonomous targeting.
- Development of hypersonic and other advanced weapon systems.
- Growing demand for cyber-resilient and networked smart weapons.
Growth Accelerators in the Naval Smart Weapons Market Industry
Technological breakthroughs in areas such as directed energy weapons (laser and high-powered microwave weapons), improved guidance systems and autonomous operation are expected to propel the market's growth significantly over the forecast period. Strategic partnerships and collaborative R&D among key players and governments, as well as market expansion strategies focused on emerging economies, are also expected to contribute to this growth.
Key Players Shaping the Naval Smart Weapons Market Market
- Textron Inc
- L3Harris Technologies Inc
- Raytheon Technologies Corporation
- THALES
- General Dynamics Corporation
- Rheinmetall AG
- Lockheed Martin Corporation
- MBDA
- Leonardo S p A
- BAE Systems plc
- Northrop Grumman Corporation
- The Boeing Company
Notable Milestones in Naval Smart Weapons Market Sector
- February 2023: US Navy placed a USD 92 million order for weapon assemblies with Northrop Grumman Corporation.
- November 2022: German Navy tested its first high-energy laser weapon.
In-Depth Naval Smart Weapons Market Market Outlook
The Naval Smart Weapons market is poised for continued strong growth, driven by ongoing technological innovation, increasing defense spending, and the growing demand for precision-guided munitions. The market offers significant strategic opportunities for companies to develop and deploy cutting-edge technologies, forge strategic alliances, and expand their global reach. The future is bright for the naval smart weapons industry, with opportunities for advancements in areas such as AI, hypersonics, and directed energy weapons that promise to revolutionize naval warfare.
Naval Smart Weapons Market Segmentation
- 1. Production Analysis
- 2. Consumption Analysis
- 3. Import Market Analysis (Value & Volume)
- 4. Export Market Analysis (Value & Volume)
- 5. Price Trend Analysis
Naval Smart Weapons Market Segmentation By Geography
-
1. North America
- 1.1. United States
- 1.2. Canada
- 1.3. Mexico
-
2. South America
- 2.1. Brazil
- 2.2. Argentina
- 2.3. Rest of South America
-
3. Europe
- 3.1. United Kingdom
- 3.2. Germany
- 3.3. France
- 3.4. Italy
- 3.5. Spain
- 3.6. Russia
- 3.7. Benelux
- 3.8. Nordics
- 3.9. Rest of Europe
-
4. Middle East & Africa
- 4.1. Turkey
- 4.2. Israel
- 4.3. GCC
- 4.4. North Africa
- 4.5. South Africa
- 4.6. Rest of Middle East & Africa
-
5. Asia Pacific
- 5.1. China
- 5.2. India
- 5.3. Japan
- 5.4. South Korea
- 5.5. ASEAN
- 5.6. Oceania
- 5.7. Rest of Asia Pacific
Naval Smart Weapons Market REPORT HIGHLIGHTS
| Aspects | Details |
|---|---|
| Study Period | 2019-2033 |
| Base Year | 2024 |
| Estimated Year | 2025 |
| Forecast Period | 2025-2033 |
| Historical Period | 2019-2024 |
| Growth Rate | CAGR of > 5.00% from 2019-2033 |
| Segmentation |
|
Table of Contents
- 1. Introduction
- 1.1. Research Scope
- 1.2. Market Segmentation
- 1.3. Research Methodology
- 1.4. Definitions and Assumptions
- 2. Executive Summary
- 2.1. Introduction
- 3. Market Dynamics
- 3.1. Introduction
- 3.2. Market Drivers
- 3.2.1. Increase in Internet of Things (IoT) and Autonomous Systems; Rise in Demand for Military and Defense Satellite Communication Solutions
- 3.3. Market Restrains
- 3.3.1. Cybersecurity Threats to Satellite Communication; Interference in Transmission of Data
- 3.4. Market Trends
- 3.4.1. Laser Guidance Segment Holds the Highest Share in the Market
- 4. Market Factor Analysis
- 4.1. Porters Five Forces
- 4.2. Supply/Value Chain
- 4.3. PESTEL analysis
- 4.4. Market Entropy
- 4.5. Patent/Trademark Analysis
- 5. Global Naval Smart Weapons Market Analysis, Insights and Forecast, 2019-2031
- 5.1. Market Analysis, Insights and Forecast - by Production Analysis
- 5.2. Market Analysis, Insights and Forecast - by Consumption Analysis
- 5.3. Market Analysis, Insights and Forecast - by Import Market Analysis (Value & Volume)
- 5.4. Market Analysis, Insights and Forecast - by Export Market Analysis (Value & Volume)
- 5.5. Market Analysis, Insights and Forecast - by Price Trend Analysis
- 5.6. Market Analysis, Insights and Forecast - by Region
- 5.6.1. North America
- 5.6.2. South America
- 5.6.3. Europe
- 5.6.4. Middle East & Africa
- 5.6.5. Asia Pacific
- 5.1. Market Analysis, Insights and Forecast - by Production Analysis
- 6. North America Naval Smart Weapons Market Analysis, Insights and Forecast, 2019-2031
- 6.1. Market Analysis, Insights and Forecast - by Production Analysis
- 6.2. Market Analysis, Insights and Forecast - by Consumption Analysis
- 6.3. Market Analysis, Insights and Forecast - by Import Market Analysis (Value & Volume)
- 6.4. Market Analysis, Insights and Forecast - by Export Market Analysis (Value & Volume)
- 6.5. Market Analysis, Insights and Forecast - by Price Trend Analysis
- 6.1. Market Analysis, Insights and Forecast - by Production Analysis
- 7. South America Naval Smart Weapons Market Analysis, Insights and Forecast, 2019-2031
- 7.1. Market Analysis, Insights and Forecast - by Production Analysis
- 7.2. Market Analysis, Insights and Forecast - by Consumption Analysis
- 7.3. Market Analysis, Insights and Forecast - by Import Market Analysis (Value & Volume)
- 7.4. Market Analysis, Insights and Forecast - by Export Market Analysis (Value & Volume)
- 7.5. Market Analysis, Insights and Forecast - by Price Trend Analysis
- 7.1. Market Analysis, Insights and Forecast - by Production Analysis
- 8. Europe Naval Smart Weapons Market Analysis, Insights and Forecast, 2019-2031
- 8.1. Market Analysis, Insights and Forecast - by Production Analysis
- 8.2. Market Analysis, Insights and Forecast - by Consumption Analysis
- 8.3. Market Analysis, Insights and Forecast - by Import Market Analysis (Value & Volume)
- 8.4. Market Analysis, Insights and Forecast - by Export Market Analysis (Value & Volume)
- 8.5. Market Analysis, Insights and Forecast - by Price Trend Analysis
- 8.1. Market Analysis, Insights and Forecast - by Production Analysis
- 9. Middle East & Africa Naval Smart Weapons Market Analysis, Insights and Forecast, 2019-2031
- 9.1. Market Analysis, Insights and Forecast - by Production Analysis
- 9.2. Market Analysis, Insights and Forecast - by Consumption Analysis
- 9.3. Market Analysis, Insights and Forecast - by Import Market Analysis (Value & Volume)
- 9.4. Market Analysis, Insights and Forecast - by Export Market Analysis (Value & Volume)
- 9.5. Market Analysis, Insights and Forecast - by Price Trend Analysis
- 9.1. Market Analysis, Insights and Forecast - by Production Analysis
- 10. Asia Pacific Naval Smart Weapons Market Analysis, Insights and Forecast, 2019-2031
- 10.1. Market Analysis, Insights and Forecast - by Production Analysis
- 10.2. Market Analysis, Insights and Forecast - by Consumption Analysis
- 10.3. Market Analysis, Insights and Forecast - by Import Market Analysis (Value & Volume)
- 10.4. Market Analysis, Insights and Forecast - by Export Market Analysis (Value & Volume)
- 10.5. Market Analysis, Insights and Forecast - by Price Trend Analysis
- 10.1. Market Analysis, Insights and Forecast - by Production Analysis
- 11. North America Naval Smart Weapons Market Analysis, Insights and Forecast, 2019-2031
- 11.1. Market Analysis, Insights and Forecast - By Country/Sub-region
- 11.1.1 United States
- 11.1.2 Canada
- 12. Europe Naval Smart Weapons Market Analysis, Insights and Forecast, 2019-2031
- 12.1. Market Analysis, Insights and Forecast - By Country/Sub-region
- 12.1.1 United Kingdom
- 12.1.2 France
- 12.1.3 Germany
- 12.1.4 Rest of Europe
- 13. Asia Pacific Naval Smart Weapons Market Analysis, Insights and Forecast, 2019-2031
- 13.1. Market Analysis, Insights and Forecast - By Country/Sub-region
- 13.1.1 India
- 13.1.2 China
- 13.1.3 Japan
- 13.1.4 South Korea
- 13.1.5 Rest of Asia Pacific
- 14. Rest of the World Naval Smart Weapons Market Analysis, Insights and Forecast, 2019-2031
- 14.1. Market Analysis, Insights and Forecast - By Country/Sub-region
- 14.1.1.
- 15. Competitive Analysis
- 15.1. Global Market Share Analysis 2024
- 15.2. Company Profiles
- 15.2.1 Textron Inc
- 15.2.1.1. Overview
- 15.2.1.2. Products
- 15.2.1.3. SWOT Analysis
- 15.2.1.4. Recent Developments
- 15.2.1.5. Financials (Based on Availability)
- 15.2.2 L3Harris Technologies Inc
- 15.2.2.1. Overview
- 15.2.2.2. Products
- 15.2.2.3. SWOT Analysis
- 15.2.2.4. Recent Developments
- 15.2.2.5. Financials (Based on Availability)
- 15.2.3 Raytheon Technologies Corporation
- 15.2.3.1. Overview
- 15.2.3.2. Products
- 15.2.3.3. SWOT Analysis
- 15.2.3.4. Recent Developments
- 15.2.3.5. Financials (Based on Availability)
- 15.2.4 THALES
- 15.2.4.1. Overview
- 15.2.4.2. Products
- 15.2.4.3. SWOT Analysis
- 15.2.4.4. Recent Developments
- 15.2.4.5. Financials (Based on Availability)
- 15.2.5 General Dynamics Corporation
- 15.2.5.1. Overview
- 15.2.5.2. Products
- 15.2.5.3. SWOT Analysis
- 15.2.5.4. Recent Developments
- 15.2.5.5. Financials (Based on Availability)
- 15.2.6 Rheinmetall AG
- 15.2.6.1. Overview
- 15.2.6.2. Products
- 15.2.6.3. SWOT Analysis
- 15.2.6.4. Recent Developments
- 15.2.6.5. Financials (Based on Availability)
- 15.2.7 Lockheed Martin Corporation
- 15.2.7.1. Overview
- 15.2.7.2. Products
- 15.2.7.3. SWOT Analysis
- 15.2.7.4. Recent Developments
- 15.2.7.5. Financials (Based on Availability)
- 15.2.8 MBDA
- 15.2.8.1. Overview
- 15.2.8.2. Products
- 15.2.8.3. SWOT Analysis
- 15.2.8.4. Recent Developments
- 15.2.8.5. Financials (Based on Availability)
- 15.2.9 Leonardo S p A
- 15.2.9.1. Overview
- 15.2.9.2. Products
- 15.2.9.3. SWOT Analysis
- 15.2.9.4. Recent Developments
- 15.2.9.5. Financials (Based on Availability)
- 15.2.10 BAE Systems plc
- 15.2.10.1. Overview
- 15.2.10.2. Products
- 15.2.10.3. SWOT Analysis
- 15.2.10.4. Recent Developments
- 15.2.10.5. Financials (Based on Availability)
- 15.2.11 Northrop Grumman Corporation
- 15.2.11.1. Overview
- 15.2.11.2. Products
- 15.2.11.3. SWOT Analysis
- 15.2.11.4. Recent Developments
- 15.2.11.5. Financials (Based on Availability)
- 15.2.12 The Boeing Company
- 15.2.12.1. Overview
- 15.2.12.2. Products
- 15.2.12.3. SWOT Analysis
- 15.2.12.4. Recent Developments
- 15.2.12.5. Financials (Based on Availability)
- 15.2.1 Textron Inc
List of Figures
- Figure 1: Global Naval Smart Weapons Market Revenue Breakdown (Million, %) by Region 2024 & 2032
- Figure 2: North America Naval Smart Weapons Market Revenue (Million), by Country 2024 & 2032
- Figure 3: North America Naval Smart Weapons Market Revenue Share (%), by Country 2024 & 2032
- Figure 4: Europe Naval Smart Weapons Market Revenue (Million), by Country 2024 & 2032
- Figure 5: Europe Naval Smart Weapons Market Revenue Share (%), by Country 2024 & 2032
- Figure 6: Asia Pacific Naval Smart Weapons Market Revenue (Million), by Country 2024 & 2032
- Figure 7: Asia Pacific Naval Smart Weapons Market Revenue Share (%), by Country 2024 & 2032
- Figure 8: Rest of the World Naval Smart Weapons Market Revenue (Million), by Country 2024 & 2032
- Figure 9: Rest of the World Naval Smart Weapons Market Revenue Share (%), by Country 2024 & 2032
- Figure 10: North America Naval Smart Weapons Market Revenue (Million), by Production Analysis 2024 & 2032
- Figure 11: North America Naval Smart Weapons Market Revenue Share (%), by Production Analysis 2024 & 2032
- Figure 12: North America Naval Smart Weapons Market Revenue (Million), by Consumption Analysis 2024 & 2032
- Figure 13: North America Naval Smart Weapons Market Revenue Share (%), by Consumption Analysis 2024 & 2032
- Figure 14: North America Naval Smart Weapons Market Revenue (Million), by Import Market Analysis (Value & Volume) 2024 & 2032
- Figure 15: North America Naval Smart Weapons Market Revenue Share (%), by Import Market Analysis (Value & Volume) 2024 & 2032
- Figure 16: North America Naval Smart Weapons Market Revenue (Million), by Export Market Analysis (Value & Volume) 2024 & 2032
- Figure 17: North America Naval Smart Weapons Market Revenue Share (%), by Export Market Analysis (Value & Volume) 2024 & 2032
- Figure 18: North America Naval Smart Weapons Market Revenue (Million), by Price Trend Analysis 2024 & 2032
- Figure 19: North America Naval Smart Weapons Market Revenue Share (%), by Price Trend Analysis 2024 & 2032
- Figure 20: North America Naval Smart Weapons Market Revenue (Million), by Country 2024 & 2032
- Figure 21: North America Naval Smart Weapons Market Revenue Share (%), by Country 2024 & 2032
- Figure 22: South America Naval Smart Weapons Market Revenue (Million), by Production Analysis 2024 & 2032
- Figure 23: South America Naval Smart Weapons Market Revenue Share (%), by Production Analysis 2024 & 2032
- Figure 24: South America Naval Smart Weapons Market Revenue (Million), by Consumption Analysis 2024 & 2032
- Figure 25: South America Naval Smart Weapons Market Revenue Share (%), by Consumption Analysis 2024 & 2032
- Figure 26: South America Naval Smart Weapons Market Revenue (Million), by Import Market Analysis (Value & Volume) 2024 & 2032
- Figure 27: South America Naval Smart Weapons Market Revenue Share (%), by Import Market Analysis (Value & Volume) 2024 & 2032
- Figure 28: South America Naval Smart Weapons Market Revenue (Million), by Export Market Analysis (Value & Volume) 2024 & 2032
- Figure 29: South America Naval Smart Weapons Market Revenue Share (%), by Export Market Analysis (Value & Volume) 2024 & 2032
- Figure 30: South America Naval Smart Weapons Market Revenue (Million), by Price Trend Analysis 2024 & 2032
- Figure 31: South America Naval Smart Weapons Market Revenue Share (%), by Price Trend Analysis 2024 & 2032
- Figure 32: South America Naval Smart Weapons Market Revenue (Million), by Country 2024 & 2032
- Figure 33: South America Naval Smart Weapons Market Revenue Share (%), by Country 2024 & 2032
- Figure 34: Europe Naval Smart Weapons Market Revenue (Million), by Production Analysis 2024 & 2032
- Figure 35: Europe Naval Smart Weapons Market Revenue Share (%), by Production Analysis 2024 & 2032
- Figure 36: Europe Naval Smart Weapons Market Revenue (Million), by Consumption Analysis 2024 & 2032
- Figure 37: Europe Naval Smart Weapons Market Revenue Share (%), by Consumption Analysis 2024 & 2032
- Figure 38: Europe Naval Smart Weapons Market Revenue (Million), by Import Market Analysis (Value & Volume) 2024 & 2032
- Figure 39: Europe Naval Smart Weapons Market Revenue Share (%), by Import Market Analysis (Value & Volume) 2024 & 2032
- Figure 40: Europe Naval Smart Weapons Market Revenue (Million), by Export Market Analysis (Value & Volume) 2024 & 2032
- Figure 41: Europe Naval Smart Weapons Market Revenue Share (%), by Export Market Analysis (Value & Volume) 2024 & 2032
- Figure 42: Europe Naval Smart Weapons Market Revenue (Million), by Price Trend Analysis 2024 & 2032
- Figure 43: Europe Naval Smart Weapons Market Revenue Share (%), by Price Trend Analysis 2024 & 2032
- Figure 44: Europe Naval Smart Weapons Market Revenue (Million), by Country 2024 & 2032
- Figure 45: Europe Naval Smart Weapons Market Revenue Share (%), by Country 2024 & 2032
- Figure 46: Middle East & Africa Naval Smart Weapons Market Revenue (Million), by Production Analysis 2024 & 2032
- Figure 47: Middle East & Africa Naval Smart Weapons Market Revenue Share (%), by Production Analysis 2024 & 2032
- Figure 48: Middle East & Africa Naval Smart Weapons Market Revenue (Million), by Consumption Analysis 2024 & 2032
- Figure 49: Middle East & Africa Naval Smart Weapons Market Revenue Share (%), by Consumption Analysis 2024 & 2032
- Figure 50: Middle East & Africa Naval Smart Weapons Market Revenue (Million), by Import Market Analysis (Value & Volume) 2024 & 2032
- Figure 51: Middle East & Africa Naval Smart Weapons Market Revenue Share (%), by Import Market Analysis (Value & Volume) 2024 & 2032
- Figure 52: Middle East & Africa Naval Smart Weapons Market Revenue (Million), by Export Market Analysis (Value & Volume) 2024 & 2032
- Figure 53: Middle East & Africa Naval Smart Weapons Market Revenue Share (%), by Export Market Analysis (Value & Volume) 2024 & 2032
- Figure 54: Middle East & Africa Naval Smart Weapons Market Revenue (Million), by Price Trend Analysis 2024 & 2032
- Figure 55: Middle East & Africa Naval Smart Weapons Market Revenue Share (%), by Price Trend Analysis 2024 & 2032
- Figure 56: Middle East & Africa Naval Smart Weapons Market Revenue (Million), by Country 2024 & 2032
- Figure 57: Middle East & Africa Naval Smart Weapons Market Revenue Share (%), by Country 2024 & 2032
- Figure 58: Asia Pacific Naval Smart Weapons Market Revenue (Million), by Production Analysis 2024 & 2032
- Figure 59: Asia Pacific Naval Smart Weapons Market Revenue Share (%), by Production Analysis 2024 & 2032
- Figure 60: Asia Pacific Naval Smart Weapons Market Revenue (Million), by Consumption Analysis 2024 & 2032
- Figure 61: Asia Pacific Naval Smart Weapons Market Revenue Share (%), by Consumption Analysis 2024 & 2032
- Figure 62: Asia Pacific Naval Smart Weapons Market Revenue (Million), by Import Market Analysis (Value & Volume) 2024 & 2032
- Figure 63: Asia Pacific Naval Smart Weapons Market Revenue Share (%), by Import Market Analysis (Value & Volume) 2024 & 2032
- Figure 64: Asia Pacific Naval Smart Weapons Market Revenue (Million), by Export Market Analysis (Value & Volume) 2024 & 2032
- Figure 65: Asia Pacific Naval Smart Weapons Market Revenue Share (%), by Export Market Analysis (Value & Volume) 2024 & 2032
- Figure 66: Asia Pacific Naval Smart Weapons Market Revenue (Million), by Price Trend Analysis 2024 & 2032
- Figure 67: Asia Pacific Naval Smart Weapons Market Revenue Share (%), by Price Trend Analysis 2024 & 2032
- Figure 68: Asia Pacific Naval Smart Weapons Market Revenue (Million), by Country 2024 & 2032
- Figure 69: Asia Pacific Naval Smart Weapons Market Revenue Share (%), by Country 2024 & 2032
List of Tables
- Table 1: Global Naval Smart Weapons Market Revenue Million Forecast, by Region 2019 & 2032
- Table 2: Global Naval Smart Weapons Market Revenue Million Forecast, by Production Analysis 2019 & 2032
- Table 3: Global Naval Smart Weapons Market Revenue Million Forecast, by Consumption Analysis 2019 & 2032
- Table 4: Global Naval Smart Weapons Market Revenue Million Forecast, by Import Market Analysis (Value & Volume) 2019 & 2032
- Table 5: Global Naval Smart Weapons Market Revenue Million Forecast, by Export Market Analysis (Value & Volume) 2019 & 2032
- Table 6: Global Naval Smart Weapons Market Revenue Million Forecast, by Price Trend Analysis 2019 & 2032
- Table 7: Global Naval Smart Weapons Market Revenue Million Forecast, by Region 2019 & 2032
- Table 8: Global Naval Smart Weapons Market Revenue Million Forecast, by Country 2019 & 2032
- Table 9: United States Naval Smart Weapons Market Revenue (Million) Forecast, by Application 2019 & 2032
- Table 10: Canada Naval Smart Weapons Market Revenue (Million) Forecast, by Application 2019 & 2032
- Table 11: Global Naval Smart Weapons Market Revenue Million Forecast, by Country 2019 & 2032
- Table 12: United Kingdom Naval Smart Weapons Market Revenue (Million) Forecast, by Application 2019 & 2032
- Table 13: France Naval Smart Weapons Market Revenue (Million) Forecast, by Application 2019 & 2032
- Table 14: Germany Naval Smart Weapons Market Revenue (Million) Forecast, by Application 2019 & 2032
- Table 15: Rest of Europe Naval Smart Weapons Market Revenue (Million) Forecast, by Application 2019 & 2032
- Table 16: Global Naval Smart Weapons Market Revenue Million Forecast, by Country 2019 & 2032
- Table 17: India Naval Smart Weapons Market Revenue (Million) Forecast, by Application 2019 & 2032
- Table 18: China Naval Smart Weapons Market Revenue (Million) Forecast, by Application 2019 & 2032
- Table 19: Japan Naval Smart Weapons Market Revenue (Million) Forecast, by Application 2019 & 2032
- Table 20: South Korea Naval Smart Weapons Market Revenue (Million) Forecast, by Application 2019 & 2032
- Table 21: Rest of Asia Pacific Naval Smart Weapons Market Revenue (Million) Forecast, by Application 2019 & 2032
- Table 22: Global Naval Smart Weapons Market Revenue Million Forecast, by Country 2019 & 2032
- Table 23: Naval Smart Weapons Market Revenue (Million) Forecast, by Application 2019 & 2032
- Table 24: Global Naval Smart Weapons Market Revenue Million Forecast, by Production Analysis 2019 & 2032
- Table 25: Global Naval Smart Weapons Market Revenue Million Forecast, by Consumption Analysis 2019 & 2032
- Table 26: Global Naval Smart Weapons Market Revenue Million Forecast, by Import Market Analysis (Value & Volume) 2019 & 2032
- Table 27: Global Naval Smart Weapons Market Revenue Million Forecast, by Export Market Analysis (Value & Volume) 2019 & 2032
- Table 28: Global Naval Smart Weapons Market Revenue Million Forecast, by Price Trend Analysis 2019 & 2032
- Table 29: Global Naval Smart Weapons Market Revenue Million Forecast, by Country 2019 & 2032
- Table 30: United States Naval Smart Weapons Market Revenue (Million) Forecast, by Application 2019 & 2032
- Table 31: Canada Naval Smart Weapons Market Revenue (Million) Forecast, by Application 2019 & 2032
- Table 32: Mexico Naval Smart Weapons Market Revenue (Million) Forecast, by Application 2019 & 2032
- Table 33: Global Naval Smart Weapons Market Revenue Million Forecast, by Production Analysis 2019 & 2032
- Table 34: Global Naval Smart Weapons Market Revenue Million Forecast, by Consumption Analysis 2019 & 2032
- Table 35: Global Naval Smart Weapons Market Revenue Million Forecast, by Import Market Analysis (Value & Volume) 2019 & 2032
- Table 36: Global Naval Smart Weapons Market Revenue Million Forecast, by Export Market Analysis (Value & Volume) 2019 & 2032
- Table 37: Global Naval Smart Weapons Market Revenue Million Forecast, by Price Trend Analysis 2019 & 2032
- Table 38: Global Naval Smart Weapons Market Revenue Million Forecast, by Country 2019 & 2032
- Table 39: Brazil Naval Smart Weapons Market Revenue (Million) Forecast, by Application 2019 & 2032
- Table 40: Argentina Naval Smart Weapons Market Revenue (Million) Forecast, by Application 2019 & 2032
- Table 41: Rest of South America Naval Smart Weapons Market Revenue (Million) Forecast, by Application 2019 & 2032
- Table 42: Global Naval Smart Weapons Market Revenue Million Forecast, by Production Analysis 2019 & 2032
- Table 43: Global Naval Smart Weapons Market Revenue Million Forecast, by Consumption Analysis 2019 & 2032
- Table 44: Global Naval Smart Weapons Market Revenue Million Forecast, by Import Market Analysis (Value & Volume) 2019 & 2032
- Table 45: Global Naval Smart Weapons Market Revenue Million Forecast, by Export Market Analysis (Value & Volume) 2019 & 2032
- Table 46: Global Naval Smart Weapons Market Revenue Million Forecast, by Price Trend Analysis 2019 & 2032
- Table 47: Global Naval Smart Weapons Market Revenue Million Forecast, by Country 2019 & 2032
- Table 48: United Kingdom Naval Smart Weapons Market Revenue (Million) Forecast, by Application 2019 & 2032
- Table 49: Germany Naval Smart Weapons Market Revenue (Million) Forecast, by Application 2019 & 2032
- Table 50: France Naval Smart Weapons Market Revenue (Million) Forecast, by Application 2019 & 2032
- Table 51: Italy Naval Smart Weapons Market Revenue (Million) Forecast, by Application 2019 & 2032
- Table 52: Spain Naval Smart Weapons Market Revenue (Million) Forecast, by Application 2019 & 2032
- Table 53: Russia Naval Smart Weapons Market Revenue (Million) Forecast, by Application 2019 & 2032
- Table 54: Benelux Naval Smart Weapons Market Revenue (Million) Forecast, by Application 2019 & 2032
- Table 55: Nordics Naval Smart Weapons Market Revenue (Million) Forecast, by Application 2019 & 2032
- Table 56: Rest of Europe Naval Smart Weapons Market Revenue (Million) Forecast, by Application 2019 & 2032
- Table 57: Global Naval Smart Weapons Market Revenue Million Forecast, by Production Analysis 2019 & 2032
- Table 58: Global Naval Smart Weapons Market Revenue Million Forecast, by Consumption Analysis 2019 & 2032
- Table 59: Global Naval Smart Weapons Market Revenue Million Forecast, by Import Market Analysis (Value & Volume) 2019 & 2032
- Table 60: Global Naval Smart Weapons Market Revenue Million Forecast, by Export Market Analysis (Value & Volume) 2019 & 2032
- Table 61: Global Naval Smart Weapons Market Revenue Million Forecast, by Price Trend Analysis 2019 & 2032
- Table 62: Global Naval Smart Weapons Market Revenue Million Forecast, by Country 2019 & 2032
- Table 63: Turkey Naval Smart Weapons Market Revenue (Million) Forecast, by Application 2019 & 2032
- Table 64: Israel Naval Smart Weapons Market Revenue (Million) Forecast, by Application 2019 & 2032
- Table 65: GCC Naval Smart Weapons Market Revenue (Million) Forecast, by Application 2019 & 2032
- Table 66: North Africa Naval Smart Weapons Market Revenue (Million) Forecast, by Application 2019 & 2032
- Table 67: South Africa Naval Smart Weapons Market Revenue (Million) Forecast, by Application 2019 & 2032
- Table 68: Rest of Middle East & Africa Naval Smart Weapons Market Revenue (Million) Forecast, by Application 2019 & 2032
- Table 69: Global Naval Smart Weapons Market Revenue Million Forecast, by Production Analysis 2019 & 2032
- Table 70: Global Naval Smart Weapons Market Revenue Million Forecast, by Consumption Analysis 2019 & 2032
- Table 71: Global Naval Smart Weapons Market Revenue Million Forecast, by Import Market Analysis (Value & Volume) 2019 & 2032
- Table 72: Global Naval Smart Weapons Market Revenue Million Forecast, by Export Market Analysis (Value & Volume) 2019 & 2032
- Table 73: Global Naval Smart Weapons Market Revenue Million Forecast, by Price Trend Analysis 2019 & 2032
- Table 74: Global Naval Smart Weapons Market Revenue Million Forecast, by Country 2019 & 2032
- Table 75: China Naval Smart Weapons Market Revenue (Million) Forecast, by Application 2019 & 2032
- Table 76: India Naval Smart Weapons Market Revenue (Million) Forecast, by Application 2019 & 2032
- Table 77: Japan Naval Smart Weapons Market Revenue (Million) Forecast, by Application 2019 & 2032
- Table 78: South Korea Naval Smart Weapons Market Revenue (Million) Forecast, by Application 2019 & 2032
- Table 79: ASEAN Naval Smart Weapons Market Revenue (Million) Forecast, by Application 2019 & 2032
- Table 80: Oceania Naval Smart Weapons Market Revenue (Million) Forecast, by Application 2019 & 2032
- Table 81: Rest of Asia Pacific Naval Smart Weapons Market Revenue (Million) Forecast, by Application 2019 & 2032
Frequently Asked Questions
1. What is the projected Compound Annual Growth Rate (CAGR) of the Naval Smart Weapons Market?
The projected CAGR is approximately > 5.00%.
2. Which companies are prominent players in the Naval Smart Weapons Market?
Key companies in the market include Textron Inc, L3Harris Technologies Inc, Raytheon Technologies Corporation, THALES, General Dynamics Corporation, Rheinmetall AG, Lockheed Martin Corporation, MBDA, Leonardo S p A, BAE Systems plc, Northrop Grumman Corporation, The Boeing Company.
3. What are the main segments of the Naval Smart Weapons Market?
The market segments include Production Analysis, Consumption Analysis, Import Market Analysis (Value & Volume), Export Market Analysis (Value & Volume), Price Trend Analysis.
4. Can you provide details about the market size?
The market size is estimated to be USD XX Million as of 2022.
5. What are some drivers contributing to market growth?
Increase in Internet of Things (IoT) and Autonomous Systems; Rise in Demand for Military and Defense Satellite Communication Solutions.
6. What are the notable trends driving market growth?
Laser Guidance Segment Holds the Highest Share in the Market.
7. Are there any restraints impacting market growth?
Cybersecurity Threats to Satellite Communication; Interference in Transmission of Data.
8. Can you provide examples of recent developments in the market?
In February 2023, the US Navy placed an order worth USD 92 million for weapon assemblies for LAIRCM missile-defense systems with Northrop Grumman Corporation.
9. What pricing options are available for accessing the report?
Pricing options include single-user, multi-user, and enterprise licenses priced at USD 4750, USD 5250, and USD 8750 respectively.
10. Is the market size provided in terms of value or volume?
The market size is provided in terms of value, measured in Million.
11. Are there any specific market keywords associated with the report?
Yes, the market keyword associated with the report is "Naval Smart Weapons Market," which aids in identifying and referencing the specific market segment covered.
12. How do I determine which pricing option suits my needs best?
The pricing options vary based on user requirements and access needs. Individual users may opt for single-user licenses, while businesses requiring broader access may choose multi-user or enterprise licenses for cost-effective access to the report.
13. Are there any additional resources or data provided in the Naval Smart Weapons Market report?
While the report offers comprehensive insights, it's advisable to review the specific contents or supplementary materials provided to ascertain if additional resources or data are available.
14. How can I stay updated on further developments or reports in the Naval Smart Weapons Market?
To stay informed about further developments, trends, and reports in the Naval Smart Weapons Market, consider subscribing to industry newsletters, following relevant companies and organizations, or regularly checking reputable industry news sources and publications.
Methodology
Step 1 - Identification of Relevant Samples Size from Population Database


Step 2 - Approaches for Defining Global Market Size (Value, Volume* & Price*)

Note*: In applicable scenarios
Step 3 - Data Sources
Primary Research
- Web Analytics
- Survey Reports
- Research Institute
- Latest Research Reports
- Opinion Leaders
Secondary Research
- Annual Reports
- White Paper
- Latest Press Release
- Industry Association
- Paid Database
- Investor Presentations

Step 4 - Data Triangulation
Involves using different sources of information in order to increase the validity of a study
These sources are likely to be stakeholders in a program - participants, other researchers, program staff, other community members, and so on.
Then we put all data in single framework & apply various statistical tools to find out the dynamic on the market.
During the analysis stage, feedback from the stakeholder groups would be compared to determine areas of agreement as well as areas of divergence
