

Key Insights
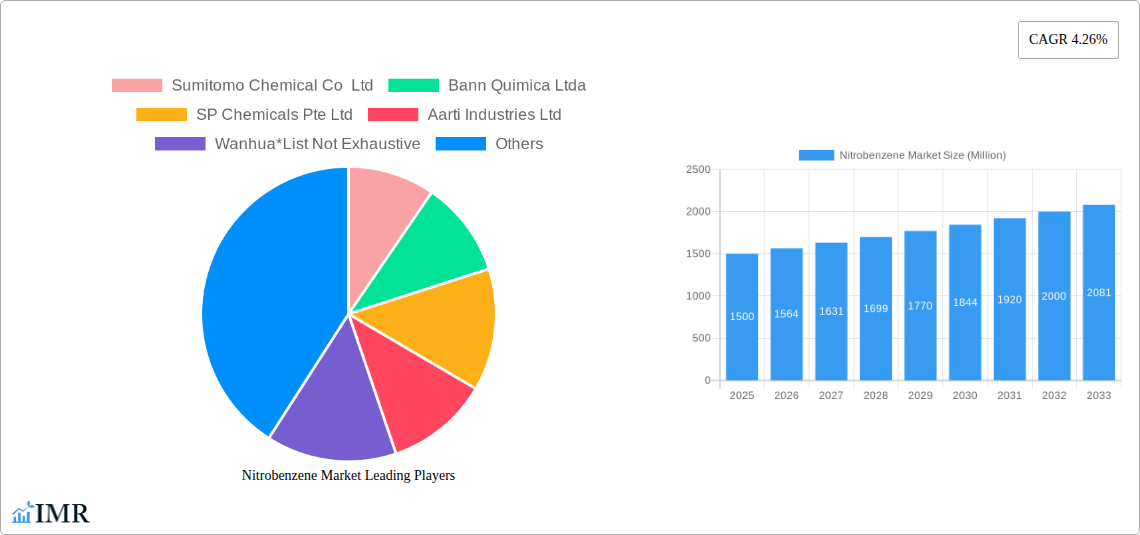
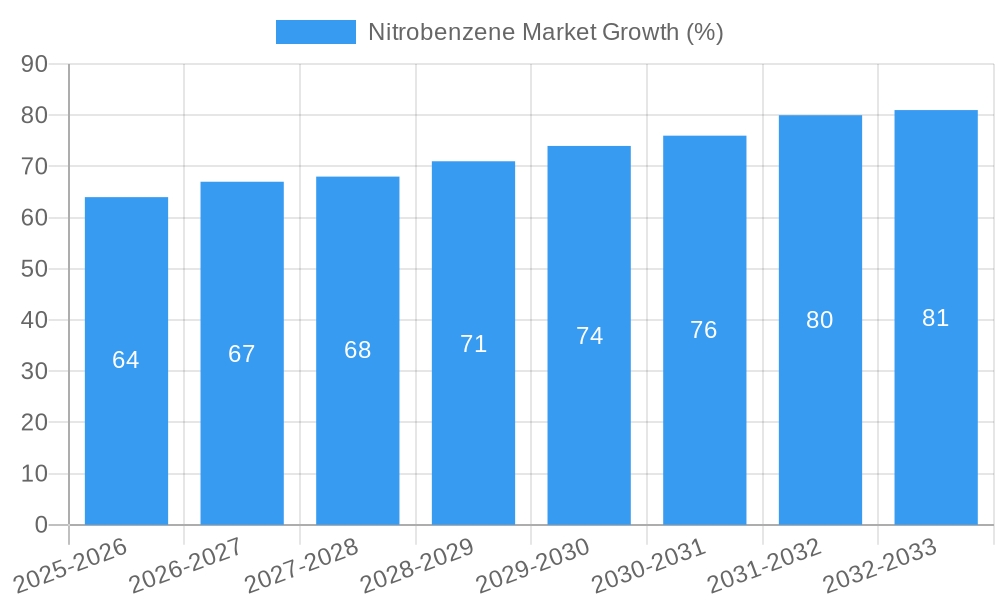
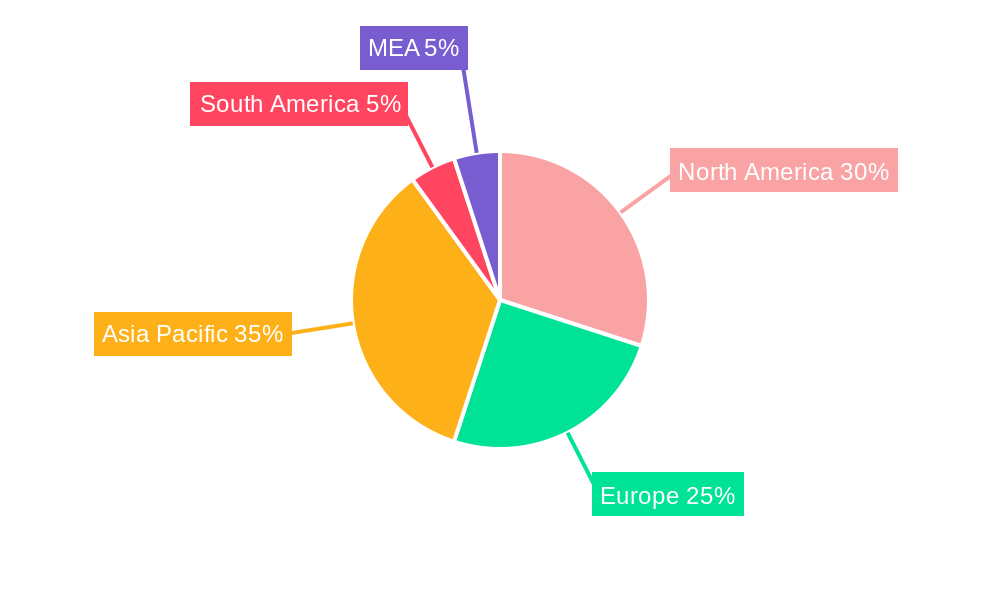
The global nitrobenzene market, valued at approximately $XX million in 2025, is projected to experience steady growth, driven by a robust Compound Annual Growth Rate (CAGR) of 4.26% from 2025 to 2033. This expansion is fueled primarily by the increasing demand for aniline, a key derivative used extensively in the production of dyes and pigments for the textile and automotive industries. The burgeoning pharmaceutical sector, requiring nitrobenzene as an intermediate in the synthesis of various drugs, also contributes significantly to market growth. Furthermore, the expanding applications in pesticides and other specialized areas, including solvents and explosives (though with stricter regulations impacting growth in the latter), sustain market demand. Regional analysis reveals a diversified market landscape, with North America and Asia-Pacific expected to dominate due to established manufacturing bases and substantial consumption across various downstream applications. However, stringent environmental regulations surrounding nitrobenzene production and handling pose a significant challenge, potentially slowing down the market's growth trajectory in certain regions. Competition among established players like Sumitomo Chemical, Huntsman International, and Aarti Industries, along with emerging regional producers, intensifies the market dynamics.
The forecast period (2025-2033) anticipates a continued rise in nitrobenzene consumption, particularly in developing economies experiencing rapid industrialization. This growth will be further influenced by technological advancements aimed at improving the efficiency and sustainability of nitrobenzene production processes. However, factors such as fluctuating raw material prices and potential shifts in consumer preferences towards eco-friendly alternatives might influence the market's overall growth rate. Strategic partnerships and mergers & acquisitions among key players will likely shape the competitive landscape in the coming years, creating opportunities for both established companies and new entrants to carve out market share. The diverse applications and robust growth prospects, while tempered by regulatory constraints, position the nitrobenzene market for a positive outlook throughout the forecast period.
Nitrobenzene Market: A Comprehensive Report (2019-2033)
This comprehensive report provides a detailed analysis of the global Nitrobenzene market, encompassing market dynamics, growth trends, regional segmentation, product landscape, key players, and future outlook. The study period covers 2019-2033, with 2025 as the base year and a forecast period of 2025-2033. The report is crucial for industry professionals, investors, and strategic decision-makers seeking to understand the current market landscape and navigate future opportunities within the Nitrobenzene and its parent market, the chemical intermediates market, and child market, Aniline production. The market size is projected to reach XX Million by 2033.
Nitrobenzene Market Dynamics & Structure
The Nitrobenzene market is characterized by moderate concentration, with several key players holding significant market share. The market is driven by technological innovations in production processes, particularly those focused on enhancing efficiency and reducing environmental impact. Stringent regulatory frameworks governing chemical production and safety also shape market dynamics. Competitive pressure from substitute products and the evolving end-user demographics further influence market trends. The report analyzes M&A activities in the sector, with xx number of deals recorded during the historical period (2019-2024), revealing a xx% average annual growth rate in deal volume.
- Market Concentration: Moderately concentrated, with top 5 players holding approximately xx% market share in 2024.
- Technological Innovation: Focus on improving production efficiency, reducing waste, and enhancing safety protocols.
- Regulatory Landscape: Stringent environmental regulations and safety standards influence production practices and costs.
- Substitute Products: Competition from alternative chemicals for specific applications (e.g., in dyes and pigments).
- End-User Demographics: Growing demand from key sectors such as pharmaceuticals and agriculture drive market expansion.
- M&A Activity: Consolidation through mergers and acquisitions contributes to market restructuring and increased competitiveness. Innovation barriers include high R&D investment and stringent regulatory approvals.
Nitrobenzene Market Growth Trends & Insights
The Nitrobenzene market experienced a CAGR of xx% during the historical period (2019-2024), reaching a market size of xx Million in 2024. This growth is primarily attributed to increasing demand from the Aniline production segment, driven by expansion in the textile and rubber industries. Technological advancements, such as the novel room-temperature aniline production method announced in July 2022, are expected to further enhance market growth by improving efficiency and reducing costs. Consumer behavior shifts towards sustainable and environmentally friendly products are also impacting market dynamics, pushing manufacturers to adopt cleaner production processes. The market is expected to maintain a steady growth trajectory during the forecast period (2025-2033), with a projected CAGR of xx%, driven by factors such as increasing urbanization, industrialization, and rising demand for consumer goods. Market penetration in emerging economies is also expected to contribute significantly to market expansion.
Dominant Regions, Countries, or Segments in Nitrobenzene Market
Asia Pacific is currently the leading region in the Nitrobenzene market, driven primarily by strong demand from China and India. This dominance is attributed to the presence of large manufacturing bases, relatively lower production costs, and rapid industrialization. The Aniline Production segment is the largest application segment, accounting for approximately xx% of total market share in 2024, followed by Dyes and Pigments and Intermediate in Pharmaceuticals.
- Asia Pacific: Strong demand from China and India; robust industrial growth; large-scale manufacturing facilities.
- North America: Steady growth fueled by pharmaceutical and chemical industries; stringent environmental regulations.
- Europe: Moderately growing market; focus on sustainable production practices; higher labor costs.
- Aniline Production: Largest application segment due to its vital role in the manufacturing of various chemicals.
- Dyes and Pigments: Significant demand from textile, printing, and automotive industries.
- Pharmaceuticals: Growing demand as an intermediate in the production of various pharmaceutical products.
Nitrobenzene Market Product Landscape
Nitrobenzene is primarily produced through the nitration of benzene. Product innovations focus on improving purity, reducing impurities, and enhancing production efficiency. Technological advancements encompass the implementation of more efficient catalysts and optimized reactor designs to minimize waste and improve yield. These advancements contribute to the improved quality and cost-effectiveness of nitrobenzene, enhancing its competitiveness in various application sectors.
Key Drivers, Barriers & Challenges in Nitrobenzene Market
Key Drivers:
- Increasing demand from the Aniline Production sector, notably in the textile and rubber industries.
- Growing use as an intermediate in pharmaceutical manufacturing.
- Expansion of downstream industries.
Challenges & Restraints:
- Stringent environmental regulations related to handling and disposal of nitrobenzene.
- Volatility in raw material prices (e.g., benzene).
- Potential health risks associated with nitrobenzene handling. The industry faces potential supply chain disruptions due to geopolitical uncertainties, with a projected impact of xx% on market growth in a worst-case scenario.
Emerging Opportunities in Nitrobenzene Market
Emerging opportunities include exploration of novel applications in specialized chemicals, particularly in the advanced materials sector, and expansion into untapped markets in developing regions. Growing focus on sustainable and environmentally friendly production processes creates opportunities for manufacturers adopting innovative technologies and reducing environmental impact.
Growth Accelerators in the Nitrobenzene Market Industry
Technological advancements, such as improved production processes and catalytic systems, are significant growth catalysts. Strategic partnerships between manufacturers and end-users facilitate market expansion and accelerate adoption of new technologies. Expansion into new geographical markets and diversification into high-growth application areas also contribute to market growth.
Key Players Shaping the Nitrobenzene Market Market
- Sumitomo Chemical Co Ltd
- Bann Quimica Ltda
- SP Chemicals Pte Ltd
- Aarti Industries Ltd
- Wanhua*List Not Exhaustive
- Chemieorganics Chemical India Pvt Ltd
- Sadhana Nitro Chem Ltd
- Huntsman International LLC
- China Petrochemical Corporation (Sinopec)
- Aromsyn Co Ltd
- Covestro AG
Notable Milestones in Nitrobenzene Market Sector
- July 2023: Wanhua's BorsodChem inaugurated Site IV, including new nitrobenzene and aniline production facilities, significantly expanding production capacity.
- July 2022: Researchers at the University of Glasgow developed a room-temperature aniline production process from nitrobenzene, potentially revolutionizing the industry with improved efficiency and reduced environmental impact.
In-Depth Nitrobenzene Market Market Outlook
The Nitrobenzene market is poised for continued growth, driven by technological innovations, strategic partnerships, and expansion into new markets. The focus on sustainable production practices and the development of new applications will further shape market dynamics. The market presents significant opportunities for companies that can adapt to evolving regulatory landscapes and consumer preferences, driving sustainable and efficient production of nitrobenzene and its derivatives.
Nitrobenzene Market Segmentation
-
1. Application
- 1.1. Aniline Production
- 1.2. Dyes and Pigments
- 1.3. Pesticides
- 1.4. Intermediate in Pharmaceuticals
- 1.5. Other Ap
Nitrobenzene Market Segmentation By Geography
-
1. Asia Pacific
- 1.1. China
- 1.2. India
- 1.3. Japan
- 1.4. South Korea
- 1.5. Malaysia
- 1.6. Thailand
- 1.7. Indonesia
- 1.8. Vietnam
- 1.9. Rest of Asia Pacific
-
2. North America
- 2.1. United States
- 2.2. Canada
- 2.3. Mexico
-
3. Europe
- 3.1. Germany
- 3.2. United Kingdom
- 3.3. Italy
- 3.4. France
- 3.5. Spain
- 3.6. NORDIC
- 3.7. Turkey
- 3.8. Russia
- 3.9. Rest of Europe
-
4. South America
- 4.1. Brazil
- 4.2. Argentina
- 4.3. Colombia
- 4.4. Rest of South America
-
5. Middle East and Africa
- 5.1. Saudi Arabia
- 5.2. South Africa
- 5.3. Nigeria
- 5.4. Qatar
- 5.5. Egypt
- 5.6. United Arab Emirates
- 5.7. Rest of Middle East and Africa
Nitrobenzene Market REPORT HIGHLIGHTS
| Aspects | Details |
|---|---|
| Study Period | 2019-2033 |
| Base Year | 2024 |
| Estimated Year | 2025 |
| Forecast Period | 2025-2033 |
| Historical Period | 2019-2024 |
| Growth Rate | CAGR of 4.26% from 2019-2033 |
| Segmentation |
|
Table of Contents
- 1. Introduction
- 1.1. Research Scope
- 1.2. Market Segmentation
- 1.3. Research Methodology
- 1.4. Definitions and Assumptions
- 2. Executive Summary
- 2.1. Introduction
- 3. Market Dynamics
- 3.1. Introduction
- 3.2. Market Drivers
- 3.2.1. Increasing Demand for Aniline; Easy Availability of Raw Materials; Growing Construction Activities in the Asia-Pacific Region
- 3.3. Market Restrains
- 3.3.1. Growing Demand for Bio-based Chemicals; Other Restraints
- 3.4. Market Trends
- 3.4.1. Increasing Demand for Aniline Production
- 4. Market Factor Analysis
- 4.1. Porters Five Forces
- 4.2. Supply/Value Chain
- 4.3. PESTEL analysis
- 4.4. Market Entropy
- 4.5. Patent/Trademark Analysis
- 5. Global Nitrobenzene Market Analysis, Insights and Forecast, 2019-2031
- 5.1. Market Analysis, Insights and Forecast - by Application
- 5.1.1. Aniline Production
- 5.1.2. Dyes and Pigments
- 5.1.3. Pesticides
- 5.1.4. Intermediate in Pharmaceuticals
- 5.1.5. Other Ap
- 5.2. Market Analysis, Insights and Forecast - by Region
- 5.2.1. Asia Pacific
- 5.2.2. North America
- 5.2.3. Europe
- 5.2.4. South America
- 5.2.5. Middle East and Africa
- 5.1. Market Analysis, Insights and Forecast - by Application
- 6. Asia Pacific Nitrobenzene Market Analysis, Insights and Forecast, 2019-2031
- 6.1. Market Analysis, Insights and Forecast - by Application
- 6.1.1. Aniline Production
- 6.1.2. Dyes and Pigments
- 6.1.3. Pesticides
- 6.1.4. Intermediate in Pharmaceuticals
- 6.1.5. Other Ap
- 6.1. Market Analysis, Insights and Forecast - by Application
- 7. North America Nitrobenzene Market Analysis, Insights and Forecast, 2019-2031
- 7.1. Market Analysis, Insights and Forecast - by Application
- 7.1.1. Aniline Production
- 7.1.2. Dyes and Pigments
- 7.1.3. Pesticides
- 7.1.4. Intermediate in Pharmaceuticals
- 7.1.5. Other Ap
- 7.1. Market Analysis, Insights and Forecast - by Application
- 8. Europe Nitrobenzene Market Analysis, Insights and Forecast, 2019-2031
- 8.1. Market Analysis, Insights and Forecast - by Application
- 8.1.1. Aniline Production
- 8.1.2. Dyes and Pigments
- 8.1.3. Pesticides
- 8.1.4. Intermediate in Pharmaceuticals
- 8.1.5. Other Ap
- 8.1. Market Analysis, Insights and Forecast - by Application
- 9. South America Nitrobenzene Market Analysis, Insights and Forecast, 2019-2031
- 9.1. Market Analysis, Insights and Forecast - by Application
- 9.1.1. Aniline Production
- 9.1.2. Dyes and Pigments
- 9.1.3. Pesticides
- 9.1.4. Intermediate in Pharmaceuticals
- 9.1.5. Other Ap
- 9.1. Market Analysis, Insights and Forecast - by Application
- 10. Middle East and Africa Nitrobenzene Market Analysis, Insights and Forecast, 2019-2031
- 10.1. Market Analysis, Insights and Forecast - by Application
- 10.1.1. Aniline Production
- 10.1.2. Dyes and Pigments
- 10.1.3. Pesticides
- 10.1.4. Intermediate in Pharmaceuticals
- 10.1.5. Other Ap
- 10.1. Market Analysis, Insights and Forecast - by Application
- 11. North America Nitrobenzene Market Analysis, Insights and Forecast, 2019-2031
- 11.1. Market Analysis, Insights and Forecast - By Country/Sub-region
- 11.1.1 United States
- 11.1.2 Canada
- 11.1.3 Mexico
- 12. Europe Nitrobenzene Market Analysis, Insights and Forecast, 2019-2031
- 12.1. Market Analysis, Insights and Forecast - By Country/Sub-region
- 12.1.1 Germany
- 12.1.2 United Kingdom
- 12.1.3 France
- 12.1.4 Spain
- 12.1.5 Italy
- 12.1.6 Spain
- 12.1.7 Belgium
- 12.1.8 Netherland
- 12.1.9 Nordics
- 12.1.10 Rest of Europe
- 13. Asia Pacific Nitrobenzene Market Analysis, Insights and Forecast, 2019-2031
- 13.1. Market Analysis, Insights and Forecast - By Country/Sub-region
- 13.1.1 China
- 13.1.2 Japan
- 13.1.3 India
- 13.1.4 South Korea
- 13.1.5 Southeast Asia
- 13.1.6 Australia
- 13.1.7 Indonesia
- 13.1.8 Phillipes
- 13.1.9 Singapore
- 13.1.10 Thailandc
- 13.1.11 Rest of Asia Pacific
- 14. South America Nitrobenzene Market Analysis, Insights and Forecast, 2019-2031
- 14.1. Market Analysis, Insights and Forecast - By Country/Sub-region
- 14.1.1 Brazil
- 14.1.2 Argentina
- 14.1.3 Peru
- 14.1.4 Chile
- 14.1.5 Colombia
- 14.1.6 Ecuador
- 14.1.7 Venezuela
- 14.1.8 Rest of South America
- 15. North America Nitrobenzene Market Analysis, Insights and Forecast, 2019-2031
- 15.1. Market Analysis, Insights and Forecast - By Country/Sub-region
- 15.1.1 United States
- 15.1.2 Canada
- 15.1.3 Mexico
- 16. MEA Nitrobenzene Market Analysis, Insights and Forecast, 2019-2031
- 16.1. Market Analysis, Insights and Forecast - By Country/Sub-region
- 16.1.1 United Arab Emirates
- 16.1.2 Saudi Arabia
- 16.1.3 South Africa
- 16.1.4 Rest of Middle East and Africa
- 17. Competitive Analysis
- 17.1. Global Market Share Analysis 2024
- 17.2. Company Profiles
- 17.2.1 Sumitomo Chemical Co Ltd
- 17.2.1.1. Overview
- 17.2.1.2. Products
- 17.2.1.3. SWOT Analysis
- 17.2.1.4. Recent Developments
- 17.2.1.5. Financials (Based on Availability)
- 17.2.2 Bann Quimica Ltda
- 17.2.2.1. Overview
- 17.2.2.2. Products
- 17.2.2.3. SWOT Analysis
- 17.2.2.4. Recent Developments
- 17.2.2.5. Financials (Based on Availability)
- 17.2.3 SP Chemicals Pte Ltd
- 17.2.3.1. Overview
- 17.2.3.2. Products
- 17.2.3.3. SWOT Analysis
- 17.2.3.4. Recent Developments
- 17.2.3.5. Financials (Based on Availability)
- 17.2.4 Aarti Industries Ltd
- 17.2.4.1. Overview
- 17.2.4.2. Products
- 17.2.4.3. SWOT Analysis
- 17.2.4.4. Recent Developments
- 17.2.4.5. Financials (Based on Availability)
- 17.2.5 Wanhua*List Not Exhaustive
- 17.2.5.1. Overview
- 17.2.5.2. Products
- 17.2.5.3. SWOT Analysis
- 17.2.5.4. Recent Developments
- 17.2.5.5. Financials (Based on Availability)
- 17.2.6 Chemieorganics Chemical India Pvt Ltd
- 17.2.6.1. Overview
- 17.2.6.2. Products
- 17.2.6.3. SWOT Analysis
- 17.2.6.4. Recent Developments
- 17.2.6.5. Financials (Based on Availability)
- 17.2.7 Sadhana Nitro Chem Ltd
- 17.2.7.1. Overview
- 17.2.7.2. Products
- 17.2.7.3. SWOT Analysis
- 17.2.7.4. Recent Developments
- 17.2.7.5. Financials (Based on Availability)
- 17.2.8 Huntsman International LLC
- 17.2.8.1. Overview
- 17.2.8.2. Products
- 17.2.8.3. SWOT Analysis
- 17.2.8.4. Recent Developments
- 17.2.8.5. Financials (Based on Availability)
- 17.2.9 China Petrochemical Corporation (Sinopec)
- 17.2.9.1. Overview
- 17.2.9.2. Products
- 17.2.9.3. SWOT Analysis
- 17.2.9.4. Recent Developments
- 17.2.9.5. Financials (Based on Availability)
- 17.2.10 Aromsyn Co Ltd
- 17.2.10.1. Overview
- 17.2.10.2. Products
- 17.2.10.3. SWOT Analysis
- 17.2.10.4. Recent Developments
- 17.2.10.5. Financials (Based on Availability)
- 17.2.11 Covestro AG
- 17.2.11.1. Overview
- 17.2.11.2. Products
- 17.2.11.3. SWOT Analysis
- 17.2.11.4. Recent Developments
- 17.2.11.5. Financials (Based on Availability)
- 17.2.1 Sumitomo Chemical Co Ltd
List of Figures
- Figure 1: Global Nitrobenzene Market Revenue Breakdown (Million, %) by Region 2024 & 2032
- Figure 2: Global Nitrobenzene Market Volume Breakdown (Million, %) by Region 2024 & 2032
- Figure 3: North America Nitrobenzene Market Revenue (Million), by Country 2024 & 2032
- Figure 4: North America Nitrobenzene Market Volume (Million), by Country 2024 & 2032
- Figure 5: North America Nitrobenzene Market Revenue Share (%), by Country 2024 & 2032
- Figure 6: North America Nitrobenzene Market Volume Share (%), by Country 2024 & 2032
- Figure 7: Europe Nitrobenzene Market Revenue (Million), by Country 2024 & 2032
- Figure 8: Europe Nitrobenzene Market Volume (Million), by Country 2024 & 2032
- Figure 9: Europe Nitrobenzene Market Revenue Share (%), by Country 2024 & 2032
- Figure 10: Europe Nitrobenzene Market Volume Share (%), by Country 2024 & 2032
- Figure 11: Asia Pacific Nitrobenzene Market Revenue (Million), by Country 2024 & 2032
- Figure 12: Asia Pacific Nitrobenzene Market Volume (Million), by Country 2024 & 2032
- Figure 13: Asia Pacific Nitrobenzene Market Revenue Share (%), by Country 2024 & 2032
- Figure 14: Asia Pacific Nitrobenzene Market Volume Share (%), by Country 2024 & 2032
- Figure 15: South America Nitrobenzene Market Revenue (Million), by Country 2024 & 2032
- Figure 16: South America Nitrobenzene Market Volume (Million), by Country 2024 & 2032
- Figure 17: South America Nitrobenzene Market Revenue Share (%), by Country 2024 & 2032
- Figure 18: South America Nitrobenzene Market Volume Share (%), by Country 2024 & 2032
- Figure 19: North America Nitrobenzene Market Revenue (Million), by Country 2024 & 2032
- Figure 20: North America Nitrobenzene Market Volume (Million), by Country 2024 & 2032
- Figure 21: North America Nitrobenzene Market Revenue Share (%), by Country 2024 & 2032
- Figure 22: North America Nitrobenzene Market Volume Share (%), by Country 2024 & 2032
- Figure 23: MEA Nitrobenzene Market Revenue (Million), by Country 2024 & 2032
- Figure 24: MEA Nitrobenzene Market Volume (Million), by Country 2024 & 2032
- Figure 25: MEA Nitrobenzene Market Revenue Share (%), by Country 2024 & 2032
- Figure 26: MEA Nitrobenzene Market Volume Share (%), by Country 2024 & 2032
- Figure 27: Asia Pacific Nitrobenzene Market Revenue (Million), by Application 2024 & 2032
- Figure 28: Asia Pacific Nitrobenzene Market Volume (Million), by Application 2024 & 2032
- Figure 29: Asia Pacific Nitrobenzene Market Revenue Share (%), by Application 2024 & 2032
- Figure 30: Asia Pacific Nitrobenzene Market Volume Share (%), by Application 2024 & 2032
- Figure 31: Asia Pacific Nitrobenzene Market Revenue (Million), by Country 2024 & 2032
- Figure 32: Asia Pacific Nitrobenzene Market Volume (Million), by Country 2024 & 2032
- Figure 33: Asia Pacific Nitrobenzene Market Revenue Share (%), by Country 2024 & 2032
- Figure 34: Asia Pacific Nitrobenzene Market Volume Share (%), by Country 2024 & 2032
- Figure 35: North America Nitrobenzene Market Revenue (Million), by Application 2024 & 2032
- Figure 36: North America Nitrobenzene Market Volume (Million), by Application 2024 & 2032
- Figure 37: North America Nitrobenzene Market Revenue Share (%), by Application 2024 & 2032
- Figure 38: North America Nitrobenzene Market Volume Share (%), by Application 2024 & 2032
- Figure 39: North America Nitrobenzene Market Revenue (Million), by Country 2024 & 2032
- Figure 40: North America Nitrobenzene Market Volume (Million), by Country 2024 & 2032
- Figure 41: North America Nitrobenzene Market Revenue Share (%), by Country 2024 & 2032
- Figure 42: North America Nitrobenzene Market Volume Share (%), by Country 2024 & 2032
- Figure 43: Europe Nitrobenzene Market Revenue (Million), by Application 2024 & 2032
- Figure 44: Europe Nitrobenzene Market Volume (Million), by Application 2024 & 2032
- Figure 45: Europe Nitrobenzene Market Revenue Share (%), by Application 2024 & 2032
- Figure 46: Europe Nitrobenzene Market Volume Share (%), by Application 2024 & 2032
- Figure 47: Europe Nitrobenzene Market Revenue (Million), by Country 2024 & 2032
- Figure 48: Europe Nitrobenzene Market Volume (Million), by Country 2024 & 2032
- Figure 49: Europe Nitrobenzene Market Revenue Share (%), by Country 2024 & 2032
- Figure 50: Europe Nitrobenzene Market Volume Share (%), by Country 2024 & 2032
- Figure 51: South America Nitrobenzene Market Revenue (Million), by Application 2024 & 2032
- Figure 52: South America Nitrobenzene Market Volume (Million), by Application 2024 & 2032
- Figure 53: South America Nitrobenzene Market Revenue Share (%), by Application 2024 & 2032
- Figure 54: South America Nitrobenzene Market Volume Share (%), by Application 2024 & 2032
- Figure 55: South America Nitrobenzene Market Revenue (Million), by Country 2024 & 2032
- Figure 56: South America Nitrobenzene Market Volume (Million), by Country 2024 & 2032
- Figure 57: South America Nitrobenzene Market Revenue Share (%), by Country 2024 & 2032
- Figure 58: South America Nitrobenzene Market Volume Share (%), by Country 2024 & 2032
- Figure 59: Middle East and Africa Nitrobenzene Market Revenue (Million), by Application 2024 & 2032
- Figure 60: Middle East and Africa Nitrobenzene Market Volume (Million), by Application 2024 & 2032
- Figure 61: Middle East and Africa Nitrobenzene Market Revenue Share (%), by Application 2024 & 2032
- Figure 62: Middle East and Africa Nitrobenzene Market Volume Share (%), by Application 2024 & 2032
- Figure 63: Middle East and Africa Nitrobenzene Market Revenue (Million), by Country 2024 & 2032
- Figure 64: Middle East and Africa Nitrobenzene Market Volume (Million), by Country 2024 & 2032
- Figure 65: Middle East and Africa Nitrobenzene Market Revenue Share (%), by Country 2024 & 2032
- Figure 66: Middle East and Africa Nitrobenzene Market Volume Share (%), by Country 2024 & 2032
List of Tables
- Table 1: Global Nitrobenzene Market Revenue Million Forecast, by Region 2019 & 2032
- Table 2: Global Nitrobenzene Market Volume Million Forecast, by Region 2019 & 2032
- Table 3: Global Nitrobenzene Market Revenue Million Forecast, by Application 2019 & 2032
- Table 4: Global Nitrobenzene Market Volume Million Forecast, by Application 2019 & 2032
- Table 5: Global Nitrobenzene Market Revenue Million Forecast, by Region 2019 & 2032
- Table 6: Global Nitrobenzene Market Volume Million Forecast, by Region 2019 & 2032
- Table 7: Global Nitrobenzene Market Revenue Million Forecast, by Country 2019 & 2032
- Table 8: Global Nitrobenzene Market Volume Million Forecast, by Country 2019 & 2032
- Table 9: United States Nitrobenzene Market Revenue (Million) Forecast, by Application 2019 & 2032
- Table 10: United States Nitrobenzene Market Volume (Million) Forecast, by Application 2019 & 2032
- Table 11: Canada Nitrobenzene Market Revenue (Million) Forecast, by Application 2019 & 2032
- Table 12: Canada Nitrobenzene Market Volume (Million) Forecast, by Application 2019 & 2032
- Table 13: Mexico Nitrobenzene Market Revenue (Million) Forecast, by Application 2019 & 2032
- Table 14: Mexico Nitrobenzene Market Volume (Million) Forecast, by Application 2019 & 2032
- Table 15: Global Nitrobenzene Market Revenue Million Forecast, by Country 2019 & 2032
- Table 16: Global Nitrobenzene Market Volume Million Forecast, by Country 2019 & 2032
- Table 17: Germany Nitrobenzene Market Revenue (Million) Forecast, by Application 2019 & 2032
- Table 18: Germany Nitrobenzene Market Volume (Million) Forecast, by Application 2019 & 2032
- Table 19: United Kingdom Nitrobenzene Market Revenue (Million) Forecast, by Application 2019 & 2032
- Table 20: United Kingdom Nitrobenzene Market Volume (Million) Forecast, by Application 2019 & 2032
- Table 21: France Nitrobenzene Market Revenue (Million) Forecast, by Application 2019 & 2032
- Table 22: France Nitrobenzene Market Volume (Million) Forecast, by Application 2019 & 2032
- Table 23: Spain Nitrobenzene Market Revenue (Million) Forecast, by Application 2019 & 2032
- Table 24: Spain Nitrobenzene Market Volume (Million) Forecast, by Application 2019 & 2032
- Table 25: Italy Nitrobenzene Market Revenue (Million) Forecast, by Application 2019 & 2032
- Table 26: Italy Nitrobenzene Market Volume (Million) Forecast, by Application 2019 & 2032
- Table 27: Spain Nitrobenzene Market Revenue (Million) Forecast, by Application 2019 & 2032
- Table 28: Spain Nitrobenzene Market Volume (Million) Forecast, by Application 2019 & 2032
- Table 29: Belgium Nitrobenzene Market Revenue (Million) Forecast, by Application 2019 & 2032
- Table 30: Belgium Nitrobenzene Market Volume (Million) Forecast, by Application 2019 & 2032
- Table 31: Netherland Nitrobenzene Market Revenue (Million) Forecast, by Application 2019 & 2032
- Table 32: Netherland Nitrobenzene Market Volume (Million) Forecast, by Application 2019 & 2032
- Table 33: Nordics Nitrobenzene Market Revenue (Million) Forecast, by Application 2019 & 2032
- Table 34: Nordics Nitrobenzene Market Volume (Million) Forecast, by Application 2019 & 2032
- Table 35: Rest of Europe Nitrobenzene Market Revenue (Million) Forecast, by Application 2019 & 2032
- Table 36: Rest of Europe Nitrobenzene Market Volume (Million) Forecast, by Application 2019 & 2032
- Table 37: Global Nitrobenzene Market Revenue Million Forecast, by Country 2019 & 2032
- Table 38: Global Nitrobenzene Market Volume Million Forecast, by Country 2019 & 2032
- Table 39: China Nitrobenzene Market Revenue (Million) Forecast, by Application 2019 & 2032
- Table 40: China Nitrobenzene Market Volume (Million) Forecast, by Application 2019 & 2032
- Table 41: Japan Nitrobenzene Market Revenue (Million) Forecast, by Application 2019 & 2032
- Table 42: Japan Nitrobenzene Market Volume (Million) Forecast, by Application 2019 & 2032
- Table 43: India Nitrobenzene Market Revenue (Million) Forecast, by Application 2019 & 2032
- Table 44: India Nitrobenzene Market Volume (Million) Forecast, by Application 2019 & 2032
- Table 45: South Korea Nitrobenzene Market Revenue (Million) Forecast, by Application 2019 & 2032
- Table 46: South Korea Nitrobenzene Market Volume (Million) Forecast, by Application 2019 & 2032
- Table 47: Southeast Asia Nitrobenzene Market Revenue (Million) Forecast, by Application 2019 & 2032
- Table 48: Southeast Asia Nitrobenzene Market Volume (Million) Forecast, by Application 2019 & 2032
- Table 49: Australia Nitrobenzene Market Revenue (Million) Forecast, by Application 2019 & 2032
- Table 50: Australia Nitrobenzene Market Volume (Million) Forecast, by Application 2019 & 2032
- Table 51: Indonesia Nitrobenzene Market Revenue (Million) Forecast, by Application 2019 & 2032
- Table 52: Indonesia Nitrobenzene Market Volume (Million) Forecast, by Application 2019 & 2032
- Table 53: Phillipes Nitrobenzene Market Revenue (Million) Forecast, by Application 2019 & 2032
- Table 54: Phillipes Nitrobenzene Market Volume (Million) Forecast, by Application 2019 & 2032
- Table 55: Singapore Nitrobenzene Market Revenue (Million) Forecast, by Application 2019 & 2032
- Table 56: Singapore Nitrobenzene Market Volume (Million) Forecast, by Application 2019 & 2032
- Table 57: Thailandc Nitrobenzene Market Revenue (Million) Forecast, by Application 2019 & 2032
- Table 58: Thailandc Nitrobenzene Market Volume (Million) Forecast, by Application 2019 & 2032
- Table 59: Rest of Asia Pacific Nitrobenzene Market Revenue (Million) Forecast, by Application 2019 & 2032
- Table 60: Rest of Asia Pacific Nitrobenzene Market Volume (Million) Forecast, by Application 2019 & 2032
- Table 61: Global Nitrobenzene Market Revenue Million Forecast, by Country 2019 & 2032
- Table 62: Global Nitrobenzene Market Volume Million Forecast, by Country 2019 & 2032
- Table 63: Brazil Nitrobenzene Market Revenue (Million) Forecast, by Application 2019 & 2032
- Table 64: Brazil Nitrobenzene Market Volume (Million) Forecast, by Application 2019 & 2032
- Table 65: Argentina Nitrobenzene Market Revenue (Million) Forecast, by Application 2019 & 2032
- Table 66: Argentina Nitrobenzene Market Volume (Million) Forecast, by Application 2019 & 2032
- Table 67: Peru Nitrobenzene Market Revenue (Million) Forecast, by Application 2019 & 2032
- Table 68: Peru Nitrobenzene Market Volume (Million) Forecast, by Application 2019 & 2032
- Table 69: Chile Nitrobenzene Market Revenue (Million) Forecast, by Application 2019 & 2032
- Table 70: Chile Nitrobenzene Market Volume (Million) Forecast, by Application 2019 & 2032
- Table 71: Colombia Nitrobenzene Market Revenue (Million) Forecast, by Application 2019 & 2032
- Table 72: Colombia Nitrobenzene Market Volume (Million) Forecast, by Application 2019 & 2032
- Table 73: Ecuador Nitrobenzene Market Revenue (Million) Forecast, by Application 2019 & 2032
- Table 74: Ecuador Nitrobenzene Market Volume (Million) Forecast, by Application 2019 & 2032
- Table 75: Venezuela Nitrobenzene Market Revenue (Million) Forecast, by Application 2019 & 2032
- Table 76: Venezuela Nitrobenzene Market Volume (Million) Forecast, by Application 2019 & 2032
- Table 77: Rest of South America Nitrobenzene Market Revenue (Million) Forecast, by Application 2019 & 2032
- Table 78: Rest of South America Nitrobenzene Market Volume (Million) Forecast, by Application 2019 & 2032
- Table 79: Global Nitrobenzene Market Revenue Million Forecast, by Country 2019 & 2032
- Table 80: Global Nitrobenzene Market Volume Million Forecast, by Country 2019 & 2032
- Table 81: United States Nitrobenzene Market Revenue (Million) Forecast, by Application 2019 & 2032
- Table 82: United States Nitrobenzene Market Volume (Million) Forecast, by Application 2019 & 2032
- Table 83: Canada Nitrobenzene Market Revenue (Million) Forecast, by Application 2019 & 2032
- Table 84: Canada Nitrobenzene Market Volume (Million) Forecast, by Application 2019 & 2032
- Table 85: Mexico Nitrobenzene Market Revenue (Million) Forecast, by Application 2019 & 2032
- Table 86: Mexico Nitrobenzene Market Volume (Million) Forecast, by Application 2019 & 2032
- Table 87: Global Nitrobenzene Market Revenue Million Forecast, by Country 2019 & 2032
- Table 88: Global Nitrobenzene Market Volume Million Forecast, by Country 2019 & 2032
- Table 89: United Arab Emirates Nitrobenzene Market Revenue (Million) Forecast, by Application 2019 & 2032
- Table 90: United Arab Emirates Nitrobenzene Market Volume (Million) Forecast, by Application 2019 & 2032
- Table 91: Saudi Arabia Nitrobenzene Market Revenue (Million) Forecast, by Application 2019 & 2032
- Table 92: Saudi Arabia Nitrobenzene Market Volume (Million) Forecast, by Application 2019 & 2032
- Table 93: South Africa Nitrobenzene Market Revenue (Million) Forecast, by Application 2019 & 2032
- Table 94: South Africa Nitrobenzene Market Volume (Million) Forecast, by Application 2019 & 2032
- Table 95: Rest of Middle East and Africa Nitrobenzene Market Revenue (Million) Forecast, by Application 2019 & 2032
- Table 96: Rest of Middle East and Africa Nitrobenzene Market Volume (Million) Forecast, by Application 2019 & 2032
- Table 97: Global Nitrobenzene Market Revenue Million Forecast, by Application 2019 & 2032
- Table 98: Global Nitrobenzene Market Volume Million Forecast, by Application 2019 & 2032
- Table 99: Global Nitrobenzene Market Revenue Million Forecast, by Country 2019 & 2032
- Table 100: Global Nitrobenzene Market Volume Million Forecast, by Country 2019 & 2032
- Table 101: China Nitrobenzene Market Revenue (Million) Forecast, by Application 2019 & 2032
- Table 102: China Nitrobenzene Market Volume (Million) Forecast, by Application 2019 & 2032
- Table 103: India Nitrobenzene Market Revenue (Million) Forecast, by Application 2019 & 2032
- Table 104: India Nitrobenzene Market Volume (Million) Forecast, by Application 2019 & 2032
- Table 105: Japan Nitrobenzene Market Revenue (Million) Forecast, by Application 2019 & 2032
- Table 106: Japan Nitrobenzene Market Volume (Million) Forecast, by Application 2019 & 2032
- Table 107: South Korea Nitrobenzene Market Revenue (Million) Forecast, by Application 2019 & 2032
- Table 108: South Korea Nitrobenzene Market Volume (Million) Forecast, by Application 2019 & 2032
- Table 109: Malaysia Nitrobenzene Market Revenue (Million) Forecast, by Application 2019 & 2032
- Table 110: Malaysia Nitrobenzene Market Volume (Million) Forecast, by Application 2019 & 2032
- Table 111: Thailand Nitrobenzene Market Revenue (Million) Forecast, by Application 2019 & 2032
- Table 112: Thailand Nitrobenzene Market Volume (Million) Forecast, by Application 2019 & 2032
- Table 113: Indonesia Nitrobenzene Market Revenue (Million) Forecast, by Application 2019 & 2032
- Table 114: Indonesia Nitrobenzene Market Volume (Million) Forecast, by Application 2019 & 2032
- Table 115: Vietnam Nitrobenzene Market Revenue (Million) Forecast, by Application 2019 & 2032
- Table 116: Vietnam Nitrobenzene Market Volume (Million) Forecast, by Application 2019 & 2032
- Table 117: Rest of Asia Pacific Nitrobenzene Market Revenue (Million) Forecast, by Application 2019 & 2032
- Table 118: Rest of Asia Pacific Nitrobenzene Market Volume (Million) Forecast, by Application 2019 & 2032
- Table 119: Global Nitrobenzene Market Revenue Million Forecast, by Application 2019 & 2032
- Table 120: Global Nitrobenzene Market Volume Million Forecast, by Application 2019 & 2032
- Table 121: Global Nitrobenzene Market Revenue Million Forecast, by Country 2019 & 2032
- Table 122: Global Nitrobenzene Market Volume Million Forecast, by Country 2019 & 2032
- Table 123: United States Nitrobenzene Market Revenue (Million) Forecast, by Application 2019 & 2032
- Table 124: United States Nitrobenzene Market Volume (Million) Forecast, by Application 2019 & 2032
- Table 125: Canada Nitrobenzene Market Revenue (Million) Forecast, by Application 2019 & 2032
- Table 126: Canada Nitrobenzene Market Volume (Million) Forecast, by Application 2019 & 2032
- Table 127: Mexico Nitrobenzene Market Revenue (Million) Forecast, by Application 2019 & 2032
- Table 128: Mexico Nitrobenzene Market Volume (Million) Forecast, by Application 2019 & 2032
- Table 129: Global Nitrobenzene Market Revenue Million Forecast, by Application 2019 & 2032
- Table 130: Global Nitrobenzene Market Volume Million Forecast, by Application 2019 & 2032
- Table 131: Global Nitrobenzene Market Revenue Million Forecast, by Country 2019 & 2032
- Table 132: Global Nitrobenzene Market Volume Million Forecast, by Country 2019 & 2032
- Table 133: Germany Nitrobenzene Market Revenue (Million) Forecast, by Application 2019 & 2032
- Table 134: Germany Nitrobenzene Market Volume (Million) Forecast, by Application 2019 & 2032
- Table 135: United Kingdom Nitrobenzene Market Revenue (Million) Forecast, by Application 2019 & 2032
- Table 136: United Kingdom Nitrobenzene Market Volume (Million) Forecast, by Application 2019 & 2032
- Table 137: Italy Nitrobenzene Market Revenue (Million) Forecast, by Application 2019 & 2032
- Table 138: Italy Nitrobenzene Market Volume (Million) Forecast, by Application 2019 & 2032
- Table 139: France Nitrobenzene Market Revenue (Million) Forecast, by Application 2019 & 2032
- Table 140: France Nitrobenzene Market Volume (Million) Forecast, by Application 2019 & 2032
- Table 141: Spain Nitrobenzene Market Revenue (Million) Forecast, by Application 2019 & 2032
- Table 142: Spain Nitrobenzene Market Volume (Million) Forecast, by Application 2019 & 2032
- Table 143: NORDIC Nitrobenzene Market Revenue (Million) Forecast, by Application 2019 & 2032
- Table 144: NORDIC Nitrobenzene Market Volume (Million) Forecast, by Application 2019 & 2032
- Table 145: Turkey Nitrobenzene Market Revenue (Million) Forecast, by Application 2019 & 2032
- Table 146: Turkey Nitrobenzene Market Volume (Million) Forecast, by Application 2019 & 2032
- Table 147: Russia Nitrobenzene Market Revenue (Million) Forecast, by Application 2019 & 2032
- Table 148: Russia Nitrobenzene Market Volume (Million) Forecast, by Application 2019 & 2032
- Table 149: Rest of Europe Nitrobenzene Market Revenue (Million) Forecast, by Application 2019 & 2032
- Table 150: Rest of Europe Nitrobenzene Market Volume (Million) Forecast, by Application 2019 & 2032
- Table 151: Global Nitrobenzene Market Revenue Million Forecast, by Application 2019 & 2032
- Table 152: Global Nitrobenzene Market Volume Million Forecast, by Application 2019 & 2032
- Table 153: Global Nitrobenzene Market Revenue Million Forecast, by Country 2019 & 2032
- Table 154: Global Nitrobenzene Market Volume Million Forecast, by Country 2019 & 2032
- Table 155: Brazil Nitrobenzene Market Revenue (Million) Forecast, by Application 2019 & 2032
- Table 156: Brazil Nitrobenzene Market Volume (Million) Forecast, by Application 2019 & 2032
- Table 157: Argentina Nitrobenzene Market Revenue (Million) Forecast, by Application 2019 & 2032
- Table 158: Argentina Nitrobenzene Market Volume (Million) Forecast, by Application 2019 & 2032
- Table 159: Colombia Nitrobenzene Market Revenue (Million) Forecast, by Application 2019 & 2032
- Table 160: Colombia Nitrobenzene Market Volume (Million) Forecast, by Application 2019 & 2032
- Table 161: Rest of South America Nitrobenzene Market Revenue (Million) Forecast, by Application 2019 & 2032
- Table 162: Rest of South America Nitrobenzene Market Volume (Million) Forecast, by Application 2019 & 2032
- Table 163: Global Nitrobenzene Market Revenue Million Forecast, by Application 2019 & 2032
- Table 164: Global Nitrobenzene Market Volume Million Forecast, by Application 2019 & 2032
- Table 165: Global Nitrobenzene Market Revenue Million Forecast, by Country 2019 & 2032
- Table 166: Global Nitrobenzene Market Volume Million Forecast, by Country 2019 & 2032
- Table 167: Saudi Arabia Nitrobenzene Market Revenue (Million) Forecast, by Application 2019 & 2032
- Table 168: Saudi Arabia Nitrobenzene Market Volume (Million) Forecast, by Application 2019 & 2032
- Table 169: South Africa Nitrobenzene Market Revenue (Million) Forecast, by Application 2019 & 2032
- Table 170: South Africa Nitrobenzene Market Volume (Million) Forecast, by Application 2019 & 2032
- Table 171: Nigeria Nitrobenzene Market Revenue (Million) Forecast, by Application 2019 & 2032
- Table 172: Nigeria Nitrobenzene Market Volume (Million) Forecast, by Application 2019 & 2032
- Table 173: Qatar Nitrobenzene Market Revenue (Million) Forecast, by Application 2019 & 2032
- Table 174: Qatar Nitrobenzene Market Volume (Million) Forecast, by Application 2019 & 2032
- Table 175: Egypt Nitrobenzene Market Revenue (Million) Forecast, by Application 2019 & 2032
- Table 176: Egypt Nitrobenzene Market Volume (Million) Forecast, by Application 2019 & 2032
- Table 177: United Arab Emirates Nitrobenzene Market Revenue (Million) Forecast, by Application 2019 & 2032
- Table 178: United Arab Emirates Nitrobenzene Market Volume (Million) Forecast, by Application 2019 & 2032
- Table 179: Rest of Middle East and Africa Nitrobenzene Market Revenue (Million) Forecast, by Application 2019 & 2032
- Table 180: Rest of Middle East and Africa Nitrobenzene Market Volume (Million) Forecast, by Application 2019 & 2032
Frequently Asked Questions
1. What is the projected Compound Annual Growth Rate (CAGR) of the Nitrobenzene Market?
The projected CAGR is approximately 4.26%.
2. Which companies are prominent players in the Nitrobenzene Market?
Key companies in the market include Sumitomo Chemical Co Ltd, Bann Quimica Ltda, SP Chemicals Pte Ltd, Aarti Industries Ltd, Wanhua*List Not Exhaustive, Chemieorganics Chemical India Pvt Ltd, Sadhana Nitro Chem Ltd, Huntsman International LLC, China Petrochemical Corporation (Sinopec), Aromsyn Co Ltd, Covestro AG.
3. What are the main segments of the Nitrobenzene Market?
The market segments include Application.
4. Can you provide details about the market size?
The market size is estimated to be USD XX Million as of 2022.
5. What are some drivers contributing to market growth?
Increasing Demand for Aniline; Easy Availability of Raw Materials; Growing Construction Activities in the Asia-Pacific Region.
6. What are the notable trends driving market growth?
Increasing Demand for Aniline Production.
7. Are there any restraints impacting market growth?
Growing Demand for Bio-based Chemicals; Other Restraints.
8. Can you provide examples of recent developments in the market?
July 2023: Wanhua's BorsodChem inaugurated Site IV and its new production units, as part of which the company has invested in the construction of nitrobenzene and aniline production facilities in the new site.
9. What pricing options are available for accessing the report?
Pricing options include single-user, multi-user, and enterprise licenses priced at USD 4750, USD 5250, and USD 8750 respectively.
10. Is the market size provided in terms of value or volume?
The market size is provided in terms of value, measured in Million and volume, measured in Million.
11. Are there any specific market keywords associated with the report?
Yes, the market keyword associated with the report is "Nitrobenzene Market," which aids in identifying and referencing the specific market segment covered.
12. How do I determine which pricing option suits my needs best?
The pricing options vary based on user requirements and access needs. Individual users may opt for single-user licenses, while businesses requiring broader access may choose multi-user or enterprise licenses for cost-effective access to the report.
13. Are there any additional resources or data provided in the Nitrobenzene Market report?
While the report offers comprehensive insights, it's advisable to review the specific contents or supplementary materials provided to ascertain if additional resources or data are available.
14. How can I stay updated on further developments or reports in the Nitrobenzene Market?
To stay informed about further developments, trends, and reports in the Nitrobenzene Market, consider subscribing to industry newsletters, following relevant companies and organizations, or regularly checking reputable industry news sources and publications.
Methodology
Step 1 - Identification of Relevant Samples Size from Population Database


Step 2 - Approaches for Defining Global Market Size (Value, Volume* & Price*)

Note*: In applicable scenarios
Step 3 - Data Sources
Primary Research
- Web Analytics
- Survey Reports
- Research Institute
- Latest Research Reports
- Opinion Leaders
Secondary Research
- Annual Reports
- White Paper
- Latest Press Release
- Industry Association
- Paid Database
- Investor Presentations

Step 4 - Data Triangulation
Involves using different sources of information in order to increase the validity of a study
These sources are likely to be stakeholders in a program - participants, other researchers, program staff, other community members, and so on.
Then we put all data in single framework & apply various statistical tools to find out the dynamic on the market.
During the analysis stage, feedback from the stakeholder groups would be compared to determine areas of agreement as well as areas of divergence
