

Key Insights
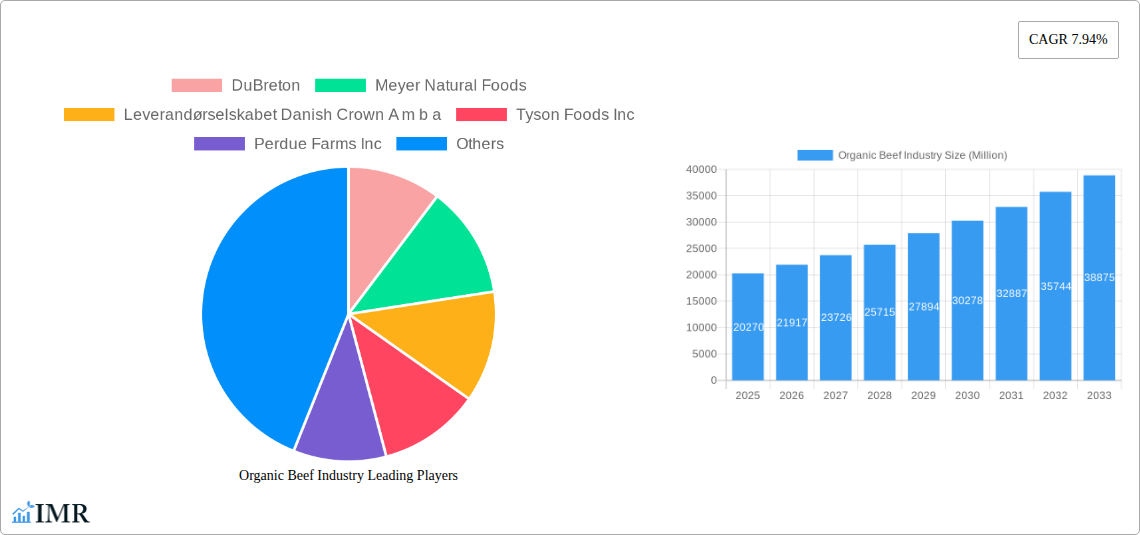
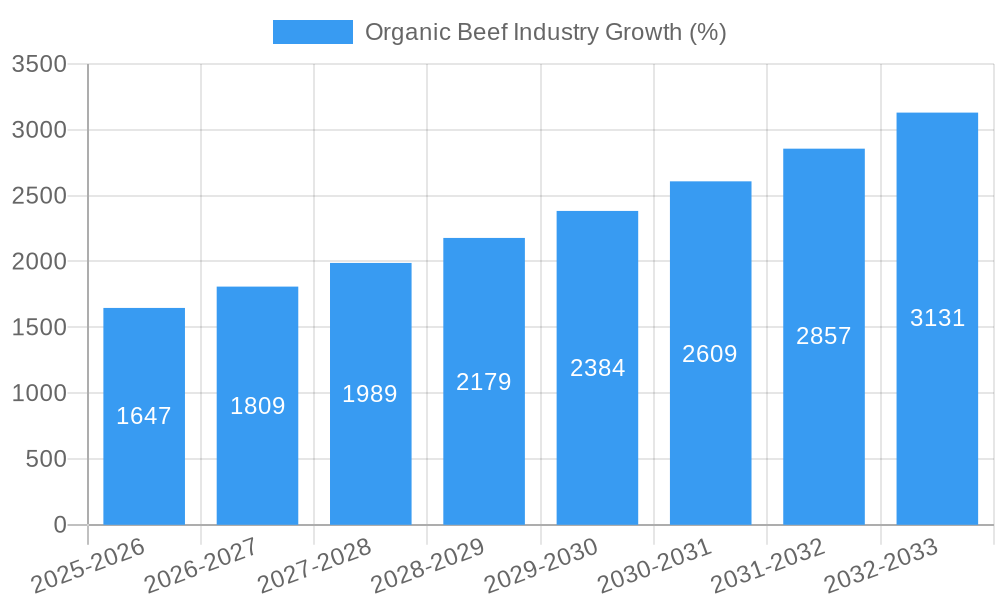
The organic beef market, valued at $20.27 billion in 2025, is experiencing robust growth, projected to expand at a compound annual growth rate (CAGR) of 7.94% from 2025 to 2033. This expansion is fueled by several key drivers. Increasing consumer awareness of health and wellness, coupled with a growing preference for sustainably produced food, is significantly boosting demand for organic beef. The rising disposable incomes in developing economies, particularly in Asia-Pacific, further contribute to market growth, as consumers are increasingly willing to pay a premium for higher-quality, ethically sourced products. Furthermore, the increasing adoption of sustainable farming practices by producers and the growing availability of organic beef through diverse distribution channels, including online retailing and specialty stores, are expanding market reach and accessibility. While factors like fluctuating raw material prices and stringent regulations surrounding organic certification could pose challenges, the overall market outlook remains positive.
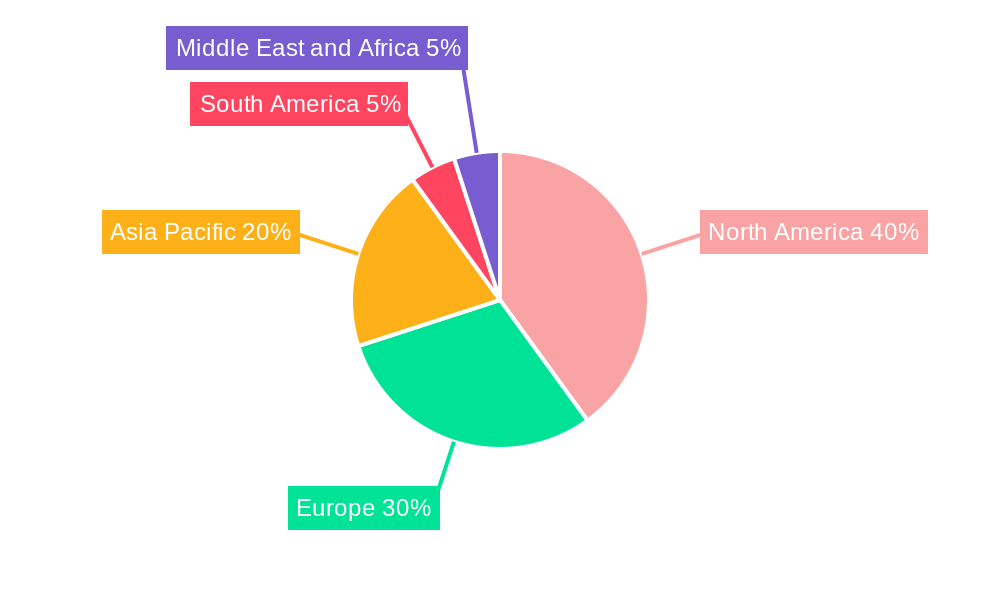
The market segmentation reveals valuable insights into consumer preferences and industry dynamics. Poultry remains the largest segment within organic meats, but beef holds a significant share and shows strong growth potential. Hypermarkets and supermarkets dominate the distribution channels, offering wide accessibility to consumers. However, the growth of online retailing presents a significant opportunity for expansion, particularly amongst younger demographics. Key players such as DuBreton, Meyer Natural Foods, and Tyson Foods are leading the market, driving innovation and influencing consumer choices through branding and marketing strategies. Geographical analysis reveals strong growth potential in Asia-Pacific, fueled by rising incomes and changing dietary habits. North America, already a large market, is expected to continue its stable growth trajectory, driven by established consumer preferences for organic products. Europe, with its robust regulatory framework for organic food, also shows promise for continued expansion.
Organic Beef Industry: A Comprehensive Market Report (2019-2033)
This in-depth report provides a comprehensive analysis of the Organic Beef Industry, encompassing market dynamics, growth trends, regional performance, and key players. The study period covers 2019-2033, with 2025 serving as the base and estimated year. The forecast period extends from 2025 to 2033, and the historical period analyzed is 2019-2024. The report analyzes parent markets (Organic Meat Industry) and child markets (specific organic beef cuts, processing types). Market values are presented in millions.
Organic Beef Industry Market Dynamics & Structure
This section analyzes the competitive landscape, technological advancements, regulatory environment, and market trends within the organic beef industry. The report delves into market concentration, examining the market share held by key players like DuBreton, Meyer Natural Foods, Leverandørselskabet Danish Crown A/S, Tyson Foods Inc, Perdue Farms Inc, Foster Farms, Eversfield Organic, Verde Farms, Swellington Organic Farm, and JBS SA. The analysis also considers the impact of mergers and acquisitions (M&A) activities, quantifying deal volumes during the study period (xx million deals).
- Market Concentration: The organic beef market exhibits a (xx)% level of concentration, with the top five players holding a combined (xx)% market share in 2024.
- Technological Innovation: Advancements in breeding techniques, feed management, and processing technologies are key drivers, but high initial investment acts as a barrier.
- Regulatory Framework: Stringent organic certification standards and evolving food safety regulations significantly influence market dynamics.
- Competitive Substitutes: Conventional beef and other protein sources (poultry, pork) pose significant competition.
- End-User Demographics: Growing consumer awareness of health and sustainability is driving demand amongst affluent, health-conscious consumers.
- M&A Trends: A growing number of M&A activities are reshaping the market landscape, with xx million dollars invested in acquisitions from 2019-2024.
Organic Beef Industry Growth Trends & Insights
Utilizing market research data (XXX), this section examines the evolution of market size, adoption rates, technological disruptions, and consumer behavior shifts within the organic beef industry. The report projects a Compound Annual Growth Rate (CAGR) of (xx)% during the forecast period (2025-2033), reaching a market value of (xx) million by 2033. Market penetration is expected to increase from (xx)% in 2024 to (xx)% by 2033. The analysis will consider factors such as increased consumer demand, expanding retail channels, and government initiatives promoting sustainable agriculture.
Dominant Regions, Countries, or Segments in Organic Beef Industry
This section identifies the leading regions, countries, and segments within the organic beef market. North America currently dominates, driven by strong consumer demand and established organic farming practices. However, Europe and Asia-Pacific are showing significant growth potential. Within segments, beef maintains the largest share amongst (Poultry, Beef, Pork, Other Organic Meats), followed by (xx). Hypermarkets and supermarkets dominate distribution channels, followed by specialty stores.
- Key Drivers (North America): Strong consumer preference for organic food, established supply chains, and government support for organic agriculture.
- Key Drivers (Europe): Increasing consumer awareness of food safety and sustainability, government regulations promoting organic farming, and growing demand for premium quality beef.
- Key Drivers (Asia-Pacific): Rising disposable incomes, changing dietary habits, and increasing demand for high-quality protein.
- Distribution Channel Dominance: Hypermarkets/supermarkets account for (xx)% of sales in 2024, demonstrating the importance of large-scale retail.
Organic Beef Industry Product Landscape
The organic beef market offers a range of products, including grass-fed, grain-finished, and various cuts tailored to consumer preferences. Technological advancements, like improved traceability systems and sustainable farming practices, enhance product quality and appeal. Unique selling propositions focus on animal welfare, environmental sustainability, and superior taste.
Key Drivers, Barriers & Challenges in Organic Beef Industry
Key Drivers: Growing consumer demand for healthy and sustainable food options, increasing awareness of animal welfare concerns, and government support for organic farming are driving market growth.
Challenges: High production costs, limited availability of organic feed, stringent certification requirements, and fluctuating consumer demand pose significant challenges. Supply chain inefficiencies contribute to price volatility, impacting market growth.
Emerging Opportunities in Organic Beef Industry
Emerging opportunities include expanding into untapped markets (e.g., developing economies), developing innovative products (e.g., organic beef jerky, ready-to-eat meals), and catering to evolving consumer preferences (e.g., plant-based alternatives).
Growth Accelerators in the Organic Beef Industry Industry
Technological advancements in breeding, feed, and processing, strategic partnerships between producers and retailers, and expansion into new geographical markets are key growth catalysts.
Key Players Shaping the Organic Beef Industry Market
- DuBreton
- Meyer Natural Foods
- Leverandørselskabet Danish Crown A/S
- Tyson Foods Inc
- Perdue Farms Inc
- Foster Farms
- Eversfield Organic
- Verde Farms
- Swellington Organic Farm
- JBS SA
Notable Milestones in Organic Beef Industry Sector
- 2021 Q3: Increased organic beef certification standards implemented in the EU.
- 2022 Q1: Major retailer launches a private label organic beef line.
- 2023 Q4: Launch of a new grass-fed organic beef brand.
In-Depth Organic Beef Industry Market Outlook
The organic beef market is poised for sustained growth, driven by increasing consumer awareness, expanding distribution channels, and ongoing innovation. Strategic investments in sustainable farming practices and supply chain optimization will be crucial for continued success. The market presents significant opportunities for both established players and new entrants.
Organic Beef Industry Segmentation
-
1. Type
- 1.1. Poultry
- 1.2. Beef
- 1.3. Pork
- 1.4. Other Organic Meats
-
2. Distribution Channel
- 2.1. Hypermarkets and Supermarkets
- 2.2. Speciality Stores
- 2.3. Online Retailing
- 2.4. Retail and Departmental Stores
Organic Beef Industry Segmentation By Geography
-
1. North America
- 1.1. United States
- 1.2. Canada
- 1.3. Mexico
- 1.4. Rest of North America
-
2. Europe
- 2.1. Germany
- 2.2. United Kingdom
- 2.3. France
- 2.4. Russia
- 2.5. Spain
- 2.6. Rest of Europe
-
3. Asia Pacific
- 3.1. China
- 3.2. Japan
- 3.3. India
- 3.4. South Korea
- 3.5. Rest of Asia Pacific
-
4. South America
- 4.1. Brazil
- 4.2. Argentina
- 4.3. Rest of South America
-
5. Middle East and Africa
- 5.1. UAE
- 5.2. Saudi Arabia
- 5.3. South Africa
- 5.4. Egypt
- 5.5. Rest of Middle East and Africa
Organic Beef Industry REPORT HIGHLIGHTS
| Aspects | Details |
|---|---|
| Study Period | 2019-2033 |
| Base Year | 2024 |
| Estimated Year | 2025 |
| Forecast Period | 2025-2033 |
| Historical Period | 2019-2024 |
| Growth Rate | CAGR of 7.94% from 2019-2033 |
| Segmentation |
|
Table of Contents
- 1. Introduction
- 1.1. Research Scope
- 1.2. Market Segmentation
- 1.3. Research Methodology
- 1.4. Definitions and Assumptions
- 2. Executive Summary
- 2.1. Introduction
- 3. Market Dynamics
- 3.1. Introduction
- 3.2. Market Drivers
- 3.2.1. Increased Health Awareness; Increased availability of organic beef
- 3.3. Market Restrains
- 3.3.1. Organic beef is often more expensive than conventionally produced beef
- 3.4. Market Trends
- 3.4.1. Growing trend towards offering a variety of organic beef products
- 4. Market Factor Analysis
- 4.1. Porters Five Forces
- 4.2. Supply/Value Chain
- 4.3. PESTEL analysis
- 4.4. Market Entropy
- 4.5. Patent/Trademark Analysis
- 5. Global Organic Beef Industry Analysis, Insights and Forecast, 2019-2031
- 5.1. Market Analysis, Insights and Forecast - by Type
- 5.1.1. Poultry
- 5.1.2. Beef
- 5.1.3. Pork
- 5.1.4. Other Organic Meats
- 5.2. Market Analysis, Insights and Forecast - by Distribution Channel
- 5.2.1. Hypermarkets and Supermarkets
- 5.2.2. Speciality Stores
- 5.2.3. Online Retailing
- 5.2.4. Retail and Departmental Stores
- 5.3. Market Analysis, Insights and Forecast - by Region
- 5.3.1. North America
- 5.3.2. Europe
- 5.3.3. Asia Pacific
- 5.3.4. South America
- 5.3.5. Middle East and Africa
- 5.1. Market Analysis, Insights and Forecast - by Type
- 6. North America Organic Beef Industry Analysis, Insights and Forecast, 2019-2031
- 6.1. Market Analysis, Insights and Forecast - by Type
- 6.1.1. Poultry
- 6.1.2. Beef
- 6.1.3. Pork
- 6.1.4. Other Organic Meats
- 6.2. Market Analysis, Insights and Forecast - by Distribution Channel
- 6.2.1. Hypermarkets and Supermarkets
- 6.2.2. Speciality Stores
- 6.2.3. Online Retailing
- 6.2.4. Retail and Departmental Stores
- 6.1. Market Analysis, Insights and Forecast - by Type
- 7. Europe Organic Beef Industry Analysis, Insights and Forecast, 2019-2031
- 7.1. Market Analysis, Insights and Forecast - by Type
- 7.1.1. Poultry
- 7.1.2. Beef
- 7.1.3. Pork
- 7.1.4. Other Organic Meats
- 7.2. Market Analysis, Insights and Forecast - by Distribution Channel
- 7.2.1. Hypermarkets and Supermarkets
- 7.2.2. Speciality Stores
- 7.2.3. Online Retailing
- 7.2.4. Retail and Departmental Stores
- 7.1. Market Analysis, Insights and Forecast - by Type
- 8. Asia Pacific Organic Beef Industry Analysis, Insights and Forecast, 2019-2031
- 8.1. Market Analysis, Insights and Forecast - by Type
- 8.1.1. Poultry
- 8.1.2. Beef
- 8.1.3. Pork
- 8.1.4. Other Organic Meats
- 8.2. Market Analysis, Insights and Forecast - by Distribution Channel
- 8.2.1. Hypermarkets and Supermarkets
- 8.2.2. Speciality Stores
- 8.2.3. Online Retailing
- 8.2.4. Retail and Departmental Stores
- 8.1. Market Analysis, Insights and Forecast - by Type
- 9. South America Organic Beef Industry Analysis, Insights and Forecast, 2019-2031
- 9.1. Market Analysis, Insights and Forecast - by Type
- 9.1.1. Poultry
- 9.1.2. Beef
- 9.1.3. Pork
- 9.1.4. Other Organic Meats
- 9.2. Market Analysis, Insights and Forecast - by Distribution Channel
- 9.2.1. Hypermarkets and Supermarkets
- 9.2.2. Speciality Stores
- 9.2.3. Online Retailing
- 9.2.4. Retail and Departmental Stores
- 9.1. Market Analysis, Insights and Forecast - by Type
- 10. Middle East and Africa Organic Beef Industry Analysis, Insights and Forecast, 2019-2031
- 10.1. Market Analysis, Insights and Forecast - by Type
- 10.1.1. Poultry
- 10.1.2. Beef
- 10.1.3. Pork
- 10.1.4. Other Organic Meats
- 10.2. Market Analysis, Insights and Forecast - by Distribution Channel
- 10.2.1. Hypermarkets and Supermarkets
- 10.2.2. Speciality Stores
- 10.2.3. Online Retailing
- 10.2.4. Retail and Departmental Stores
- 10.1. Market Analysis, Insights and Forecast - by Type
- 11. North America Organic Beef Industry Analysis, Insights and Forecast, 2019-2031
- 11.1. Market Analysis, Insights and Forecast - By Country/Sub-region
- 11.1.1 United States
- 11.1.2 Canada
- 11.1.3 Mexico
- 11.1.4 Rest of North America
- 12. Europe Organic Beef Industry Analysis, Insights and Forecast, 2019-2031
- 12.1. Market Analysis, Insights and Forecast - By Country/Sub-region
- 12.1.1 Germany
- 12.1.2 United Kingdom
- 12.1.3 France
- 12.1.4 Russia
- 12.1.5 Spain
- 12.1.6 Rest of Europe
- 13. Asia Pacific Organic Beef Industry Analysis, Insights and Forecast, 2019-2031
- 13.1. Market Analysis, Insights and Forecast - By Country/Sub-region
- 13.1.1 China
- 13.1.2 Japan
- 13.1.3 India
- 13.1.4 South Korea
- 13.1.5 Rest of Asia Pacific
- 14. South America Organic Beef Industry Analysis, Insights and Forecast, 2019-2031
- 14.1. Market Analysis, Insights and Forecast - By Country/Sub-region
- 14.1.1 Brazil
- 14.1.2 Argentina
- 14.1.3 Rest of South America
- 15. Middle East and Africa Organic Beef Industry Analysis, Insights and Forecast, 2019-2031
- 15.1. Market Analysis, Insights and Forecast - By Country/Sub-region
- 15.1.1 UAE
- 15.1.2 Saudi Arabia
- 15.1.3 South Africa
- 15.1.4 Egypt
- 15.1.5 Rest of Middle East and Africa
- 16. Competitive Analysis
- 16.1. Global Market Share Analysis 2024
- 16.2. Company Profiles
- 16.2.1 DuBreton
- 16.2.1.1. Overview
- 16.2.1.2. Products
- 16.2.1.3. SWOT Analysis
- 16.2.1.4. Recent Developments
- 16.2.1.5. Financials (Based on Availability)
- 16.2.2 Meyer Natural Foods
- 16.2.2.1. Overview
- 16.2.2.2. Products
- 16.2.2.3. SWOT Analysis
- 16.2.2.4. Recent Developments
- 16.2.2.5. Financials (Based on Availability)
- 16.2.3 Leverandørselskabet Danish Crown A m b a
- 16.2.3.1. Overview
- 16.2.3.2. Products
- 16.2.3.3. SWOT Analysis
- 16.2.3.4. Recent Developments
- 16.2.3.5. Financials (Based on Availability)
- 16.2.4 Tyson Foods Inc
- 16.2.4.1. Overview
- 16.2.4.2. Products
- 16.2.4.3. SWOT Analysis
- 16.2.4.4. Recent Developments
- 16.2.4.5. Financials (Based on Availability)
- 16.2.5 Perdue Farms Inc
- 16.2.5.1. Overview
- 16.2.5.2. Products
- 16.2.5.3. SWOT Analysis
- 16.2.5.4. Recent Developments
- 16.2.5.5. Financials (Based on Availability)
- 16.2.6 Foster Farms
- 16.2.6.1. Overview
- 16.2.6.2. Products
- 16.2.6.3. SWOT Analysis
- 16.2.6.4. Recent Developments
- 16.2.6.5. Financials (Based on Availability)
- 16.2.7 Eversfield Organic
- 16.2.7.1. Overview
- 16.2.7.2. Products
- 16.2.7.3. SWOT Analysis
- 16.2.7.4. Recent Developments
- 16.2.7.5. Financials (Based on Availability)
- 16.2.8 Verde Farms
- 16.2.8.1. Overview
- 16.2.8.2. Products
- 16.2.8.3. SWOT Analysis
- 16.2.8.4. Recent Developments
- 16.2.8.5. Financials (Based on Availability)
- 16.2.9 Swellington Organic Farm
- 16.2.9.1. Overview
- 16.2.9.2. Products
- 16.2.9.3. SWOT Analysis
- 16.2.9.4. Recent Developments
- 16.2.9.5. Financials (Based on Availability)
- 16.2.10 JBS SA
- 16.2.10.1. Overview
- 16.2.10.2. Products
- 16.2.10.3. SWOT Analysis
- 16.2.10.4. Recent Developments
- 16.2.10.5. Financials (Based on Availability)
- 16.2.1 DuBreton
List of Figures
- Figure 1: Global Organic Beef Industry Revenue Breakdown (Million, %) by Region 2024 & 2032
- Figure 2: Global Organic Beef Industry Volume Breakdown (K Tons, %) by Region 2024 & 2032
- Figure 3: North America Organic Beef Industry Revenue (Million), by Country 2024 & 2032
- Figure 4: North America Organic Beef Industry Volume (K Tons), by Country 2024 & 2032
- Figure 5: North America Organic Beef Industry Revenue Share (%), by Country 2024 & 2032
- Figure 6: North America Organic Beef Industry Volume Share (%), by Country 2024 & 2032
- Figure 7: Europe Organic Beef Industry Revenue (Million), by Country 2024 & 2032
- Figure 8: Europe Organic Beef Industry Volume (K Tons), by Country 2024 & 2032
- Figure 9: Europe Organic Beef Industry Revenue Share (%), by Country 2024 & 2032
- Figure 10: Europe Organic Beef Industry Volume Share (%), by Country 2024 & 2032
- Figure 11: Asia Pacific Organic Beef Industry Revenue (Million), by Country 2024 & 2032
- Figure 12: Asia Pacific Organic Beef Industry Volume (K Tons), by Country 2024 & 2032
- Figure 13: Asia Pacific Organic Beef Industry Revenue Share (%), by Country 2024 & 2032
- Figure 14: Asia Pacific Organic Beef Industry Volume Share (%), by Country 2024 & 2032
- Figure 15: South America Organic Beef Industry Revenue (Million), by Country 2024 & 2032
- Figure 16: South America Organic Beef Industry Volume (K Tons), by Country 2024 & 2032
- Figure 17: South America Organic Beef Industry Revenue Share (%), by Country 2024 & 2032
- Figure 18: South America Organic Beef Industry Volume Share (%), by Country 2024 & 2032
- Figure 19: Middle East and Africa Organic Beef Industry Revenue (Million), by Country 2024 & 2032
- Figure 20: Middle East and Africa Organic Beef Industry Volume (K Tons), by Country 2024 & 2032
- Figure 21: Middle East and Africa Organic Beef Industry Revenue Share (%), by Country 2024 & 2032
- Figure 22: Middle East and Africa Organic Beef Industry Volume Share (%), by Country 2024 & 2032
- Figure 23: North America Organic Beef Industry Revenue (Million), by Type 2024 & 2032
- Figure 24: North America Organic Beef Industry Volume (K Tons), by Type 2024 & 2032
- Figure 25: North America Organic Beef Industry Revenue Share (%), by Type 2024 & 2032
- Figure 26: North America Organic Beef Industry Volume Share (%), by Type 2024 & 2032
- Figure 27: North America Organic Beef Industry Revenue (Million), by Distribution Channel 2024 & 2032
- Figure 28: North America Organic Beef Industry Volume (K Tons), by Distribution Channel 2024 & 2032
- Figure 29: North America Organic Beef Industry Revenue Share (%), by Distribution Channel 2024 & 2032
- Figure 30: North America Organic Beef Industry Volume Share (%), by Distribution Channel 2024 & 2032
- Figure 31: North America Organic Beef Industry Revenue (Million), by Country 2024 & 2032
- Figure 32: North America Organic Beef Industry Volume (K Tons), by Country 2024 & 2032
- Figure 33: North America Organic Beef Industry Revenue Share (%), by Country 2024 & 2032
- Figure 34: North America Organic Beef Industry Volume Share (%), by Country 2024 & 2032
- Figure 35: Europe Organic Beef Industry Revenue (Million), by Type 2024 & 2032
- Figure 36: Europe Organic Beef Industry Volume (K Tons), by Type 2024 & 2032
- Figure 37: Europe Organic Beef Industry Revenue Share (%), by Type 2024 & 2032
- Figure 38: Europe Organic Beef Industry Volume Share (%), by Type 2024 & 2032
- Figure 39: Europe Organic Beef Industry Revenue (Million), by Distribution Channel 2024 & 2032
- Figure 40: Europe Organic Beef Industry Volume (K Tons), by Distribution Channel 2024 & 2032
- Figure 41: Europe Organic Beef Industry Revenue Share (%), by Distribution Channel 2024 & 2032
- Figure 42: Europe Organic Beef Industry Volume Share (%), by Distribution Channel 2024 & 2032
- Figure 43: Europe Organic Beef Industry Revenue (Million), by Country 2024 & 2032
- Figure 44: Europe Organic Beef Industry Volume (K Tons), by Country 2024 & 2032
- Figure 45: Europe Organic Beef Industry Revenue Share (%), by Country 2024 & 2032
- Figure 46: Europe Organic Beef Industry Volume Share (%), by Country 2024 & 2032
- Figure 47: Asia Pacific Organic Beef Industry Revenue (Million), by Type 2024 & 2032
- Figure 48: Asia Pacific Organic Beef Industry Volume (K Tons), by Type 2024 & 2032
- Figure 49: Asia Pacific Organic Beef Industry Revenue Share (%), by Type 2024 & 2032
- Figure 50: Asia Pacific Organic Beef Industry Volume Share (%), by Type 2024 & 2032
- Figure 51: Asia Pacific Organic Beef Industry Revenue (Million), by Distribution Channel 2024 & 2032
- Figure 52: Asia Pacific Organic Beef Industry Volume (K Tons), by Distribution Channel 2024 & 2032
- Figure 53: Asia Pacific Organic Beef Industry Revenue Share (%), by Distribution Channel 2024 & 2032
- Figure 54: Asia Pacific Organic Beef Industry Volume Share (%), by Distribution Channel 2024 & 2032
- Figure 55: Asia Pacific Organic Beef Industry Revenue (Million), by Country 2024 & 2032
- Figure 56: Asia Pacific Organic Beef Industry Volume (K Tons), by Country 2024 & 2032
- Figure 57: Asia Pacific Organic Beef Industry Revenue Share (%), by Country 2024 & 2032
- Figure 58: Asia Pacific Organic Beef Industry Volume Share (%), by Country 2024 & 2032
- Figure 59: South America Organic Beef Industry Revenue (Million), by Type 2024 & 2032
- Figure 60: South America Organic Beef Industry Volume (K Tons), by Type 2024 & 2032
- Figure 61: South America Organic Beef Industry Revenue Share (%), by Type 2024 & 2032
- Figure 62: South America Organic Beef Industry Volume Share (%), by Type 2024 & 2032
- Figure 63: South America Organic Beef Industry Revenue (Million), by Distribution Channel 2024 & 2032
- Figure 64: South America Organic Beef Industry Volume (K Tons), by Distribution Channel 2024 & 2032
- Figure 65: South America Organic Beef Industry Revenue Share (%), by Distribution Channel 2024 & 2032
- Figure 66: South America Organic Beef Industry Volume Share (%), by Distribution Channel 2024 & 2032
- Figure 67: South America Organic Beef Industry Revenue (Million), by Country 2024 & 2032
- Figure 68: South America Organic Beef Industry Volume (K Tons), by Country 2024 & 2032
- Figure 69: South America Organic Beef Industry Revenue Share (%), by Country 2024 & 2032
- Figure 70: South America Organic Beef Industry Volume Share (%), by Country 2024 & 2032
- Figure 71: Middle East and Africa Organic Beef Industry Revenue (Million), by Type 2024 & 2032
- Figure 72: Middle East and Africa Organic Beef Industry Volume (K Tons), by Type 2024 & 2032
- Figure 73: Middle East and Africa Organic Beef Industry Revenue Share (%), by Type 2024 & 2032
- Figure 74: Middle East and Africa Organic Beef Industry Volume Share (%), by Type 2024 & 2032
- Figure 75: Middle East and Africa Organic Beef Industry Revenue (Million), by Distribution Channel 2024 & 2032
- Figure 76: Middle East and Africa Organic Beef Industry Volume (K Tons), by Distribution Channel 2024 & 2032
- Figure 77: Middle East and Africa Organic Beef Industry Revenue Share (%), by Distribution Channel 2024 & 2032
- Figure 78: Middle East and Africa Organic Beef Industry Volume Share (%), by Distribution Channel 2024 & 2032
- Figure 79: Middle East and Africa Organic Beef Industry Revenue (Million), by Country 2024 & 2032
- Figure 80: Middle East and Africa Organic Beef Industry Volume (K Tons), by Country 2024 & 2032
- Figure 81: Middle East and Africa Organic Beef Industry Revenue Share (%), by Country 2024 & 2032
- Figure 82: Middle East and Africa Organic Beef Industry Volume Share (%), by Country 2024 & 2032
List of Tables
- Table 1: Global Organic Beef Industry Revenue Million Forecast, by Region 2019 & 2032
- Table 2: Global Organic Beef Industry Volume K Tons Forecast, by Region 2019 & 2032
- Table 3: Global Organic Beef Industry Revenue Million Forecast, by Type 2019 & 2032
- Table 4: Global Organic Beef Industry Volume K Tons Forecast, by Type 2019 & 2032
- Table 5: Global Organic Beef Industry Revenue Million Forecast, by Distribution Channel 2019 & 2032
- Table 6: Global Organic Beef Industry Volume K Tons Forecast, by Distribution Channel 2019 & 2032
- Table 7: Global Organic Beef Industry Revenue Million Forecast, by Region 2019 & 2032
- Table 8: Global Organic Beef Industry Volume K Tons Forecast, by Region 2019 & 2032
- Table 9: Global Organic Beef Industry Revenue Million Forecast, by Country 2019 & 2032
- Table 10: Global Organic Beef Industry Volume K Tons Forecast, by Country 2019 & 2032
- Table 11: United States Organic Beef Industry Revenue (Million) Forecast, by Application 2019 & 2032
- Table 12: United States Organic Beef Industry Volume (K Tons) Forecast, by Application 2019 & 2032
- Table 13: Canada Organic Beef Industry Revenue (Million) Forecast, by Application 2019 & 2032
- Table 14: Canada Organic Beef Industry Volume (K Tons) Forecast, by Application 2019 & 2032
- Table 15: Mexico Organic Beef Industry Revenue (Million) Forecast, by Application 2019 & 2032
- Table 16: Mexico Organic Beef Industry Volume (K Tons) Forecast, by Application 2019 & 2032
- Table 17: Rest of North America Organic Beef Industry Revenue (Million) Forecast, by Application 2019 & 2032
- Table 18: Rest of North America Organic Beef Industry Volume (K Tons) Forecast, by Application 2019 & 2032
- Table 19: Global Organic Beef Industry Revenue Million Forecast, by Country 2019 & 2032
- Table 20: Global Organic Beef Industry Volume K Tons Forecast, by Country 2019 & 2032
- Table 21: Germany Organic Beef Industry Revenue (Million) Forecast, by Application 2019 & 2032
- Table 22: Germany Organic Beef Industry Volume (K Tons) Forecast, by Application 2019 & 2032
- Table 23: United Kingdom Organic Beef Industry Revenue (Million) Forecast, by Application 2019 & 2032
- Table 24: United Kingdom Organic Beef Industry Volume (K Tons) Forecast, by Application 2019 & 2032
- Table 25: France Organic Beef Industry Revenue (Million) Forecast, by Application 2019 & 2032
- Table 26: France Organic Beef Industry Volume (K Tons) Forecast, by Application 2019 & 2032
- Table 27: Russia Organic Beef Industry Revenue (Million) Forecast, by Application 2019 & 2032
- Table 28: Russia Organic Beef Industry Volume (K Tons) Forecast, by Application 2019 & 2032
- Table 29: Spain Organic Beef Industry Revenue (Million) Forecast, by Application 2019 & 2032
- Table 30: Spain Organic Beef Industry Volume (K Tons) Forecast, by Application 2019 & 2032
- Table 31: Rest of Europe Organic Beef Industry Revenue (Million) Forecast, by Application 2019 & 2032
- Table 32: Rest of Europe Organic Beef Industry Volume (K Tons) Forecast, by Application 2019 & 2032
- Table 33: Global Organic Beef Industry Revenue Million Forecast, by Country 2019 & 2032
- Table 34: Global Organic Beef Industry Volume K Tons Forecast, by Country 2019 & 2032
- Table 35: China Organic Beef Industry Revenue (Million) Forecast, by Application 2019 & 2032
- Table 36: China Organic Beef Industry Volume (K Tons) Forecast, by Application 2019 & 2032
- Table 37: Japan Organic Beef Industry Revenue (Million) Forecast, by Application 2019 & 2032
- Table 38: Japan Organic Beef Industry Volume (K Tons) Forecast, by Application 2019 & 2032
- Table 39: India Organic Beef Industry Revenue (Million) Forecast, by Application 2019 & 2032
- Table 40: India Organic Beef Industry Volume (K Tons) Forecast, by Application 2019 & 2032
- Table 41: South Korea Organic Beef Industry Revenue (Million) Forecast, by Application 2019 & 2032
- Table 42: South Korea Organic Beef Industry Volume (K Tons) Forecast, by Application 2019 & 2032
- Table 43: Rest of Asia Pacific Organic Beef Industry Revenue (Million) Forecast, by Application 2019 & 2032
- Table 44: Rest of Asia Pacific Organic Beef Industry Volume (K Tons) Forecast, by Application 2019 & 2032
- Table 45: Global Organic Beef Industry Revenue Million Forecast, by Country 2019 & 2032
- Table 46: Global Organic Beef Industry Volume K Tons Forecast, by Country 2019 & 2032
- Table 47: Brazil Organic Beef Industry Revenue (Million) Forecast, by Application 2019 & 2032
- Table 48: Brazil Organic Beef Industry Volume (K Tons) Forecast, by Application 2019 & 2032
- Table 49: Argentina Organic Beef Industry Revenue (Million) Forecast, by Application 2019 & 2032
- Table 50: Argentina Organic Beef Industry Volume (K Tons) Forecast, by Application 2019 & 2032
- Table 51: Rest of South America Organic Beef Industry Revenue (Million) Forecast, by Application 2019 & 2032
- Table 52: Rest of South America Organic Beef Industry Volume (K Tons) Forecast, by Application 2019 & 2032
- Table 53: Global Organic Beef Industry Revenue Million Forecast, by Country 2019 & 2032
- Table 54: Global Organic Beef Industry Volume K Tons Forecast, by Country 2019 & 2032
- Table 55: UAE Organic Beef Industry Revenue (Million) Forecast, by Application 2019 & 2032
- Table 56: UAE Organic Beef Industry Volume (K Tons) Forecast, by Application 2019 & 2032
- Table 57: Saudi Arabia Organic Beef Industry Revenue (Million) Forecast, by Application 2019 & 2032
- Table 58: Saudi Arabia Organic Beef Industry Volume (K Tons) Forecast, by Application 2019 & 2032
- Table 59: South Africa Organic Beef Industry Revenue (Million) Forecast, by Application 2019 & 2032
- Table 60: South Africa Organic Beef Industry Volume (K Tons) Forecast, by Application 2019 & 2032
- Table 61: Egypt Organic Beef Industry Revenue (Million) Forecast, by Application 2019 & 2032
- Table 62: Egypt Organic Beef Industry Volume (K Tons) Forecast, by Application 2019 & 2032
- Table 63: Rest of Middle East and Africa Organic Beef Industry Revenue (Million) Forecast, by Application 2019 & 2032
- Table 64: Rest of Middle East and Africa Organic Beef Industry Volume (K Tons) Forecast, by Application 2019 & 2032
- Table 65: Global Organic Beef Industry Revenue Million Forecast, by Type 2019 & 2032
- Table 66: Global Organic Beef Industry Volume K Tons Forecast, by Type 2019 & 2032
- Table 67: Global Organic Beef Industry Revenue Million Forecast, by Distribution Channel 2019 & 2032
- Table 68: Global Organic Beef Industry Volume K Tons Forecast, by Distribution Channel 2019 & 2032
- Table 69: Global Organic Beef Industry Revenue Million Forecast, by Country 2019 & 2032
- Table 70: Global Organic Beef Industry Volume K Tons Forecast, by Country 2019 & 2032
- Table 71: United States Organic Beef Industry Revenue (Million) Forecast, by Application 2019 & 2032
- Table 72: United States Organic Beef Industry Volume (K Tons) Forecast, by Application 2019 & 2032
- Table 73: Canada Organic Beef Industry Revenue (Million) Forecast, by Application 2019 & 2032
- Table 74: Canada Organic Beef Industry Volume (K Tons) Forecast, by Application 2019 & 2032
- Table 75: Mexico Organic Beef Industry Revenue (Million) Forecast, by Application 2019 & 2032
- Table 76: Mexico Organic Beef Industry Volume (K Tons) Forecast, by Application 2019 & 2032
- Table 77: Rest of North America Organic Beef Industry Revenue (Million) Forecast, by Application 2019 & 2032
- Table 78: Rest of North America Organic Beef Industry Volume (K Tons) Forecast, by Application 2019 & 2032
- Table 79: Global Organic Beef Industry Revenue Million Forecast, by Type 2019 & 2032
- Table 80: Global Organic Beef Industry Volume K Tons Forecast, by Type 2019 & 2032
- Table 81: Global Organic Beef Industry Revenue Million Forecast, by Distribution Channel 2019 & 2032
- Table 82: Global Organic Beef Industry Volume K Tons Forecast, by Distribution Channel 2019 & 2032
- Table 83: Global Organic Beef Industry Revenue Million Forecast, by Country 2019 & 2032
- Table 84: Global Organic Beef Industry Volume K Tons Forecast, by Country 2019 & 2032
- Table 85: Germany Organic Beef Industry Revenue (Million) Forecast, by Application 2019 & 2032
- Table 86: Germany Organic Beef Industry Volume (K Tons) Forecast, by Application 2019 & 2032
- Table 87: United Kingdom Organic Beef Industry Revenue (Million) Forecast, by Application 2019 & 2032
- Table 88: United Kingdom Organic Beef Industry Volume (K Tons) Forecast, by Application 2019 & 2032
- Table 89: France Organic Beef Industry Revenue (Million) Forecast, by Application 2019 & 2032
- Table 90: France Organic Beef Industry Volume (K Tons) Forecast, by Application 2019 & 2032
- Table 91: Russia Organic Beef Industry Revenue (Million) Forecast, by Application 2019 & 2032
- Table 92: Russia Organic Beef Industry Volume (K Tons) Forecast, by Application 2019 & 2032
- Table 93: Spain Organic Beef Industry Revenue (Million) Forecast, by Application 2019 & 2032
- Table 94: Spain Organic Beef Industry Volume (K Tons) Forecast, by Application 2019 & 2032
- Table 95: Rest of Europe Organic Beef Industry Revenue (Million) Forecast, by Application 2019 & 2032
- Table 96: Rest of Europe Organic Beef Industry Volume (K Tons) Forecast, by Application 2019 & 2032
- Table 97: Global Organic Beef Industry Revenue Million Forecast, by Type 2019 & 2032
- Table 98: Global Organic Beef Industry Volume K Tons Forecast, by Type 2019 & 2032
- Table 99: Global Organic Beef Industry Revenue Million Forecast, by Distribution Channel 2019 & 2032
- Table 100: Global Organic Beef Industry Volume K Tons Forecast, by Distribution Channel 2019 & 2032
- Table 101: Global Organic Beef Industry Revenue Million Forecast, by Country 2019 & 2032
- Table 102: Global Organic Beef Industry Volume K Tons Forecast, by Country 2019 & 2032
- Table 103: China Organic Beef Industry Revenue (Million) Forecast, by Application 2019 & 2032
- Table 104: China Organic Beef Industry Volume (K Tons) Forecast, by Application 2019 & 2032
- Table 105: Japan Organic Beef Industry Revenue (Million) Forecast, by Application 2019 & 2032
- Table 106: Japan Organic Beef Industry Volume (K Tons) Forecast, by Application 2019 & 2032
- Table 107: India Organic Beef Industry Revenue (Million) Forecast, by Application 2019 & 2032
- Table 108: India Organic Beef Industry Volume (K Tons) Forecast, by Application 2019 & 2032
- Table 109: South Korea Organic Beef Industry Revenue (Million) Forecast, by Application 2019 & 2032
- Table 110: South Korea Organic Beef Industry Volume (K Tons) Forecast, by Application 2019 & 2032
- Table 111: Rest of Asia Pacific Organic Beef Industry Revenue (Million) Forecast, by Application 2019 & 2032
- Table 112: Rest of Asia Pacific Organic Beef Industry Volume (K Tons) Forecast, by Application 2019 & 2032
- Table 113: Global Organic Beef Industry Revenue Million Forecast, by Type 2019 & 2032
- Table 114: Global Organic Beef Industry Volume K Tons Forecast, by Type 2019 & 2032
- Table 115: Global Organic Beef Industry Revenue Million Forecast, by Distribution Channel 2019 & 2032
- Table 116: Global Organic Beef Industry Volume K Tons Forecast, by Distribution Channel 2019 & 2032
- Table 117: Global Organic Beef Industry Revenue Million Forecast, by Country 2019 & 2032
- Table 118: Global Organic Beef Industry Volume K Tons Forecast, by Country 2019 & 2032
- Table 119: Brazil Organic Beef Industry Revenue (Million) Forecast, by Application 2019 & 2032
- Table 120: Brazil Organic Beef Industry Volume (K Tons) Forecast, by Application 2019 & 2032
- Table 121: Argentina Organic Beef Industry Revenue (Million) Forecast, by Application 2019 & 2032
- Table 122: Argentina Organic Beef Industry Volume (K Tons) Forecast, by Application 2019 & 2032
- Table 123: Rest of South America Organic Beef Industry Revenue (Million) Forecast, by Application 2019 & 2032
- Table 124: Rest of South America Organic Beef Industry Volume (K Tons) Forecast, by Application 2019 & 2032
- Table 125: Global Organic Beef Industry Revenue Million Forecast, by Type 2019 & 2032
- Table 126: Global Organic Beef Industry Volume K Tons Forecast, by Type 2019 & 2032
- Table 127: Global Organic Beef Industry Revenue Million Forecast, by Distribution Channel 2019 & 2032
- Table 128: Global Organic Beef Industry Volume K Tons Forecast, by Distribution Channel 2019 & 2032
- Table 129: Global Organic Beef Industry Revenue Million Forecast, by Country 2019 & 2032
- Table 130: Global Organic Beef Industry Volume K Tons Forecast, by Country 2019 & 2032
- Table 131: UAE Organic Beef Industry Revenue (Million) Forecast, by Application 2019 & 2032
- Table 132: UAE Organic Beef Industry Volume (K Tons) Forecast, by Application 2019 & 2032
- Table 133: Saudi Arabia Organic Beef Industry Revenue (Million) Forecast, by Application 2019 & 2032
- Table 134: Saudi Arabia Organic Beef Industry Volume (K Tons) Forecast, by Application 2019 & 2032
- Table 135: South Africa Organic Beef Industry Revenue (Million) Forecast, by Application 2019 & 2032
- Table 136: South Africa Organic Beef Industry Volume (K Tons) Forecast, by Application 2019 & 2032
- Table 137: Egypt Organic Beef Industry Revenue (Million) Forecast, by Application 2019 & 2032
- Table 138: Egypt Organic Beef Industry Volume (K Tons) Forecast, by Application 2019 & 2032
- Table 139: Rest of Middle East and Africa Organic Beef Industry Revenue (Million) Forecast, by Application 2019 & 2032
- Table 140: Rest of Middle East and Africa Organic Beef Industry Volume (K Tons) Forecast, by Application 2019 & 2032
Frequently Asked Questions
1. What is the projected Compound Annual Growth Rate (CAGR) of the Organic Beef Industry?
The projected CAGR is approximately 7.94%.
2. Which companies are prominent players in the Organic Beef Industry?
Key companies in the market include DuBreton, Meyer Natural Foods, Leverandørselskabet Danish Crown A m b a, Tyson Foods Inc, Perdue Farms Inc, Foster Farms, Eversfield Organic, Verde Farms, Swellington Organic Farm, JBS SA.
3. What are the main segments of the Organic Beef Industry?
The market segments include Type, Distribution Channel.
4. Can you provide details about the market size?
The market size is estimated to be USD 20.27 Million as of 2022.
5. What are some drivers contributing to market growth?
Increased Health Awareness; Increased availability of organic beef.
6. What are the notable trends driving market growth?
Growing trend towards offering a variety of organic beef products.
7. Are there any restraints impacting market growth?
Organic beef is often more expensive than conventionally produced beef.
8. Can you provide examples of recent developments in the market?
N/A
9. What pricing options are available for accessing the report?
Pricing options include single-user, multi-user, and enterprise licenses priced at USD 4750, USD 5250, and USD 8750 respectively.
10. Is the market size provided in terms of value or volume?
The market size is provided in terms of value, measured in Million and volume, measured in K Tons.
11. Are there any specific market keywords associated with the report?
Yes, the market keyword associated with the report is "Organic Beef Industry," which aids in identifying and referencing the specific market segment covered.
12. How do I determine which pricing option suits my needs best?
The pricing options vary based on user requirements and access needs. Individual users may opt for single-user licenses, while businesses requiring broader access may choose multi-user or enterprise licenses for cost-effective access to the report.
13. Are there any additional resources or data provided in the Organic Beef Industry report?
While the report offers comprehensive insights, it's advisable to review the specific contents or supplementary materials provided to ascertain if additional resources or data are available.
14. How can I stay updated on further developments or reports in the Organic Beef Industry?
To stay informed about further developments, trends, and reports in the Organic Beef Industry, consider subscribing to industry newsletters, following relevant companies and organizations, or regularly checking reputable industry news sources and publications.
Methodology
Step 1 - Identification of Relevant Samples Size from Population Database


Step 2 - Approaches for Defining Global Market Size (Value, Volume* & Price*)

Note*: In applicable scenarios
Step 3 - Data Sources
Primary Research
- Web Analytics
- Survey Reports
- Research Institute
- Latest Research Reports
- Opinion Leaders
Secondary Research
- Annual Reports
- White Paper
- Latest Press Release
- Industry Association
- Paid Database
- Investor Presentations

Step 4 - Data Triangulation
Involves using different sources of information in order to increase the validity of a study
These sources are likely to be stakeholders in a program - participants, other researchers, program staff, other community members, and so on.
Then we put all data in single framework & apply various statistical tools to find out the dynamic on the market.
During the analysis stage, feedback from the stakeholder groups would be compared to determine areas of agreement as well as areas of divergence
