

Key Insights
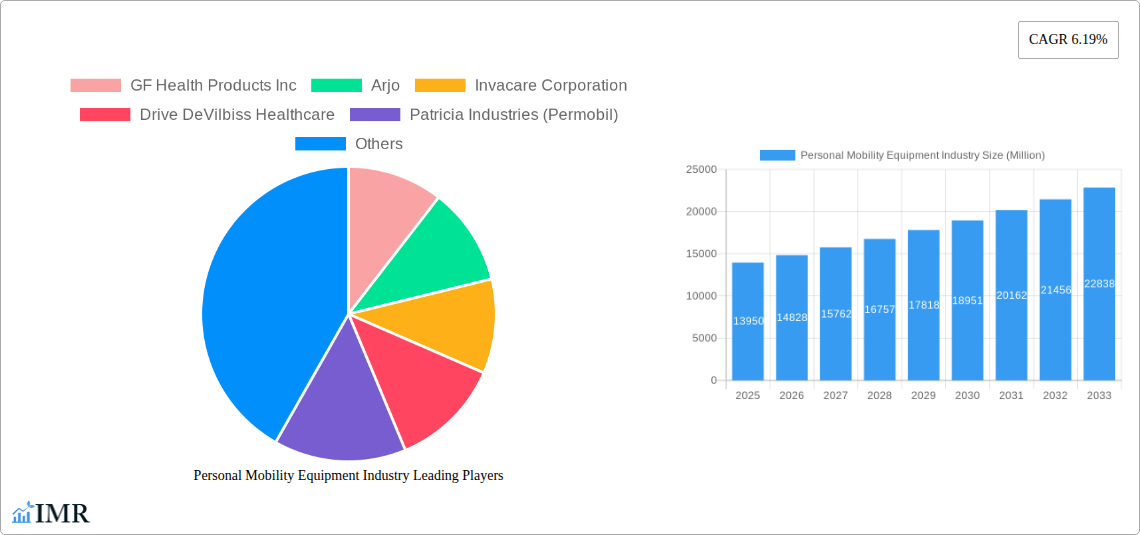
The global Personal Mobility Equipment (PME) market, valued at $13.95 billion in 2025, is projected to experience robust growth, driven by a rising aging population, increasing prevalence of chronic diseases like arthritis and stroke leading to mobility impairments, and growing awareness of assistive technologies. The market's Compound Annual Growth Rate (CAGR) of 6.19% from 2019 to 2024 indicates a steady expansion, expected to continue through 2033. Key drivers include advancements in PME technology, resulting in lighter, more durable, and technologically advanced products like smart wheelchairs and powered mobility scooters. Furthermore, increasing government initiatives promoting accessibility and supportive healthcare policies contribute significantly to market growth. The market is segmented by product type (wheelchairs, walking aids, scooters, and other products) and end-user (hospitals and clinics, home care settings, and other end-users). Wheelchairs constitute a significant portion of the market, followed by walking aids and scooters, reflecting the diverse needs of the target population. The North American and European markets currently dominate, driven by higher disposable incomes and advanced healthcare infrastructure, but Asia Pacific is projected to show substantial growth due to its rapidly expanding elderly population and increasing healthcare expenditure. Competition is fierce among major players, with established companies like Invacare Corporation and Sunrise Medical alongside newer entrants continually innovating to cater to the evolving demands of the market.
The restraints on market growth include the high cost of advanced PME, particularly power-assisted devices, potentially limiting access for lower-income individuals. Furthermore, the lack of awareness regarding available technologies and insufficient rehabilitation services in some regions might hinder market penetration. However, the overall outlook remains positive, with technological advancements, increasing accessibility initiatives, and rising healthcare spending expected to mitigate these challenges. The forecast period (2025-2033) promises continued expansion, driven by demographic shifts and the ongoing development of innovative, user-friendly PME solutions. The market's future hinges on successfully addressing affordability and accessibility issues while continuing to meet the diverse mobility needs of individuals across various age groups and health conditions.
This comprehensive report provides a detailed analysis of the Personal Mobility Equipment (PME) industry, encompassing market size, growth trends, competitive landscape, and future outlook. The study period covers 2019-2033, with 2025 as the base and estimated year. This report is invaluable for industry professionals, investors, and strategic decision-makers seeking to understand and capitalize on opportunities within this dynamic market. We delve into the parent market of Medical Equipment and the child market of Personal Mobility aids to provide a complete overview.
Personal Mobility Equipment Industry Market Dynamics & Structure
The PME market is characterized by moderate concentration, with several key players holding significant market share. Technological innovation, particularly in areas like lightweight materials, smart features, and advanced propulsion systems, is a key driver. Regulatory frameworks concerning safety standards and accessibility vary across regions, impacting market access and growth. Competitive substitutes, such as assistive robotics and adaptive technologies, are emerging, although their market penetration remains relatively low. The end-user demographic is primarily aging populations and individuals with disabilities, showing significant growth globally. The industry has witnessed a moderate level of M&A activity, with strategic acquisitions aimed at expanding product portfolios and geographical reach.
- Market Concentration: Moderately concentrated, with top 10 players holding approximately xx% market share in 2025.
- Technological Innovation: Focus on lightweight materials, smart features (e.g., GPS tracking, app connectivity), and advanced propulsion systems.
- Regulatory Framework: Varies significantly across regions, influencing product approvals and market access.
- Competitive Substitutes: Emerging technologies like assistive robotics pose a long-term competitive threat (estimated 5% market share by 2033).
- End-User Demographics: Driven by aging population and increasing prevalence of chronic diseases leading to disability.
- M&A Trends: Moderate activity, primarily focused on strategic acquisitions to expand product lines and geographic reach. Estimated xx M&A deals in the past 5 years.
Personal Mobility Equipment Industry Growth Trends & Insights
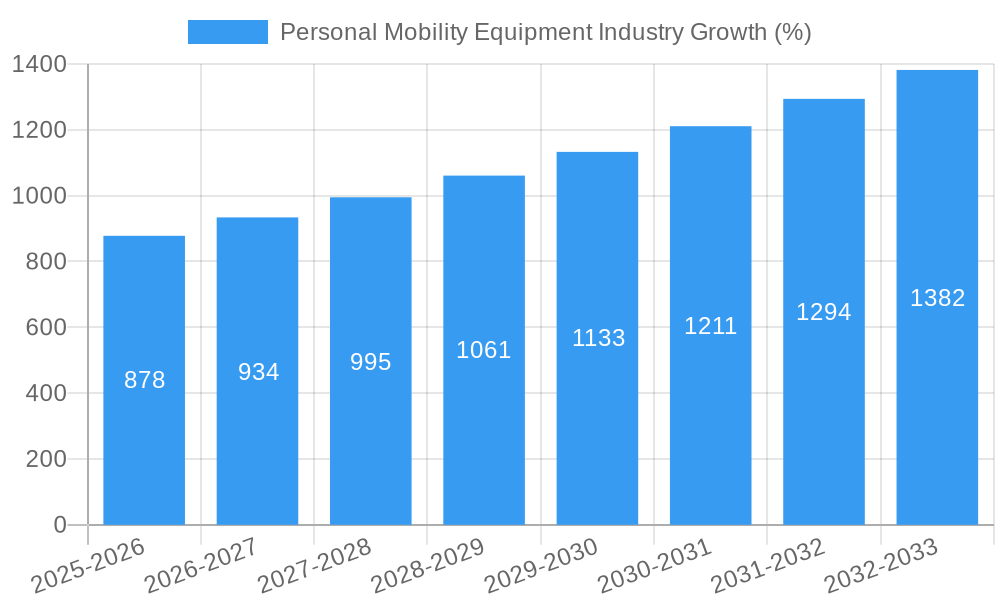
The global PME market is experiencing robust growth, driven by factors such as an aging population, rising healthcare expenditure, and increasing awareness about accessibility. Market size is projected to reach xx million units by 2025 and xx million units by 2033, exhibiting a CAGR of xx% during the forecast period. Adoption rates vary across product categories and regions, with wheelchairs maintaining the largest market share. Technological disruptions, such as the introduction of smart mobility aids and advanced assistive robotics, are reshaping the market landscape. Consumer behavior shifts towards preference for lightweight, easy-to-use, and technologically advanced products are evident.
Dominant Regions, Countries, or Segments in Personal Mobility Equipment Industry
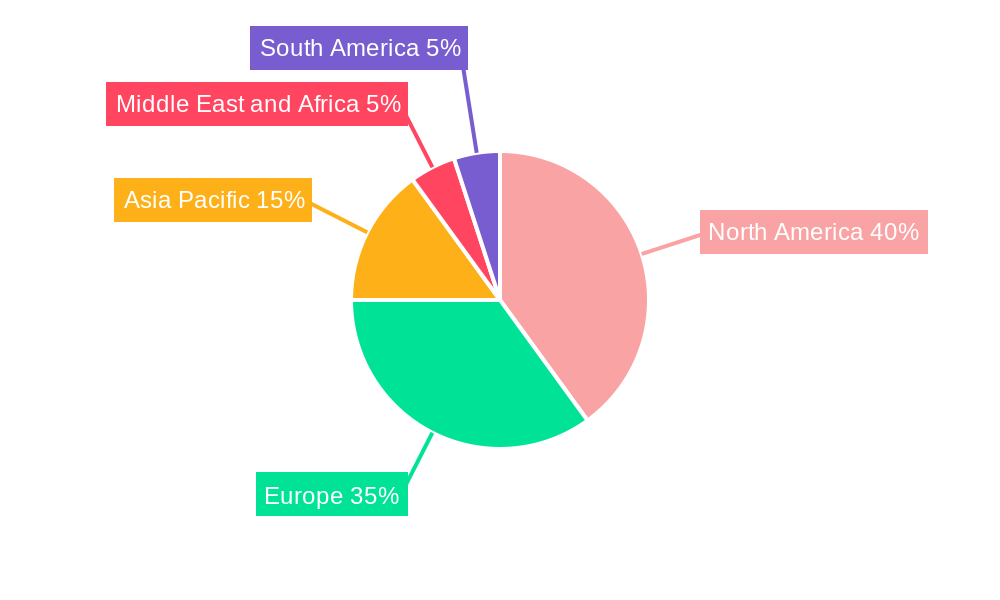
North America and Europe currently dominate the PME market, driven by high healthcare expenditure, strong regulatory support, and a significant aging population. However, Asia-Pacific is expected to witness the fastest growth during the forecast period due to rising disposable incomes, improving healthcare infrastructure, and a rapidly expanding elderly population. Within product segments, wheelchairs hold the largest market share, followed by walking aids and scooters. The home care setting is the dominant end-user segment, reflecting the increasing preference for in-home care solutions.
- North America: High market share driven by high healthcare expenditure and aging population.
- Europe: Strong market due to robust regulatory support and advanced healthcare infrastructure.
- Asia-Pacific: Fastest-growing region, fueled by rising disposable income and expanding elderly population.
- Product Segments: Wheelchairs (xx million units in 2025), Walking aids (xx million units in 2025), Scooters (xx million units in 2025), Other Products (xx million units in 2025).
- End-User Segments: Home Care Settings (xx million units in 2025), Hospitals and Clinics (xx million units in 2025), Other End Users (xx million units in 2025).
Personal Mobility Equipment Industry Product Landscape
The PME market offers a diverse range of products, from traditional manual wheelchairs to advanced electric power chairs with smart features. Innovations focus on enhancing comfort, maneuverability, and user-friendliness. Lightweight materials, advanced braking systems, and integrated technologies such as GPS tracking and app connectivity are key selling points. Performance metrics such as speed, range, and battery life are crucial factors influencing consumer choices.
Key Drivers, Barriers & Challenges in Personal Mobility Equipment Industry
Key Drivers: Aging global population, rising healthcare expenditure, technological advancements, increasing awareness of accessibility needs, supportive government policies and initiatives.
Challenges: High manufacturing costs, stringent regulatory approvals, intense competition, supply chain disruptions, and ensuring affordability. The impact of supply chain disruptions on manufacturing lead times has been estimated at xx% in 2024.
Emerging Opportunities in Personal Mobility Equipment Industry
Emerging opportunities include the development of smart mobility aids with integrated health monitoring capabilities, expansion into untapped markets in developing countries, growth of the rental market for mobility equipment, and personalized mobility solutions tailored to individual needs. The integration of AI and IoT technologies in PME also presents significant opportunities for future growth.
Growth Accelerators in the Personal Mobility Equipment Industry Industry
Long-term growth is driven by technological innovation, strategic partnerships between manufacturers and healthcare providers, and market expansion into underserved regions. Investment in R&D, focusing on advanced materials and assistive technologies, and collaboration with healthcare professionals to adapt products to individual needs are essential for sustained growth.
Key Players Shaping the Personal Mobility Equipment Industry Market
- GF Health Products Inc
- Arjo
- Invacare Corporation
- Drive DeVilbiss Healthcare
- Patricia Industries (Permobil)
- Rollz International
- Kaye Products Inc
- Ottobock
- Stryker Corporation
- Performance Health
- Pride Mobility Products Corp
- Medline Industries Inc
- Sunrise Medical (US) LLC
Notable Milestones in Personal Mobility Equipment Industry Sector
- August 2021: Falcon Mobility launches the Ultra-Lite 2 electric wheelchair, emphasizing affordability and lightweight design.
- July 2021: IATA forms a Global Mobility Aids Action Group to improve the transportation of mobility aids.
In-Depth Personal Mobility Equipment Industry Market Outlook
The PME market is poised for continued growth, driven by demographic trends, technological advancements, and rising healthcare spending. Strategic partnerships, focusing on innovative product development and market expansion, will be crucial for success. The integration of smart technologies and personalized solutions will further enhance market potential, creating new opportunities for growth and innovation.
Personal Mobility Equipment Industry Segmentation
-
1. Product
- 1.1. Wheelchair
- 1.2. Walking Aids
- 1.3. Scooters
- 1.4. Other Products
-
2. End User
- 2.1. Hospitals and Clinics
- 2.2. Home Care Settings
- 2.3. Other End Users
Personal Mobility Equipment Industry Segmentation By Geography
-
1. North America
- 1.1. United States
- 1.2. Canada
- 1.3. Mexico
-
2. Europe
- 2.1. Germany
- 2.2. United Kingdom
- 2.3. France
- 2.4. Italy
- 2.5. Spain
- 2.6. Rest of Europe
-
3. Asia Pacific
- 3.1. China
- 3.2. Japan
- 3.3. India
- 3.4. Australia
- 3.5. South Korea
- 3.6. Rest of Asia Pacific
-
4. Middle East and Africa
- 4.1. GCC
- 4.2. South Africa
- 4.3. Rest of Middle East and Africa
-
5. South America
- 5.1. Brazil
- 5.2. Argentina
- 5.3. Rest of South America
Personal Mobility Equipment Industry REPORT HIGHLIGHTS
| Aspects | Details |
|---|---|
| Study Period | 2019-2033 |
| Base Year | 2024 |
| Estimated Year | 2025 |
| Forecast Period | 2025-2033 |
| Historical Period | 2019-2024 |
| Growth Rate | CAGR of 6.19% from 2019-2033 |
| Segmentation |
|
Table of Contents
- 1. Introduction
- 1.1. Research Scope
- 1.2. Market Segmentation
- 1.3. Research Methodology
- 1.4. Definitions and Assumptions
- 2. Executive Summary
- 2.1. Introduction
- 3. Market Dynamics
- 3.1. Introduction
- 3.2. Market Drivers
- 3.2.1. Increase in Demand for Personal Mobility Devices in Elderly Population; Technological Advancements in the Devices
- 3.3. Market Restrains
- 3.3.1. High Cost of the Devices
- 3.4. Market Trends
- 3.4.1. Wheelchairs Emerged as the Largest Segment in the Personal Mobility Devices Market
- 4. Market Factor Analysis
- 4.1. Porters Five Forces
- 4.2. Supply/Value Chain
- 4.3. PESTEL analysis
- 4.4. Market Entropy
- 4.5. Patent/Trademark Analysis
- 5. Global Personal Mobility Equipment Industry Analysis, Insights and Forecast, 2019-2031
- 5.1. Market Analysis, Insights and Forecast - by Product
- 5.1.1. Wheelchair
- 5.1.2. Walking Aids
- 5.1.3. Scooters
- 5.1.4. Other Products
- 5.2. Market Analysis, Insights and Forecast - by End User
- 5.2.1. Hospitals and Clinics
- 5.2.2. Home Care Settings
- 5.2.3. Other End Users
- 5.3. Market Analysis, Insights and Forecast - by Region
- 5.3.1. North America
- 5.3.2. Europe
- 5.3.3. Asia Pacific
- 5.3.4. Middle East and Africa
- 5.3.5. South America
- 5.1. Market Analysis, Insights and Forecast - by Product
- 6. North America Personal Mobility Equipment Industry Analysis, Insights and Forecast, 2019-2031
- 6.1. Market Analysis, Insights and Forecast - by Product
- 6.1.1. Wheelchair
- 6.1.2. Walking Aids
- 6.1.3. Scooters
- 6.1.4. Other Products
- 6.2. Market Analysis, Insights and Forecast - by End User
- 6.2.1. Hospitals and Clinics
- 6.2.2. Home Care Settings
- 6.2.3. Other End Users
- 6.1. Market Analysis, Insights and Forecast - by Product
- 7. Europe Personal Mobility Equipment Industry Analysis, Insights and Forecast, 2019-2031
- 7.1. Market Analysis, Insights and Forecast - by Product
- 7.1.1. Wheelchair
- 7.1.2. Walking Aids
- 7.1.3. Scooters
- 7.1.4. Other Products
- 7.2. Market Analysis, Insights and Forecast - by End User
- 7.2.1. Hospitals and Clinics
- 7.2.2. Home Care Settings
- 7.2.3. Other End Users
- 7.1. Market Analysis, Insights and Forecast - by Product
- 8. Asia Pacific Personal Mobility Equipment Industry Analysis, Insights and Forecast, 2019-2031
- 8.1. Market Analysis, Insights and Forecast - by Product
- 8.1.1. Wheelchair
- 8.1.2. Walking Aids
- 8.1.3. Scooters
- 8.1.4. Other Products
- 8.2. Market Analysis, Insights and Forecast - by End User
- 8.2.1. Hospitals and Clinics
- 8.2.2. Home Care Settings
- 8.2.3. Other End Users
- 8.1. Market Analysis, Insights and Forecast - by Product
- 9. Middle East and Africa Personal Mobility Equipment Industry Analysis, Insights and Forecast, 2019-2031
- 9.1. Market Analysis, Insights and Forecast - by Product
- 9.1.1. Wheelchair
- 9.1.2. Walking Aids
- 9.1.3. Scooters
- 9.1.4. Other Products
- 9.2. Market Analysis, Insights and Forecast - by End User
- 9.2.1. Hospitals and Clinics
- 9.2.2. Home Care Settings
- 9.2.3. Other End Users
- 9.1. Market Analysis, Insights and Forecast - by Product
- 10. South America Personal Mobility Equipment Industry Analysis, Insights and Forecast, 2019-2031
- 10.1. Market Analysis, Insights and Forecast - by Product
- 10.1.1. Wheelchair
- 10.1.2. Walking Aids
- 10.1.3. Scooters
- 10.1.4. Other Products
- 10.2. Market Analysis, Insights and Forecast - by End User
- 10.2.1. Hospitals and Clinics
- 10.2.2. Home Care Settings
- 10.2.3. Other End Users
- 10.1. Market Analysis, Insights and Forecast - by Product
- 11. North America Personal Mobility Equipment Industry Analysis, Insights and Forecast, 2019-2031
- 11.1. Market Analysis, Insights and Forecast - By Country/Sub-region
- 11.1.1. undefined
- 12. Europe Personal Mobility Equipment Industry Analysis, Insights and Forecast, 2019-2031
- 12.1. Market Analysis, Insights and Forecast - By Country/Sub-region
- 12.1.1. undefined
- 13. Asia Pacific Personal Mobility Equipment Industry Analysis, Insights and Forecast, 2019-2031
- 13.1. Market Analysis, Insights and Forecast - By Country/Sub-region
- 13.1.1. undefined
- 14. Middle East and Africa Personal Mobility Equipment Industry Analysis, Insights and Forecast, 2019-2031
- 14.1. Market Analysis, Insights and Forecast - By Country/Sub-region
- 14.1.1. undefined
- 15. South America Personal Mobility Equipment Industry Analysis, Insights and Forecast, 2019-2031
- 15.1. Market Analysis, Insights and Forecast - By Country/Sub-region
- 15.1.1. undefined
- 16. Competitive Analysis
- 16.1. Global Market Share Analysis 2024
- 16.2. Company Profiles
- 16.2.1 GF Health Products Inc
- 16.2.1.1. Overview
- 16.2.1.2. Products
- 16.2.1.3. SWOT Analysis
- 16.2.1.4. Recent Developments
- 16.2.1.5. Financials (Based on Availability)
- 16.2.2 Arjo
- 16.2.2.1. Overview
- 16.2.2.2. Products
- 16.2.2.3. SWOT Analysis
- 16.2.2.4. Recent Developments
- 16.2.2.5. Financials (Based on Availability)
- 16.2.3 Invacare Corporation
- 16.2.3.1. Overview
- 16.2.3.2. Products
- 16.2.3.3. SWOT Analysis
- 16.2.3.4. Recent Developments
- 16.2.3.5. Financials (Based on Availability)
- 16.2.4 Drive DeVilbiss Healthcare
- 16.2.4.1. Overview
- 16.2.4.2. Products
- 16.2.4.3. SWOT Analysis
- 16.2.4.4. Recent Developments
- 16.2.4.5. Financials (Based on Availability)
- 16.2.5 Patricia Industries (Permobil)
- 16.2.5.1. Overview
- 16.2.5.2. Products
- 16.2.5.3. SWOT Analysis
- 16.2.5.4. Recent Developments
- 16.2.5.5. Financials (Based on Availability)
- 16.2.6 Rollz International
- 16.2.6.1. Overview
- 16.2.6.2. Products
- 16.2.6.3. SWOT Analysis
- 16.2.6.4. Recent Developments
- 16.2.6.5. Financials (Based on Availability)
- 16.2.7 Kaye Products Inc
- 16.2.7.1. Overview
- 16.2.7.2. Products
- 16.2.7.3. SWOT Analysis
- 16.2.7.4. Recent Developments
- 16.2.7.5. Financials (Based on Availability)
- 16.2.8 Ottobock
- 16.2.8.1. Overview
- 16.2.8.2. Products
- 16.2.8.3. SWOT Analysis
- 16.2.8.4. Recent Developments
- 16.2.8.5. Financials (Based on Availability)
- 16.2.9 Stryker Corporation
- 16.2.9.1. Overview
- 16.2.9.2. Products
- 16.2.9.3. SWOT Analysis
- 16.2.9.4. Recent Developments
- 16.2.9.5. Financials (Based on Availability)
- 16.2.10 Performance Health
- 16.2.10.1. Overview
- 16.2.10.2. Products
- 16.2.10.3. SWOT Analysis
- 16.2.10.4. Recent Developments
- 16.2.10.5. Financials (Based on Availability)
- 16.2.11 Pride Mobility Products Corp
- 16.2.11.1. Overview
- 16.2.11.2. Products
- 16.2.11.3. SWOT Analysis
- 16.2.11.4. Recent Developments
- 16.2.11.5. Financials (Based on Availability)
- 16.2.12 Medline Industries Inc
- 16.2.12.1. Overview
- 16.2.12.2. Products
- 16.2.12.3. SWOT Analysis
- 16.2.12.4. Recent Developments
- 16.2.12.5. Financials (Based on Availability)
- 16.2.13 Sunrise Medical (US) LLC
- 16.2.13.1. Overview
- 16.2.13.2. Products
- 16.2.13.3. SWOT Analysis
- 16.2.13.4. Recent Developments
- 16.2.13.5. Financials (Based on Availability)
- 16.2.1 GF Health Products Inc
List of Figures
- Figure 1: Global Personal Mobility Equipment Industry Revenue Breakdown (Million, %) by Region 2024 & 2032
- Figure 2: Global Personal Mobility Equipment Industry Volume Breakdown (K Unit, %) by Region 2024 & 2032
- Figure 3: North America Personal Mobility Equipment Industry Revenue (Million), by Country 2024 & 2032
- Figure 4: North America Personal Mobility Equipment Industry Volume (K Unit), by Country 2024 & 2032
- Figure 5: North America Personal Mobility Equipment Industry Revenue Share (%), by Country 2024 & 2032
- Figure 6: North America Personal Mobility Equipment Industry Volume Share (%), by Country 2024 & 2032
- Figure 7: Europe Personal Mobility Equipment Industry Revenue (Million), by Country 2024 & 2032
- Figure 8: Europe Personal Mobility Equipment Industry Volume (K Unit), by Country 2024 & 2032
- Figure 9: Europe Personal Mobility Equipment Industry Revenue Share (%), by Country 2024 & 2032
- Figure 10: Europe Personal Mobility Equipment Industry Volume Share (%), by Country 2024 & 2032
- Figure 11: Asia Pacific Personal Mobility Equipment Industry Revenue (Million), by Country 2024 & 2032
- Figure 12: Asia Pacific Personal Mobility Equipment Industry Volume (K Unit), by Country 2024 & 2032
- Figure 13: Asia Pacific Personal Mobility Equipment Industry Revenue Share (%), by Country 2024 & 2032
- Figure 14: Asia Pacific Personal Mobility Equipment Industry Volume Share (%), by Country 2024 & 2032
- Figure 15: Middle East and Africa Personal Mobility Equipment Industry Revenue (Million), by Country 2024 & 2032
- Figure 16: Middle East and Africa Personal Mobility Equipment Industry Volume (K Unit), by Country 2024 & 2032
- Figure 17: Middle East and Africa Personal Mobility Equipment Industry Revenue Share (%), by Country 2024 & 2032
- Figure 18: Middle East and Africa Personal Mobility Equipment Industry Volume Share (%), by Country 2024 & 2032
- Figure 19: South America Personal Mobility Equipment Industry Revenue (Million), by Country 2024 & 2032
- Figure 20: South America Personal Mobility Equipment Industry Volume (K Unit), by Country 2024 & 2032
- Figure 21: South America Personal Mobility Equipment Industry Revenue Share (%), by Country 2024 & 2032
- Figure 22: South America Personal Mobility Equipment Industry Volume Share (%), by Country 2024 & 2032
- Figure 23: North America Personal Mobility Equipment Industry Revenue (Million), by Product 2024 & 2032
- Figure 24: North America Personal Mobility Equipment Industry Volume (K Unit), by Product 2024 & 2032
- Figure 25: North America Personal Mobility Equipment Industry Revenue Share (%), by Product 2024 & 2032
- Figure 26: North America Personal Mobility Equipment Industry Volume Share (%), by Product 2024 & 2032
- Figure 27: North America Personal Mobility Equipment Industry Revenue (Million), by End User 2024 & 2032
- Figure 28: North America Personal Mobility Equipment Industry Volume (K Unit), by End User 2024 & 2032
- Figure 29: North America Personal Mobility Equipment Industry Revenue Share (%), by End User 2024 & 2032
- Figure 30: North America Personal Mobility Equipment Industry Volume Share (%), by End User 2024 & 2032
- Figure 31: North America Personal Mobility Equipment Industry Revenue (Million), by Country 2024 & 2032
- Figure 32: North America Personal Mobility Equipment Industry Volume (K Unit), by Country 2024 & 2032
- Figure 33: North America Personal Mobility Equipment Industry Revenue Share (%), by Country 2024 & 2032
- Figure 34: North America Personal Mobility Equipment Industry Volume Share (%), by Country 2024 & 2032
- Figure 35: Europe Personal Mobility Equipment Industry Revenue (Million), by Product 2024 & 2032
- Figure 36: Europe Personal Mobility Equipment Industry Volume (K Unit), by Product 2024 & 2032
- Figure 37: Europe Personal Mobility Equipment Industry Revenue Share (%), by Product 2024 & 2032
- Figure 38: Europe Personal Mobility Equipment Industry Volume Share (%), by Product 2024 & 2032
- Figure 39: Europe Personal Mobility Equipment Industry Revenue (Million), by End User 2024 & 2032
- Figure 40: Europe Personal Mobility Equipment Industry Volume (K Unit), by End User 2024 & 2032
- Figure 41: Europe Personal Mobility Equipment Industry Revenue Share (%), by End User 2024 & 2032
- Figure 42: Europe Personal Mobility Equipment Industry Volume Share (%), by End User 2024 & 2032
- Figure 43: Europe Personal Mobility Equipment Industry Revenue (Million), by Country 2024 & 2032
- Figure 44: Europe Personal Mobility Equipment Industry Volume (K Unit), by Country 2024 & 2032
- Figure 45: Europe Personal Mobility Equipment Industry Revenue Share (%), by Country 2024 & 2032
- Figure 46: Europe Personal Mobility Equipment Industry Volume Share (%), by Country 2024 & 2032
- Figure 47: Asia Pacific Personal Mobility Equipment Industry Revenue (Million), by Product 2024 & 2032
- Figure 48: Asia Pacific Personal Mobility Equipment Industry Volume (K Unit), by Product 2024 & 2032
- Figure 49: Asia Pacific Personal Mobility Equipment Industry Revenue Share (%), by Product 2024 & 2032
- Figure 50: Asia Pacific Personal Mobility Equipment Industry Volume Share (%), by Product 2024 & 2032
- Figure 51: Asia Pacific Personal Mobility Equipment Industry Revenue (Million), by End User 2024 & 2032
- Figure 52: Asia Pacific Personal Mobility Equipment Industry Volume (K Unit), by End User 2024 & 2032
- Figure 53: Asia Pacific Personal Mobility Equipment Industry Revenue Share (%), by End User 2024 & 2032
- Figure 54: Asia Pacific Personal Mobility Equipment Industry Volume Share (%), by End User 2024 & 2032
- Figure 55: Asia Pacific Personal Mobility Equipment Industry Revenue (Million), by Country 2024 & 2032
- Figure 56: Asia Pacific Personal Mobility Equipment Industry Volume (K Unit), by Country 2024 & 2032
- Figure 57: Asia Pacific Personal Mobility Equipment Industry Revenue Share (%), by Country 2024 & 2032
- Figure 58: Asia Pacific Personal Mobility Equipment Industry Volume Share (%), by Country 2024 & 2032
- Figure 59: Middle East and Africa Personal Mobility Equipment Industry Revenue (Million), by Product 2024 & 2032
- Figure 60: Middle East and Africa Personal Mobility Equipment Industry Volume (K Unit), by Product 2024 & 2032
- Figure 61: Middle East and Africa Personal Mobility Equipment Industry Revenue Share (%), by Product 2024 & 2032
- Figure 62: Middle East and Africa Personal Mobility Equipment Industry Volume Share (%), by Product 2024 & 2032
- Figure 63: Middle East and Africa Personal Mobility Equipment Industry Revenue (Million), by End User 2024 & 2032
- Figure 64: Middle East and Africa Personal Mobility Equipment Industry Volume (K Unit), by End User 2024 & 2032
- Figure 65: Middle East and Africa Personal Mobility Equipment Industry Revenue Share (%), by End User 2024 & 2032
- Figure 66: Middle East and Africa Personal Mobility Equipment Industry Volume Share (%), by End User 2024 & 2032
- Figure 67: Middle East and Africa Personal Mobility Equipment Industry Revenue (Million), by Country 2024 & 2032
- Figure 68: Middle East and Africa Personal Mobility Equipment Industry Volume (K Unit), by Country 2024 & 2032
- Figure 69: Middle East and Africa Personal Mobility Equipment Industry Revenue Share (%), by Country 2024 & 2032
- Figure 70: Middle East and Africa Personal Mobility Equipment Industry Volume Share (%), by Country 2024 & 2032
- Figure 71: South America Personal Mobility Equipment Industry Revenue (Million), by Product 2024 & 2032
- Figure 72: South America Personal Mobility Equipment Industry Volume (K Unit), by Product 2024 & 2032
- Figure 73: South America Personal Mobility Equipment Industry Revenue Share (%), by Product 2024 & 2032
- Figure 74: South America Personal Mobility Equipment Industry Volume Share (%), by Product 2024 & 2032
- Figure 75: South America Personal Mobility Equipment Industry Revenue (Million), by End User 2024 & 2032
- Figure 76: South America Personal Mobility Equipment Industry Volume (K Unit), by End User 2024 & 2032
- Figure 77: South America Personal Mobility Equipment Industry Revenue Share (%), by End User 2024 & 2032
- Figure 78: South America Personal Mobility Equipment Industry Volume Share (%), by End User 2024 & 2032
- Figure 79: South America Personal Mobility Equipment Industry Revenue (Million), by Country 2024 & 2032
- Figure 80: South America Personal Mobility Equipment Industry Volume (K Unit), by Country 2024 & 2032
- Figure 81: South America Personal Mobility Equipment Industry Revenue Share (%), by Country 2024 & 2032
- Figure 82: South America Personal Mobility Equipment Industry Volume Share (%), by Country 2024 & 2032
List of Tables
- Table 1: Global Personal Mobility Equipment Industry Revenue Million Forecast, by Region 2019 & 2032
- Table 2: Global Personal Mobility Equipment Industry Volume K Unit Forecast, by Region 2019 & 2032
- Table 3: Global Personal Mobility Equipment Industry Revenue Million Forecast, by Product 2019 & 2032
- Table 4: Global Personal Mobility Equipment Industry Volume K Unit Forecast, by Product 2019 & 2032
- Table 5: Global Personal Mobility Equipment Industry Revenue Million Forecast, by End User 2019 & 2032
- Table 6: Global Personal Mobility Equipment Industry Volume K Unit Forecast, by End User 2019 & 2032
- Table 7: Global Personal Mobility Equipment Industry Revenue Million Forecast, by Region 2019 & 2032
- Table 8: Global Personal Mobility Equipment Industry Volume K Unit Forecast, by Region 2019 & 2032
- Table 9: Global Personal Mobility Equipment Industry Revenue Million Forecast, by Country 2019 & 2032
- Table 10: Global Personal Mobility Equipment Industry Volume K Unit Forecast, by Country 2019 & 2032
- Table 11: Global Personal Mobility Equipment Industry Revenue Million Forecast, by Country 2019 & 2032
- Table 12: Global Personal Mobility Equipment Industry Volume K Unit Forecast, by Country 2019 & 2032
- Table 13: Global Personal Mobility Equipment Industry Revenue Million Forecast, by Country 2019 & 2032
- Table 14: Global Personal Mobility Equipment Industry Volume K Unit Forecast, by Country 2019 & 2032
- Table 15: Global Personal Mobility Equipment Industry Revenue Million Forecast, by Country 2019 & 2032
- Table 16: Global Personal Mobility Equipment Industry Volume K Unit Forecast, by Country 2019 & 2032
- Table 17: Global Personal Mobility Equipment Industry Revenue Million Forecast, by Country 2019 & 2032
- Table 18: Global Personal Mobility Equipment Industry Volume K Unit Forecast, by Country 2019 & 2032
- Table 19: Global Personal Mobility Equipment Industry Revenue Million Forecast, by Product 2019 & 2032
- Table 20: Global Personal Mobility Equipment Industry Volume K Unit Forecast, by Product 2019 & 2032
- Table 21: Global Personal Mobility Equipment Industry Revenue Million Forecast, by End User 2019 & 2032
- Table 22: Global Personal Mobility Equipment Industry Volume K Unit Forecast, by End User 2019 & 2032
- Table 23: Global Personal Mobility Equipment Industry Revenue Million Forecast, by Country 2019 & 2032
- Table 24: Global Personal Mobility Equipment Industry Volume K Unit Forecast, by Country 2019 & 2032
- Table 25: United States Personal Mobility Equipment Industry Revenue (Million) Forecast, by Application 2019 & 2032
- Table 26: United States Personal Mobility Equipment Industry Volume (K Unit) Forecast, by Application 2019 & 2032
- Table 27: Canada Personal Mobility Equipment Industry Revenue (Million) Forecast, by Application 2019 & 2032
- Table 28: Canada Personal Mobility Equipment Industry Volume (K Unit) Forecast, by Application 2019 & 2032
- Table 29: Mexico Personal Mobility Equipment Industry Revenue (Million) Forecast, by Application 2019 & 2032
- Table 30: Mexico Personal Mobility Equipment Industry Volume (K Unit) Forecast, by Application 2019 & 2032
- Table 31: Global Personal Mobility Equipment Industry Revenue Million Forecast, by Product 2019 & 2032
- Table 32: Global Personal Mobility Equipment Industry Volume K Unit Forecast, by Product 2019 & 2032
- Table 33: Global Personal Mobility Equipment Industry Revenue Million Forecast, by End User 2019 & 2032
- Table 34: Global Personal Mobility Equipment Industry Volume K Unit Forecast, by End User 2019 & 2032
- Table 35: Global Personal Mobility Equipment Industry Revenue Million Forecast, by Country 2019 & 2032
- Table 36: Global Personal Mobility Equipment Industry Volume K Unit Forecast, by Country 2019 & 2032
- Table 37: Germany Personal Mobility Equipment Industry Revenue (Million) Forecast, by Application 2019 & 2032
- Table 38: Germany Personal Mobility Equipment Industry Volume (K Unit) Forecast, by Application 2019 & 2032
- Table 39: United Kingdom Personal Mobility Equipment Industry Revenue (Million) Forecast, by Application 2019 & 2032
- Table 40: United Kingdom Personal Mobility Equipment Industry Volume (K Unit) Forecast, by Application 2019 & 2032
- Table 41: France Personal Mobility Equipment Industry Revenue (Million) Forecast, by Application 2019 & 2032
- Table 42: France Personal Mobility Equipment Industry Volume (K Unit) Forecast, by Application 2019 & 2032
- Table 43: Italy Personal Mobility Equipment Industry Revenue (Million) Forecast, by Application 2019 & 2032
- Table 44: Italy Personal Mobility Equipment Industry Volume (K Unit) Forecast, by Application 2019 & 2032
- Table 45: Spain Personal Mobility Equipment Industry Revenue (Million) Forecast, by Application 2019 & 2032
- Table 46: Spain Personal Mobility Equipment Industry Volume (K Unit) Forecast, by Application 2019 & 2032
- Table 47: Rest of Europe Personal Mobility Equipment Industry Revenue (Million) Forecast, by Application 2019 & 2032
- Table 48: Rest of Europe Personal Mobility Equipment Industry Volume (K Unit) Forecast, by Application 2019 & 2032
- Table 49: Global Personal Mobility Equipment Industry Revenue Million Forecast, by Product 2019 & 2032
- Table 50: Global Personal Mobility Equipment Industry Volume K Unit Forecast, by Product 2019 & 2032
- Table 51: Global Personal Mobility Equipment Industry Revenue Million Forecast, by End User 2019 & 2032
- Table 52: Global Personal Mobility Equipment Industry Volume K Unit Forecast, by End User 2019 & 2032
- Table 53: Global Personal Mobility Equipment Industry Revenue Million Forecast, by Country 2019 & 2032
- Table 54: Global Personal Mobility Equipment Industry Volume K Unit Forecast, by Country 2019 & 2032
- Table 55: China Personal Mobility Equipment Industry Revenue (Million) Forecast, by Application 2019 & 2032
- Table 56: China Personal Mobility Equipment Industry Volume (K Unit) Forecast, by Application 2019 & 2032
- Table 57: Japan Personal Mobility Equipment Industry Revenue (Million) Forecast, by Application 2019 & 2032
- Table 58: Japan Personal Mobility Equipment Industry Volume (K Unit) Forecast, by Application 2019 & 2032
- Table 59: India Personal Mobility Equipment Industry Revenue (Million) Forecast, by Application 2019 & 2032
- Table 60: India Personal Mobility Equipment Industry Volume (K Unit) Forecast, by Application 2019 & 2032
- Table 61: Australia Personal Mobility Equipment Industry Revenue (Million) Forecast, by Application 2019 & 2032
- Table 62: Australia Personal Mobility Equipment Industry Volume (K Unit) Forecast, by Application 2019 & 2032
- Table 63: South Korea Personal Mobility Equipment Industry Revenue (Million) Forecast, by Application 2019 & 2032
- Table 64: South Korea Personal Mobility Equipment Industry Volume (K Unit) Forecast, by Application 2019 & 2032
- Table 65: Rest of Asia Pacific Personal Mobility Equipment Industry Revenue (Million) Forecast, by Application 2019 & 2032
- Table 66: Rest of Asia Pacific Personal Mobility Equipment Industry Volume (K Unit) Forecast, by Application 2019 & 2032
- Table 67: Global Personal Mobility Equipment Industry Revenue Million Forecast, by Product 2019 & 2032
- Table 68: Global Personal Mobility Equipment Industry Volume K Unit Forecast, by Product 2019 & 2032
- Table 69: Global Personal Mobility Equipment Industry Revenue Million Forecast, by End User 2019 & 2032
- Table 70: Global Personal Mobility Equipment Industry Volume K Unit Forecast, by End User 2019 & 2032
- Table 71: Global Personal Mobility Equipment Industry Revenue Million Forecast, by Country 2019 & 2032
- Table 72: Global Personal Mobility Equipment Industry Volume K Unit Forecast, by Country 2019 & 2032
- Table 73: GCC Personal Mobility Equipment Industry Revenue (Million) Forecast, by Application 2019 & 2032
- Table 74: GCC Personal Mobility Equipment Industry Volume (K Unit) Forecast, by Application 2019 & 2032
- Table 75: South Africa Personal Mobility Equipment Industry Revenue (Million) Forecast, by Application 2019 & 2032
- Table 76: South Africa Personal Mobility Equipment Industry Volume (K Unit) Forecast, by Application 2019 & 2032
- Table 77: Rest of Middle East and Africa Personal Mobility Equipment Industry Revenue (Million) Forecast, by Application 2019 & 2032
- Table 78: Rest of Middle East and Africa Personal Mobility Equipment Industry Volume (K Unit) Forecast, by Application 2019 & 2032
- Table 79: Global Personal Mobility Equipment Industry Revenue Million Forecast, by Product 2019 & 2032
- Table 80: Global Personal Mobility Equipment Industry Volume K Unit Forecast, by Product 2019 & 2032
- Table 81: Global Personal Mobility Equipment Industry Revenue Million Forecast, by End User 2019 & 2032
- Table 82: Global Personal Mobility Equipment Industry Volume K Unit Forecast, by End User 2019 & 2032
- Table 83: Global Personal Mobility Equipment Industry Revenue Million Forecast, by Country 2019 & 2032
- Table 84: Global Personal Mobility Equipment Industry Volume K Unit Forecast, by Country 2019 & 2032
- Table 85: Brazil Personal Mobility Equipment Industry Revenue (Million) Forecast, by Application 2019 & 2032
- Table 86: Brazil Personal Mobility Equipment Industry Volume (K Unit) Forecast, by Application 2019 & 2032
- Table 87: Argentina Personal Mobility Equipment Industry Revenue (Million) Forecast, by Application 2019 & 2032
- Table 88: Argentina Personal Mobility Equipment Industry Volume (K Unit) Forecast, by Application 2019 & 2032
- Table 89: Rest of South America Personal Mobility Equipment Industry Revenue (Million) Forecast, by Application 2019 & 2032
- Table 90: Rest of South America Personal Mobility Equipment Industry Volume (K Unit) Forecast, by Application 2019 & 2032
Frequently Asked Questions
1. What is the projected Compound Annual Growth Rate (CAGR) of the Personal Mobility Equipment Industry?
The projected CAGR is approximately 6.19%.
2. Which companies are prominent players in the Personal Mobility Equipment Industry?
Key companies in the market include GF Health Products Inc, Arjo, Invacare Corporation, Drive DeVilbiss Healthcare, Patricia Industries (Permobil), Rollz International, Kaye Products Inc, Ottobock, Stryker Corporation, Performance Health, Pride Mobility Products Corp, Medline Industries Inc, Sunrise Medical (US) LLC.
3. What are the main segments of the Personal Mobility Equipment Industry?
The market segments include Product, End User.
4. Can you provide details about the market size?
The market size is estimated to be USD 13.95 Million as of 2022.
5. What are some drivers contributing to market growth?
Increase in Demand for Personal Mobility Devices in Elderly Population; Technological Advancements in the Devices.
6. What are the notable trends driving market growth?
Wheelchairs Emerged as the Largest Segment in the Personal Mobility Devices Market.
7. Are there any restraints impacting market growth?
High Cost of the Devices.
8. Can you provide examples of recent developments in the market?
In August 2021, Falcon Mobility unveiled the Ultra-Lite 2 electric wheelchair, which is designed to be lightweight and easy to maneuver. The company hopes to provide a new affordable and lightweight wheelchair option to the elderly and disabled communities with this launch, making it easier for caregivers to transport their wards' personal mobility aids to and from a vehicle.
9. What pricing options are available for accessing the report?
Pricing options include single-user, multi-user, and enterprise licenses priced at USD 4750, USD 5250, and USD 8750 respectively.
10. Is the market size provided in terms of value or volume?
The market size is provided in terms of value, measured in Million and volume, measured in K Unit.
11. Are there any specific market keywords associated with the report?
Yes, the market keyword associated with the report is "Personal Mobility Equipment Industry," which aids in identifying and referencing the specific market segment covered.
12. How do I determine which pricing option suits my needs best?
The pricing options vary based on user requirements and access needs. Individual users may opt for single-user licenses, while businesses requiring broader access may choose multi-user or enterprise licenses for cost-effective access to the report.
13. Are there any additional resources or data provided in the Personal Mobility Equipment Industry report?
While the report offers comprehensive insights, it's advisable to review the specific contents or supplementary materials provided to ascertain if additional resources or data are available.
14. How can I stay updated on further developments or reports in the Personal Mobility Equipment Industry?
To stay informed about further developments, trends, and reports in the Personal Mobility Equipment Industry, consider subscribing to industry newsletters, following relevant companies and organizations, or regularly checking reputable industry news sources and publications.
Methodology
Step 1 - Identification of Relevant Samples Size from Population Database


Step 2 - Approaches for Defining Global Market Size (Value, Volume* & Price*)

Note*: In applicable scenarios
Step 3 - Data Sources
Primary Research
- Web Analytics
- Survey Reports
- Research Institute
- Latest Research Reports
- Opinion Leaders
Secondary Research
- Annual Reports
- White Paper
- Latest Press Release
- Industry Association
- Paid Database
- Investor Presentations

Step 4 - Data Triangulation
Involves using different sources of information in order to increase the validity of a study
These sources are likely to be stakeholders in a program - participants, other researchers, program staff, other community members, and so on.
Then we put all data in single framework & apply various statistical tools to find out the dynamic on the market.
During the analysis stage, feedback from the stakeholder groups would be compared to determine areas of agreement as well as areas of divergence
