

Key Insights
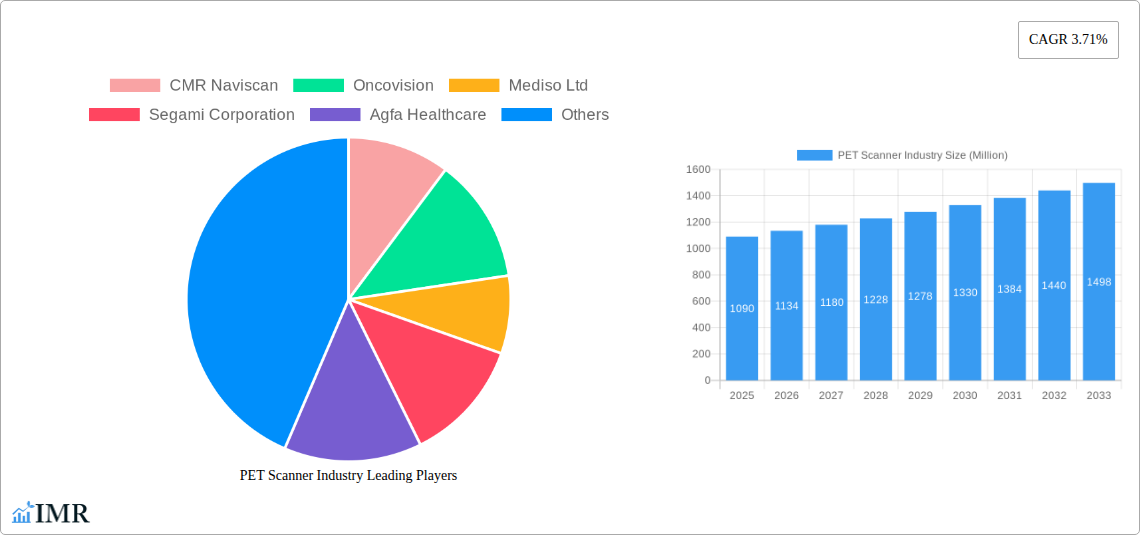
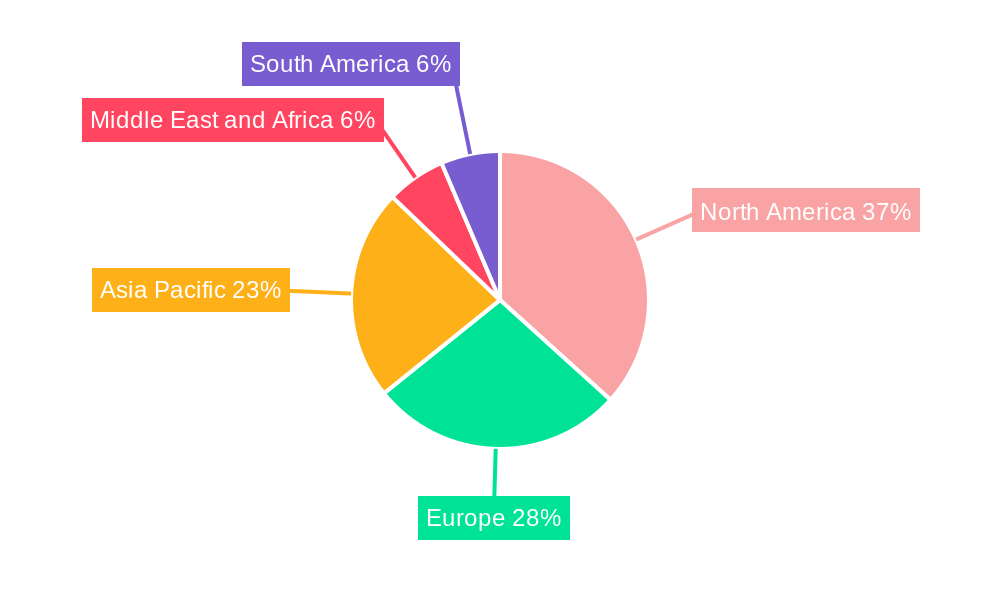
The global PET scanner market, valued at $1.09 billion in 2025, is projected to experience steady growth, driven by a Compound Annual Growth Rate (CAGR) of 3.71% from 2025 to 2033. This growth is fueled by several key factors. Technological advancements leading to improved image quality, faster scan times, and increased sensitivity are attracting more healthcare providers. The rising prevalence of cancer and cardiovascular diseases, necessitating accurate and early diagnosis, significantly boosts demand. Furthermore, the increasing adoption of PET/CT and PET/MRI hybrid systems, offering superior diagnostic capabilities, contributes to market expansion. Growth is also spurred by government initiatives promoting early disease detection and improved healthcare infrastructure, especially in emerging economies. However, the high cost of PET scanners and associated radiotracers, coupled with stringent regulatory approvals, pose challenges to market penetration. The market is segmented by product type (full-ring and partial-ring scanners), application (cardiology, oncology, neurology, and others), and end-user (hospitals, diagnostic centers, and others). North America currently holds a significant market share due to advanced healthcare infrastructure and high adoption rates, but Asia Pacific is projected to witness substantial growth in the coming years due to increasing healthcare expenditure and rising prevalence of target diseases.
The competitive landscape is characterized by the presence of both established players like Siemens Healthineers AG, GE Healthcare, and Philips, and smaller specialized companies. These companies are strategically focusing on innovation, partnerships, and geographic expansion to enhance their market position. Future growth will likely be influenced by the development of more affordable and accessible PET scanner technologies, advancements in image reconstruction algorithms, and the integration of artificial intelligence for improved diagnostics and workflow efficiency. Furthermore, the development of novel radiotracers targeting specific diseases and improved reimbursement policies in various regions are likely to shape market dynamics in the coming years. The ongoing research and development in this field suggest that the PET scanner market is poised for continued expansion, offering significant opportunities for both established and emerging players.
PET Scanner Industry Market Report: 2019-2033
This comprehensive report provides an in-depth analysis of the PET Scanner industry, encompassing market dynamics, growth trends, regional segmentation, product landscape, and key players. The report covers the period from 2019 to 2033, with a focus on the forecast period of 2025-2033 and a base year of 2025. This analysis will be invaluable to industry professionals, investors, and strategic decision-makers seeking to understand and capitalize on opportunities within this rapidly evolving market. The parent market is the Medical Imaging Equipment market, and the child market is the Nuclear Medicine Imaging Equipment market.
PET Scanner Industry Market Dynamics & Structure
The PET scanner market is characterized by a moderately concentrated landscape with key players holding significant market share. Technological innovation, particularly in areas like detector technology and image reconstruction algorithms, is a major driver of growth. Stringent regulatory frameworks governing the manufacturing and use of radioisotopes and medical devices influence market dynamics. Competitive product substitutes, such as SPECT and MRI, exist but offer different imaging capabilities. The end-user demographic is primarily comprised of hospitals and diagnostic centers, with a growing segment of specialized clinics. M&A activity has been moderate, with strategic partnerships and acquisitions shaping market consolidation.
- Market Concentration: The top 5 players account for approximately xx% of the global market (2024).
- Technological Innovation: Advancements in detector technology (e.g., silicon photomultiplier tubes) are driving improvements in image resolution and sensitivity.
- Regulatory Frameworks: FDA and equivalent international bodies significantly impact market access and product approvals.
- Competitive Substitutes: SPECT and MRI provide alternative imaging modalities, but PET's unique capabilities maintain demand.
- End-User Demographics: Hospitals (xx million units) and diagnostic centers (xx million units) represent the primary end-users.
- M&A Trends: xx major M&A deals were recorded between 2019 and 2024, with a focus on enhancing product portfolios and geographical reach.
PET Scanner Industry Growth Trends & Insights
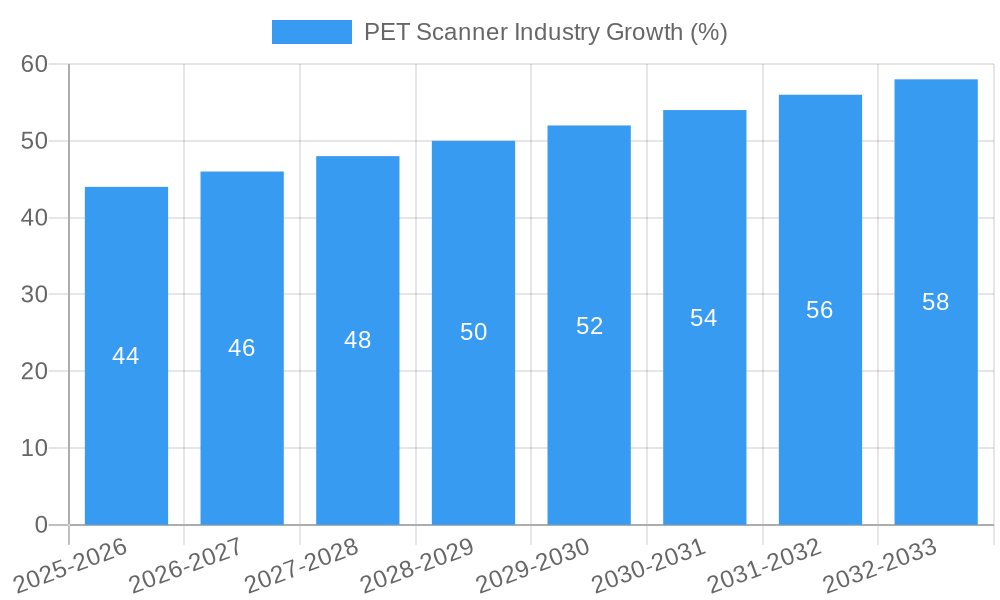
The global PET scanner market exhibited robust growth during the historical period (2019-2024), driven by factors including increasing prevalence of cancer, technological advancements, and rising healthcare expenditure. The market size is expected to reach xx million units in 2025, growing at a CAGR of xx% during the forecast period (2025-2033). Increased adoption rates, particularly in emerging economies, coupled with technological disruptions, are contributing to market expansion. Consumer behavior is shifting towards preference for higher resolution and faster scan times. The market penetration rate for PET scanners remains relatively low in some regions, presenting significant growth opportunities.
Dominant Regions, Countries, or Segments in PET Scanner Industry
North America currently dominates the PET scanner market, followed by Europe and Asia-Pacific. Within product types, Full Ring PET Scanners hold a larger market share (xx%) compared to Partial Ring PET Scanners (xx%). Oncology remains the leading application segment (xx%), followed by Cardiology (xx%) and Neurology (xx%). Hospitals constitute the largest end-user segment (xx%). The dominance of North America is attributed to factors such as high healthcare expenditure, advanced healthcare infrastructure, and a high prevalence of cancer.
- Key Drivers in North America: High healthcare spending, strong regulatory support, and early adoption of advanced technologies.
- Growth Potential in Asia-Pacific: Rapidly expanding healthcare infrastructure, increasing prevalence of chronic diseases, and rising disposable incomes are driving growth in this region.
- Market Share: North America (xx%), Europe (xx%), Asia-Pacific (xx%).
PET Scanner Industry Product Landscape
The PET scanner market offers a range of products, including full-ring and partial-ring scanners, each with varying levels of sensitivity, resolution, and speed. Recent innovations focus on improving image quality, reducing scan times, and enhancing patient comfort. Unique selling propositions include features like advanced reconstruction algorithms, integrated CT capabilities, and advanced workflow software. Technological advancements continue to drive the development of more efficient and user-friendly systems.
Key Drivers, Barriers & Challenges in PET Scanner Industry
Key Drivers: Rising prevalence of cancer and other diseases requiring PET imaging, technological advancements enhancing image quality and speed, increasing healthcare spending globally.
Key Challenges: High cost of equipment and radioisotopes, stringent regulatory approvals, competition from alternative imaging modalities, and the need for specialized personnel to operate and interpret scans. The supply chain disruptions from 2020 to 2022 impacted the availability of crucial components, resulting in a xx% decrease in production for a period of xx months.
Emerging Opportunities in PET Scanner Industry
Emerging opportunities lie in the development of more affordable and accessible PET scanners, particularly for use in emerging markets. The expansion of PET/MRI and PET/CT hybrid systems offers opportunities to enhance diagnostic capabilities. Advances in radiotracer development, enabling more specific and sensitive imaging, are creating new applications in areas like neurology and cardiology.
Growth Accelerators in the PET Scanner Industry
Technological advancements in detector technology, image reconstruction algorithms, and radiotracer development are key growth catalysts. Strategic partnerships between imaging equipment manufacturers and radiopharmaceutical companies will streamline the supply chain and improve patient access. Market expansion into underserved regions through public-private partnerships will increase penetration rates and fuel future growth.
Key Players Shaping the PET Scanner Industry Market
- CMR Naviscan
- Oncovision
- Mediso Ltd
- Segami Corporation
- Agfa Healthcare
- Siemens Healthineers AG
- Cardinal Health
- General Electric Company (GE Healthcare)
- Koninklijke Philips NV
- Neusoft Corporation
- Biosensors International (Spectrum Dynamics Ltd)
- Positron Corporation
Notable Milestones in PET Scanner Industry Sector
- July 2022: Radialis Inc. received FDA clearance for the Radialis PET Imager.
- August 2022: Positron Corporation acquired its first PET-CT system from Neusoft Medical Systems.
In-Depth PET Scanner Industry Market Outlook
The PET scanner market is poised for continued growth, driven by technological innovation, expanding applications, and increasing healthcare investment. Strategic partnerships, technological breakthroughs, and market expansion into emerging economies will shape the future landscape. The focus will be on developing more accessible and affordable solutions, improving image quality, and expanding the clinical applications of PET imaging.
PET Scanner Industry Segmentation
-
1. Product Type
- 1.1. Full Ring PET Scanners
- 1.2. Partial Ring PET Scanners
-
2. Application
- 2.1. Cardiology
- 2.2. Neurology
- 2.3. Oncology
- 2.4. Other Applications
-
3. End-User
- 3.1. Hospitals
- 3.2. Diagnostic Centers
- 3.3. Other End-Users
PET Scanner Industry Segmentation By Geography
-
1. North America
- 1.1. United States
- 1.2. Canada
- 1.3. Mexico
-
2. Europe
- 2.1. Germany
- 2.2. United Kingdom
- 2.3. France
- 2.4. Italy
- 2.5. Spain
- 2.6. Rest of Europe
-
3. Asia Pacific
- 3.1. China
- 3.2. Japan
- 3.3. India
- 3.4. Australia
- 3.5. South Korea
- 3.6. Rest of Asia Pacific
-
4. Middle East and Africa
- 4.1. GCC
- 4.2. South Africa
- 4.3. Rest of Middle East and Africa
-
5. South America
- 5.1. Brazil
- 5.2. Argentina
- 5.3. Rest of South America
PET Scanner Industry REPORT HIGHLIGHTS
| Aspects | Details |
|---|---|
| Study Period | 2019-2033 |
| Base Year | 2024 |
| Estimated Year | 2025 |
| Forecast Period | 2025-2033 |
| Historical Period | 2019-2024 |
| Growth Rate | CAGR of 3.71% from 2019-2033 |
| Segmentation |
|
Table of Contents
- 1. Introduction
- 1.1. Research Scope
- 1.2. Market Segmentation
- 1.3. Research Methodology
- 1.4. Definitions and Assumptions
- 2. Executive Summary
- 2.1. Introduction
- 3. Market Dynamics
- 3.1. Introduction
- 3.2. Market Drivers
- 3.2.1. Increasing Demand for PET Analysis in Radio Pharmaceuticals; Technological Advancements in PET Imaging for Oncology and Advanced Diagnostics Applications; Integration of X-ray Tomography (CT) into PET
- 3.3. Market Restrains
- 3.3.1. Shorter Half-life of Radioisotopes; Stringent Regulatory Guidelines
- 3.4. Market Trends
- 3.4.1. The Oncology Segment is Expected to Hold a Significant Market Share Over the Forecast Period
- 4. Market Factor Analysis
- 4.1. Porters Five Forces
- 4.2. Supply/Value Chain
- 4.3. PESTEL analysis
- 4.4. Market Entropy
- 4.5. Patent/Trademark Analysis
- 5. Global PET Scanner Industry Analysis, Insights and Forecast, 2019-2031
- 5.1. Market Analysis, Insights and Forecast - by Product Type
- 5.1.1. Full Ring PET Scanners
- 5.1.2. Partial Ring PET Scanners
- 5.2. Market Analysis, Insights and Forecast - by Application
- 5.2.1. Cardiology
- 5.2.2. Neurology
- 5.2.3. Oncology
- 5.2.4. Other Applications
- 5.3. Market Analysis, Insights and Forecast - by End-User
- 5.3.1. Hospitals
- 5.3.2. Diagnostic Centers
- 5.3.3. Other End-Users
- 5.4. Market Analysis, Insights and Forecast - by Region
- 5.4.1. North America
- 5.4.2. Europe
- 5.4.3. Asia Pacific
- 5.4.4. Middle East and Africa
- 5.4.5. South America
- 5.1. Market Analysis, Insights and Forecast - by Product Type
- 6. North America PET Scanner Industry Analysis, Insights and Forecast, 2019-2031
- 6.1. Market Analysis, Insights and Forecast - by Product Type
- 6.1.1. Full Ring PET Scanners
- 6.1.2. Partial Ring PET Scanners
- 6.2. Market Analysis, Insights and Forecast - by Application
- 6.2.1. Cardiology
- 6.2.2. Neurology
- 6.2.3. Oncology
- 6.2.4. Other Applications
- 6.3. Market Analysis, Insights and Forecast - by End-User
- 6.3.1. Hospitals
- 6.3.2. Diagnostic Centers
- 6.3.3. Other End-Users
- 6.1. Market Analysis, Insights and Forecast - by Product Type
- 7. Europe PET Scanner Industry Analysis, Insights and Forecast, 2019-2031
- 7.1. Market Analysis, Insights and Forecast - by Product Type
- 7.1.1. Full Ring PET Scanners
- 7.1.2. Partial Ring PET Scanners
- 7.2. Market Analysis, Insights and Forecast - by Application
- 7.2.1. Cardiology
- 7.2.2. Neurology
- 7.2.3. Oncology
- 7.2.4. Other Applications
- 7.3. Market Analysis, Insights and Forecast - by End-User
- 7.3.1. Hospitals
- 7.3.2. Diagnostic Centers
- 7.3.3. Other End-Users
- 7.1. Market Analysis, Insights and Forecast - by Product Type
- 8. Asia Pacific PET Scanner Industry Analysis, Insights and Forecast, 2019-2031
- 8.1. Market Analysis, Insights and Forecast - by Product Type
- 8.1.1. Full Ring PET Scanners
- 8.1.2. Partial Ring PET Scanners
- 8.2. Market Analysis, Insights and Forecast - by Application
- 8.2.1. Cardiology
- 8.2.2. Neurology
- 8.2.3. Oncology
- 8.2.4. Other Applications
- 8.3. Market Analysis, Insights and Forecast - by End-User
- 8.3.1. Hospitals
- 8.3.2. Diagnostic Centers
- 8.3.3. Other End-Users
- 8.1. Market Analysis, Insights and Forecast - by Product Type
- 9. Middle East and Africa PET Scanner Industry Analysis, Insights and Forecast, 2019-2031
- 9.1. Market Analysis, Insights and Forecast - by Product Type
- 9.1.1. Full Ring PET Scanners
- 9.1.2. Partial Ring PET Scanners
- 9.2. Market Analysis, Insights and Forecast - by Application
- 9.2.1. Cardiology
- 9.2.2. Neurology
- 9.2.3. Oncology
- 9.2.4. Other Applications
- 9.3. Market Analysis, Insights and Forecast - by End-User
- 9.3.1. Hospitals
- 9.3.2. Diagnostic Centers
- 9.3.3. Other End-Users
- 9.1. Market Analysis, Insights and Forecast - by Product Type
- 10. South America PET Scanner Industry Analysis, Insights and Forecast, 2019-2031
- 10.1. Market Analysis, Insights and Forecast - by Product Type
- 10.1.1. Full Ring PET Scanners
- 10.1.2. Partial Ring PET Scanners
- 10.2. Market Analysis, Insights and Forecast - by Application
- 10.2.1. Cardiology
- 10.2.2. Neurology
- 10.2.3. Oncology
- 10.2.4. Other Applications
- 10.3. Market Analysis, Insights and Forecast - by End-User
- 10.3.1. Hospitals
- 10.3.2. Diagnostic Centers
- 10.3.3. Other End-Users
- 10.1. Market Analysis, Insights and Forecast - by Product Type
- 11. North America PET Scanner Industry Analysis, Insights and Forecast, 2019-2031
- 11.1. Market Analysis, Insights and Forecast - By Country/Sub-region
- 11.1.1 United States
- 11.1.2 Canada
- 11.1.3 Mexico
- 12. Europe PET Scanner Industry Analysis, Insights and Forecast, 2019-2031
- 12.1. Market Analysis, Insights and Forecast - By Country/Sub-region
- 12.1.1 Germany
- 12.1.2 United Kingdom
- 12.1.3 France
- 12.1.4 Italy
- 12.1.5 Spain
- 12.1.6 Rest of Europe
- 13. Asia Pacific PET Scanner Industry Analysis, Insights and Forecast, 2019-2031
- 13.1. Market Analysis, Insights and Forecast - By Country/Sub-region
- 13.1.1 China
- 13.1.2 Japan
- 13.1.3 India
- 13.1.4 Australia
- 13.1.5 South Korea
- 13.1.6 Rest of Asia Pacific
- 14. Middle East and Africa PET Scanner Industry Analysis, Insights and Forecast, 2019-2031
- 14.1. Market Analysis, Insights and Forecast - By Country/Sub-region
- 14.1.1 GCC
- 14.1.2 South Africa
- 14.1.3 Rest of Middle East and Africa
- 15. South America PET Scanner Industry Analysis, Insights and Forecast, 2019-2031
- 15.1. Market Analysis, Insights and Forecast - By Country/Sub-region
- 15.1.1 Brazil
- 15.1.2 Argentina
- 15.1.3 Rest of South America
- 16. Competitive Analysis
- 16.1. Global Market Share Analysis 2024
- 16.2. Company Profiles
- 16.2.1 CMR Naviscan
- 16.2.1.1. Overview
- 16.2.1.2. Products
- 16.2.1.3. SWOT Analysis
- 16.2.1.4. Recent Developments
- 16.2.1.5. Financials (Based on Availability)
- 16.2.2 Oncovision
- 16.2.2.1. Overview
- 16.2.2.2. Products
- 16.2.2.3. SWOT Analysis
- 16.2.2.4. Recent Developments
- 16.2.2.5. Financials (Based on Availability)
- 16.2.3 Mediso Ltd
- 16.2.3.1. Overview
- 16.2.3.2. Products
- 16.2.3.3. SWOT Analysis
- 16.2.3.4. Recent Developments
- 16.2.3.5. Financials (Based on Availability)
- 16.2.4 Segami Corporation
- 16.2.4.1. Overview
- 16.2.4.2. Products
- 16.2.4.3. SWOT Analysis
- 16.2.4.4. Recent Developments
- 16.2.4.5. Financials (Based on Availability)
- 16.2.5 Agfa Healthcare
- 16.2.5.1. Overview
- 16.2.5.2. Products
- 16.2.5.3. SWOT Analysis
- 16.2.5.4. Recent Developments
- 16.2.5.5. Financials (Based on Availability)
- 16.2.6 Siemens Healthineers AG
- 16.2.6.1. Overview
- 16.2.6.2. Products
- 16.2.6.3. SWOT Analysis
- 16.2.6.4. Recent Developments
- 16.2.6.5. Financials (Based on Availability)
- 16.2.7 Cardinal Health
- 16.2.7.1. Overview
- 16.2.7.2. Products
- 16.2.7.3. SWOT Analysis
- 16.2.7.4. Recent Developments
- 16.2.7.5. Financials (Based on Availability)
- 16.2.8 General Electric Company (GE Healthcare)
- 16.2.8.1. Overview
- 16.2.8.2. Products
- 16.2.8.3. SWOT Analysis
- 16.2.8.4. Recent Developments
- 16.2.8.5. Financials (Based on Availability)
- 16.2.9 Koninklijke Philips NV
- 16.2.9.1. Overview
- 16.2.9.2. Products
- 16.2.9.3. SWOT Analysis
- 16.2.9.4. Recent Developments
- 16.2.9.5. Financials (Based on Availability)
- 16.2.10 Neusoft Corporation
- 16.2.10.1. Overview
- 16.2.10.2. Products
- 16.2.10.3. SWOT Analysis
- 16.2.10.4. Recent Developments
- 16.2.10.5. Financials (Based on Availability)
- 16.2.11 Biosensors International (Spectrum Dynamics Ltd)
- 16.2.11.1. Overview
- 16.2.11.2. Products
- 16.2.11.3. SWOT Analysis
- 16.2.11.4. Recent Developments
- 16.2.11.5. Financials (Based on Availability)
- 16.2.12 Positron Corporation
- 16.2.12.1. Overview
- 16.2.12.2. Products
- 16.2.12.3. SWOT Analysis
- 16.2.12.4. Recent Developments
- 16.2.12.5. Financials (Based on Availability)
- 16.2.1 CMR Naviscan
List of Figures
- Figure 1: Global PET Scanner Industry Revenue Breakdown (Million, %) by Region 2024 & 2032
- Figure 2: Global PET Scanner Industry Volume Breakdown (K Unit, %) by Region 2024 & 2032
- Figure 3: North America PET Scanner Industry Revenue (Million), by Country 2024 & 2032
- Figure 4: North America PET Scanner Industry Volume (K Unit), by Country 2024 & 2032
- Figure 5: North America PET Scanner Industry Revenue Share (%), by Country 2024 & 2032
- Figure 6: North America PET Scanner Industry Volume Share (%), by Country 2024 & 2032
- Figure 7: Europe PET Scanner Industry Revenue (Million), by Country 2024 & 2032
- Figure 8: Europe PET Scanner Industry Volume (K Unit), by Country 2024 & 2032
- Figure 9: Europe PET Scanner Industry Revenue Share (%), by Country 2024 & 2032
- Figure 10: Europe PET Scanner Industry Volume Share (%), by Country 2024 & 2032
- Figure 11: Asia Pacific PET Scanner Industry Revenue (Million), by Country 2024 & 2032
- Figure 12: Asia Pacific PET Scanner Industry Volume (K Unit), by Country 2024 & 2032
- Figure 13: Asia Pacific PET Scanner Industry Revenue Share (%), by Country 2024 & 2032
- Figure 14: Asia Pacific PET Scanner Industry Volume Share (%), by Country 2024 & 2032
- Figure 15: Middle East and Africa PET Scanner Industry Revenue (Million), by Country 2024 & 2032
- Figure 16: Middle East and Africa PET Scanner Industry Volume (K Unit), by Country 2024 & 2032
- Figure 17: Middle East and Africa PET Scanner Industry Revenue Share (%), by Country 2024 & 2032
- Figure 18: Middle East and Africa PET Scanner Industry Volume Share (%), by Country 2024 & 2032
- Figure 19: South America PET Scanner Industry Revenue (Million), by Country 2024 & 2032
- Figure 20: South America PET Scanner Industry Volume (K Unit), by Country 2024 & 2032
- Figure 21: South America PET Scanner Industry Revenue Share (%), by Country 2024 & 2032
- Figure 22: South America PET Scanner Industry Volume Share (%), by Country 2024 & 2032
- Figure 23: North America PET Scanner Industry Revenue (Million), by Product Type 2024 & 2032
- Figure 24: North America PET Scanner Industry Volume (K Unit), by Product Type 2024 & 2032
- Figure 25: North America PET Scanner Industry Revenue Share (%), by Product Type 2024 & 2032
- Figure 26: North America PET Scanner Industry Volume Share (%), by Product Type 2024 & 2032
- Figure 27: North America PET Scanner Industry Revenue (Million), by Application 2024 & 2032
- Figure 28: North America PET Scanner Industry Volume (K Unit), by Application 2024 & 2032
- Figure 29: North America PET Scanner Industry Revenue Share (%), by Application 2024 & 2032
- Figure 30: North America PET Scanner Industry Volume Share (%), by Application 2024 & 2032
- Figure 31: North America PET Scanner Industry Revenue (Million), by End-User 2024 & 2032
- Figure 32: North America PET Scanner Industry Volume (K Unit), by End-User 2024 & 2032
- Figure 33: North America PET Scanner Industry Revenue Share (%), by End-User 2024 & 2032
- Figure 34: North America PET Scanner Industry Volume Share (%), by End-User 2024 & 2032
- Figure 35: North America PET Scanner Industry Revenue (Million), by Country 2024 & 2032
- Figure 36: North America PET Scanner Industry Volume (K Unit), by Country 2024 & 2032
- Figure 37: North America PET Scanner Industry Revenue Share (%), by Country 2024 & 2032
- Figure 38: North America PET Scanner Industry Volume Share (%), by Country 2024 & 2032
- Figure 39: Europe PET Scanner Industry Revenue (Million), by Product Type 2024 & 2032
- Figure 40: Europe PET Scanner Industry Volume (K Unit), by Product Type 2024 & 2032
- Figure 41: Europe PET Scanner Industry Revenue Share (%), by Product Type 2024 & 2032
- Figure 42: Europe PET Scanner Industry Volume Share (%), by Product Type 2024 & 2032
- Figure 43: Europe PET Scanner Industry Revenue (Million), by Application 2024 & 2032
- Figure 44: Europe PET Scanner Industry Volume (K Unit), by Application 2024 & 2032
- Figure 45: Europe PET Scanner Industry Revenue Share (%), by Application 2024 & 2032
- Figure 46: Europe PET Scanner Industry Volume Share (%), by Application 2024 & 2032
- Figure 47: Europe PET Scanner Industry Revenue (Million), by End-User 2024 & 2032
- Figure 48: Europe PET Scanner Industry Volume (K Unit), by End-User 2024 & 2032
- Figure 49: Europe PET Scanner Industry Revenue Share (%), by End-User 2024 & 2032
- Figure 50: Europe PET Scanner Industry Volume Share (%), by End-User 2024 & 2032
- Figure 51: Europe PET Scanner Industry Revenue (Million), by Country 2024 & 2032
- Figure 52: Europe PET Scanner Industry Volume (K Unit), by Country 2024 & 2032
- Figure 53: Europe PET Scanner Industry Revenue Share (%), by Country 2024 & 2032
- Figure 54: Europe PET Scanner Industry Volume Share (%), by Country 2024 & 2032
- Figure 55: Asia Pacific PET Scanner Industry Revenue (Million), by Product Type 2024 & 2032
- Figure 56: Asia Pacific PET Scanner Industry Volume (K Unit), by Product Type 2024 & 2032
- Figure 57: Asia Pacific PET Scanner Industry Revenue Share (%), by Product Type 2024 & 2032
- Figure 58: Asia Pacific PET Scanner Industry Volume Share (%), by Product Type 2024 & 2032
- Figure 59: Asia Pacific PET Scanner Industry Revenue (Million), by Application 2024 & 2032
- Figure 60: Asia Pacific PET Scanner Industry Volume (K Unit), by Application 2024 & 2032
- Figure 61: Asia Pacific PET Scanner Industry Revenue Share (%), by Application 2024 & 2032
- Figure 62: Asia Pacific PET Scanner Industry Volume Share (%), by Application 2024 & 2032
- Figure 63: Asia Pacific PET Scanner Industry Revenue (Million), by End-User 2024 & 2032
- Figure 64: Asia Pacific PET Scanner Industry Volume (K Unit), by End-User 2024 & 2032
- Figure 65: Asia Pacific PET Scanner Industry Revenue Share (%), by End-User 2024 & 2032
- Figure 66: Asia Pacific PET Scanner Industry Volume Share (%), by End-User 2024 & 2032
- Figure 67: Asia Pacific PET Scanner Industry Revenue (Million), by Country 2024 & 2032
- Figure 68: Asia Pacific PET Scanner Industry Volume (K Unit), by Country 2024 & 2032
- Figure 69: Asia Pacific PET Scanner Industry Revenue Share (%), by Country 2024 & 2032
- Figure 70: Asia Pacific PET Scanner Industry Volume Share (%), by Country 2024 & 2032
- Figure 71: Middle East and Africa PET Scanner Industry Revenue (Million), by Product Type 2024 & 2032
- Figure 72: Middle East and Africa PET Scanner Industry Volume (K Unit), by Product Type 2024 & 2032
- Figure 73: Middle East and Africa PET Scanner Industry Revenue Share (%), by Product Type 2024 & 2032
- Figure 74: Middle East and Africa PET Scanner Industry Volume Share (%), by Product Type 2024 & 2032
- Figure 75: Middle East and Africa PET Scanner Industry Revenue (Million), by Application 2024 & 2032
- Figure 76: Middle East and Africa PET Scanner Industry Volume (K Unit), by Application 2024 & 2032
- Figure 77: Middle East and Africa PET Scanner Industry Revenue Share (%), by Application 2024 & 2032
- Figure 78: Middle East and Africa PET Scanner Industry Volume Share (%), by Application 2024 & 2032
- Figure 79: Middle East and Africa PET Scanner Industry Revenue (Million), by End-User 2024 & 2032
- Figure 80: Middle East and Africa PET Scanner Industry Volume (K Unit), by End-User 2024 & 2032
- Figure 81: Middle East and Africa PET Scanner Industry Revenue Share (%), by End-User 2024 & 2032
- Figure 82: Middle East and Africa PET Scanner Industry Volume Share (%), by End-User 2024 & 2032
- Figure 83: Middle East and Africa PET Scanner Industry Revenue (Million), by Country 2024 & 2032
- Figure 84: Middle East and Africa PET Scanner Industry Volume (K Unit), by Country 2024 & 2032
- Figure 85: Middle East and Africa PET Scanner Industry Revenue Share (%), by Country 2024 & 2032
- Figure 86: Middle East and Africa PET Scanner Industry Volume Share (%), by Country 2024 & 2032
- Figure 87: South America PET Scanner Industry Revenue (Million), by Product Type 2024 & 2032
- Figure 88: South America PET Scanner Industry Volume (K Unit), by Product Type 2024 & 2032
- Figure 89: South America PET Scanner Industry Revenue Share (%), by Product Type 2024 & 2032
- Figure 90: South America PET Scanner Industry Volume Share (%), by Product Type 2024 & 2032
- Figure 91: South America PET Scanner Industry Revenue (Million), by Application 2024 & 2032
- Figure 92: South America PET Scanner Industry Volume (K Unit), by Application 2024 & 2032
- Figure 93: South America PET Scanner Industry Revenue Share (%), by Application 2024 & 2032
- Figure 94: South America PET Scanner Industry Volume Share (%), by Application 2024 & 2032
- Figure 95: South America PET Scanner Industry Revenue (Million), by End-User 2024 & 2032
- Figure 96: South America PET Scanner Industry Volume (K Unit), by End-User 2024 & 2032
- Figure 97: South America PET Scanner Industry Revenue Share (%), by End-User 2024 & 2032
- Figure 98: South America PET Scanner Industry Volume Share (%), by End-User 2024 & 2032
- Figure 99: South America PET Scanner Industry Revenue (Million), by Country 2024 & 2032
- Figure 100: South America PET Scanner Industry Volume (K Unit), by Country 2024 & 2032
- Figure 101: South America PET Scanner Industry Revenue Share (%), by Country 2024 & 2032
- Figure 102: South America PET Scanner Industry Volume Share (%), by Country 2024 & 2032
List of Tables
- Table 1: Global PET Scanner Industry Revenue Million Forecast, by Region 2019 & 2032
- Table 2: Global PET Scanner Industry Volume K Unit Forecast, by Region 2019 & 2032
- Table 3: Global PET Scanner Industry Revenue Million Forecast, by Product Type 2019 & 2032
- Table 4: Global PET Scanner Industry Volume K Unit Forecast, by Product Type 2019 & 2032
- Table 5: Global PET Scanner Industry Revenue Million Forecast, by Application 2019 & 2032
- Table 6: Global PET Scanner Industry Volume K Unit Forecast, by Application 2019 & 2032
- Table 7: Global PET Scanner Industry Revenue Million Forecast, by End-User 2019 & 2032
- Table 8: Global PET Scanner Industry Volume K Unit Forecast, by End-User 2019 & 2032
- Table 9: Global PET Scanner Industry Revenue Million Forecast, by Region 2019 & 2032
- Table 10: Global PET Scanner Industry Volume K Unit Forecast, by Region 2019 & 2032
- Table 11: Global PET Scanner Industry Revenue Million Forecast, by Country 2019 & 2032
- Table 12: Global PET Scanner Industry Volume K Unit Forecast, by Country 2019 & 2032
- Table 13: United States PET Scanner Industry Revenue (Million) Forecast, by Application 2019 & 2032
- Table 14: United States PET Scanner Industry Volume (K Unit) Forecast, by Application 2019 & 2032
- Table 15: Canada PET Scanner Industry Revenue (Million) Forecast, by Application 2019 & 2032
- Table 16: Canada PET Scanner Industry Volume (K Unit) Forecast, by Application 2019 & 2032
- Table 17: Mexico PET Scanner Industry Revenue (Million) Forecast, by Application 2019 & 2032
- Table 18: Mexico PET Scanner Industry Volume (K Unit) Forecast, by Application 2019 & 2032
- Table 19: Global PET Scanner Industry Revenue Million Forecast, by Country 2019 & 2032
- Table 20: Global PET Scanner Industry Volume K Unit Forecast, by Country 2019 & 2032
- Table 21: Germany PET Scanner Industry Revenue (Million) Forecast, by Application 2019 & 2032
- Table 22: Germany PET Scanner Industry Volume (K Unit) Forecast, by Application 2019 & 2032
- Table 23: United Kingdom PET Scanner Industry Revenue (Million) Forecast, by Application 2019 & 2032
- Table 24: United Kingdom PET Scanner Industry Volume (K Unit) Forecast, by Application 2019 & 2032
- Table 25: France PET Scanner Industry Revenue (Million) Forecast, by Application 2019 & 2032
- Table 26: France PET Scanner Industry Volume (K Unit) Forecast, by Application 2019 & 2032
- Table 27: Italy PET Scanner Industry Revenue (Million) Forecast, by Application 2019 & 2032
- Table 28: Italy PET Scanner Industry Volume (K Unit) Forecast, by Application 2019 & 2032
- Table 29: Spain PET Scanner Industry Revenue (Million) Forecast, by Application 2019 & 2032
- Table 30: Spain PET Scanner Industry Volume (K Unit) Forecast, by Application 2019 & 2032
- Table 31: Rest of Europe PET Scanner Industry Revenue (Million) Forecast, by Application 2019 & 2032
- Table 32: Rest of Europe PET Scanner Industry Volume (K Unit) Forecast, by Application 2019 & 2032
- Table 33: Global PET Scanner Industry Revenue Million Forecast, by Country 2019 & 2032
- Table 34: Global PET Scanner Industry Volume K Unit Forecast, by Country 2019 & 2032
- Table 35: China PET Scanner Industry Revenue (Million) Forecast, by Application 2019 & 2032
- Table 36: China PET Scanner Industry Volume (K Unit) Forecast, by Application 2019 & 2032
- Table 37: Japan PET Scanner Industry Revenue (Million) Forecast, by Application 2019 & 2032
- Table 38: Japan PET Scanner Industry Volume (K Unit) Forecast, by Application 2019 & 2032
- Table 39: India PET Scanner Industry Revenue (Million) Forecast, by Application 2019 & 2032
- Table 40: India PET Scanner Industry Volume (K Unit) Forecast, by Application 2019 & 2032
- Table 41: Australia PET Scanner Industry Revenue (Million) Forecast, by Application 2019 & 2032
- Table 42: Australia PET Scanner Industry Volume (K Unit) Forecast, by Application 2019 & 2032
- Table 43: South Korea PET Scanner Industry Revenue (Million) Forecast, by Application 2019 & 2032
- Table 44: South Korea PET Scanner Industry Volume (K Unit) Forecast, by Application 2019 & 2032
- Table 45: Rest of Asia Pacific PET Scanner Industry Revenue (Million) Forecast, by Application 2019 & 2032
- Table 46: Rest of Asia Pacific PET Scanner Industry Volume (K Unit) Forecast, by Application 2019 & 2032
- Table 47: Global PET Scanner Industry Revenue Million Forecast, by Country 2019 & 2032
- Table 48: Global PET Scanner Industry Volume K Unit Forecast, by Country 2019 & 2032
- Table 49: GCC PET Scanner Industry Revenue (Million) Forecast, by Application 2019 & 2032
- Table 50: GCC PET Scanner Industry Volume (K Unit) Forecast, by Application 2019 & 2032
- Table 51: South Africa PET Scanner Industry Revenue (Million) Forecast, by Application 2019 & 2032
- Table 52: South Africa PET Scanner Industry Volume (K Unit) Forecast, by Application 2019 & 2032
- Table 53: Rest of Middle East and Africa PET Scanner Industry Revenue (Million) Forecast, by Application 2019 & 2032
- Table 54: Rest of Middle East and Africa PET Scanner Industry Volume (K Unit) Forecast, by Application 2019 & 2032
- Table 55: Global PET Scanner Industry Revenue Million Forecast, by Country 2019 & 2032
- Table 56: Global PET Scanner Industry Volume K Unit Forecast, by Country 2019 & 2032
- Table 57: Brazil PET Scanner Industry Revenue (Million) Forecast, by Application 2019 & 2032
- Table 58: Brazil PET Scanner Industry Volume (K Unit) Forecast, by Application 2019 & 2032
- Table 59: Argentina PET Scanner Industry Revenue (Million) Forecast, by Application 2019 & 2032
- Table 60: Argentina PET Scanner Industry Volume (K Unit) Forecast, by Application 2019 & 2032
- Table 61: Rest of South America PET Scanner Industry Revenue (Million) Forecast, by Application 2019 & 2032
- Table 62: Rest of South America PET Scanner Industry Volume (K Unit) Forecast, by Application 2019 & 2032
- Table 63: Global PET Scanner Industry Revenue Million Forecast, by Product Type 2019 & 2032
- Table 64: Global PET Scanner Industry Volume K Unit Forecast, by Product Type 2019 & 2032
- Table 65: Global PET Scanner Industry Revenue Million Forecast, by Application 2019 & 2032
- Table 66: Global PET Scanner Industry Volume K Unit Forecast, by Application 2019 & 2032
- Table 67: Global PET Scanner Industry Revenue Million Forecast, by End-User 2019 & 2032
- Table 68: Global PET Scanner Industry Volume K Unit Forecast, by End-User 2019 & 2032
- Table 69: Global PET Scanner Industry Revenue Million Forecast, by Country 2019 & 2032
- Table 70: Global PET Scanner Industry Volume K Unit Forecast, by Country 2019 & 2032
- Table 71: United States PET Scanner Industry Revenue (Million) Forecast, by Application 2019 & 2032
- Table 72: United States PET Scanner Industry Volume (K Unit) Forecast, by Application 2019 & 2032
- Table 73: Canada PET Scanner Industry Revenue (Million) Forecast, by Application 2019 & 2032
- Table 74: Canada PET Scanner Industry Volume (K Unit) Forecast, by Application 2019 & 2032
- Table 75: Mexico PET Scanner Industry Revenue (Million) Forecast, by Application 2019 & 2032
- Table 76: Mexico PET Scanner Industry Volume (K Unit) Forecast, by Application 2019 & 2032
- Table 77: Global PET Scanner Industry Revenue Million Forecast, by Product Type 2019 & 2032
- Table 78: Global PET Scanner Industry Volume K Unit Forecast, by Product Type 2019 & 2032
- Table 79: Global PET Scanner Industry Revenue Million Forecast, by Application 2019 & 2032
- Table 80: Global PET Scanner Industry Volume K Unit Forecast, by Application 2019 & 2032
- Table 81: Global PET Scanner Industry Revenue Million Forecast, by End-User 2019 & 2032
- Table 82: Global PET Scanner Industry Volume K Unit Forecast, by End-User 2019 & 2032
- Table 83: Global PET Scanner Industry Revenue Million Forecast, by Country 2019 & 2032
- Table 84: Global PET Scanner Industry Volume K Unit Forecast, by Country 2019 & 2032
- Table 85: Germany PET Scanner Industry Revenue (Million) Forecast, by Application 2019 & 2032
- Table 86: Germany PET Scanner Industry Volume (K Unit) Forecast, by Application 2019 & 2032
- Table 87: United Kingdom PET Scanner Industry Revenue (Million) Forecast, by Application 2019 & 2032
- Table 88: United Kingdom PET Scanner Industry Volume (K Unit) Forecast, by Application 2019 & 2032
- Table 89: France PET Scanner Industry Revenue (Million) Forecast, by Application 2019 & 2032
- Table 90: France PET Scanner Industry Volume (K Unit) Forecast, by Application 2019 & 2032
- Table 91: Italy PET Scanner Industry Revenue (Million) Forecast, by Application 2019 & 2032
- Table 92: Italy PET Scanner Industry Volume (K Unit) Forecast, by Application 2019 & 2032
- Table 93: Spain PET Scanner Industry Revenue (Million) Forecast, by Application 2019 & 2032
- Table 94: Spain PET Scanner Industry Volume (K Unit) Forecast, by Application 2019 & 2032
- Table 95: Rest of Europe PET Scanner Industry Revenue (Million) Forecast, by Application 2019 & 2032
- Table 96: Rest of Europe PET Scanner Industry Volume (K Unit) Forecast, by Application 2019 & 2032
- Table 97: Global PET Scanner Industry Revenue Million Forecast, by Product Type 2019 & 2032
- Table 98: Global PET Scanner Industry Volume K Unit Forecast, by Product Type 2019 & 2032
- Table 99: Global PET Scanner Industry Revenue Million Forecast, by Application 2019 & 2032
- Table 100: Global PET Scanner Industry Volume K Unit Forecast, by Application 2019 & 2032
- Table 101: Global PET Scanner Industry Revenue Million Forecast, by End-User 2019 & 2032
- Table 102: Global PET Scanner Industry Volume K Unit Forecast, by End-User 2019 & 2032
- Table 103: Global PET Scanner Industry Revenue Million Forecast, by Country 2019 & 2032
- Table 104: Global PET Scanner Industry Volume K Unit Forecast, by Country 2019 & 2032
- Table 105: China PET Scanner Industry Revenue (Million) Forecast, by Application 2019 & 2032
- Table 106: China PET Scanner Industry Volume (K Unit) Forecast, by Application 2019 & 2032
- Table 107: Japan PET Scanner Industry Revenue (Million) Forecast, by Application 2019 & 2032
- Table 108: Japan PET Scanner Industry Volume (K Unit) Forecast, by Application 2019 & 2032
- Table 109: India PET Scanner Industry Revenue (Million) Forecast, by Application 2019 & 2032
- Table 110: India PET Scanner Industry Volume (K Unit) Forecast, by Application 2019 & 2032
- Table 111: Australia PET Scanner Industry Revenue (Million) Forecast, by Application 2019 & 2032
- Table 112: Australia PET Scanner Industry Volume (K Unit) Forecast, by Application 2019 & 2032
- Table 113: South Korea PET Scanner Industry Revenue (Million) Forecast, by Application 2019 & 2032
- Table 114: South Korea PET Scanner Industry Volume (K Unit) Forecast, by Application 2019 & 2032
- Table 115: Rest of Asia Pacific PET Scanner Industry Revenue (Million) Forecast, by Application 2019 & 2032
- Table 116: Rest of Asia Pacific PET Scanner Industry Volume (K Unit) Forecast, by Application 2019 & 2032
- Table 117: Global PET Scanner Industry Revenue Million Forecast, by Product Type 2019 & 2032
- Table 118: Global PET Scanner Industry Volume K Unit Forecast, by Product Type 2019 & 2032
- Table 119: Global PET Scanner Industry Revenue Million Forecast, by Application 2019 & 2032
- Table 120: Global PET Scanner Industry Volume K Unit Forecast, by Application 2019 & 2032
- Table 121: Global PET Scanner Industry Revenue Million Forecast, by End-User 2019 & 2032
- Table 122: Global PET Scanner Industry Volume K Unit Forecast, by End-User 2019 & 2032
- Table 123: Global PET Scanner Industry Revenue Million Forecast, by Country 2019 & 2032
- Table 124: Global PET Scanner Industry Volume K Unit Forecast, by Country 2019 & 2032
- Table 125: GCC PET Scanner Industry Revenue (Million) Forecast, by Application 2019 & 2032
- Table 126: GCC PET Scanner Industry Volume (K Unit) Forecast, by Application 2019 & 2032
- Table 127: South Africa PET Scanner Industry Revenue (Million) Forecast, by Application 2019 & 2032
- Table 128: South Africa PET Scanner Industry Volume (K Unit) Forecast, by Application 2019 & 2032
- Table 129: Rest of Middle East and Africa PET Scanner Industry Revenue (Million) Forecast, by Application 2019 & 2032
- Table 130: Rest of Middle East and Africa PET Scanner Industry Volume (K Unit) Forecast, by Application 2019 & 2032
- Table 131: Global PET Scanner Industry Revenue Million Forecast, by Product Type 2019 & 2032
- Table 132: Global PET Scanner Industry Volume K Unit Forecast, by Product Type 2019 & 2032
- Table 133: Global PET Scanner Industry Revenue Million Forecast, by Application 2019 & 2032
- Table 134: Global PET Scanner Industry Volume K Unit Forecast, by Application 2019 & 2032
- Table 135: Global PET Scanner Industry Revenue Million Forecast, by End-User 2019 & 2032
- Table 136: Global PET Scanner Industry Volume K Unit Forecast, by End-User 2019 & 2032
- Table 137: Global PET Scanner Industry Revenue Million Forecast, by Country 2019 & 2032
- Table 138: Global PET Scanner Industry Volume K Unit Forecast, by Country 2019 & 2032
- Table 139: Brazil PET Scanner Industry Revenue (Million) Forecast, by Application 2019 & 2032
- Table 140: Brazil PET Scanner Industry Volume (K Unit) Forecast, by Application 2019 & 2032
- Table 141: Argentina PET Scanner Industry Revenue (Million) Forecast, by Application 2019 & 2032
- Table 142: Argentina PET Scanner Industry Volume (K Unit) Forecast, by Application 2019 & 2032
- Table 143: Rest of South America PET Scanner Industry Revenue (Million) Forecast, by Application 2019 & 2032
- Table 144: Rest of South America PET Scanner Industry Volume (K Unit) Forecast, by Application 2019 & 2032
Frequently Asked Questions
1. What is the projected Compound Annual Growth Rate (CAGR) of the PET Scanner Industry?
The projected CAGR is approximately 3.71%.
2. Which companies are prominent players in the PET Scanner Industry?
Key companies in the market include CMR Naviscan, Oncovision, Mediso Ltd, Segami Corporation, Agfa Healthcare, Siemens Healthineers AG, Cardinal Health, General Electric Company (GE Healthcare), Koninklijke Philips NV, Neusoft Corporation, Biosensors International (Spectrum Dynamics Ltd), Positron Corporation.
3. What are the main segments of the PET Scanner Industry?
The market segments include Product Type, Application, End-User.
4. Can you provide details about the market size?
The market size is estimated to be USD 1.09 Million as of 2022.
5. What are some drivers contributing to market growth?
Increasing Demand for PET Analysis in Radio Pharmaceuticals; Technological Advancements in PET Imaging for Oncology and Advanced Diagnostics Applications; Integration of X-ray Tomography (CT) into PET.
6. What are the notable trends driving market growth?
The Oncology Segment is Expected to Hold a Significant Market Share Over the Forecast Period.
7. Are there any restraints impacting market growth?
Shorter Half-life of Radioisotopes; Stringent Regulatory Guidelines.
8. Can you provide examples of recent developments in the market?
August 2022- Positron Corporation, a nuclear medicine PET imaging device system and clinical services company, purchased its first PET-CT system and was on its way from its partner Neusoft Medical Systems. Positron's "Affinity PET-CT" system is on its way from China to its validation partner in the United States.
9. What pricing options are available for accessing the report?
Pricing options include single-user, multi-user, and enterprise licenses priced at USD 4750, USD 5250, and USD 8750 respectively.
10. Is the market size provided in terms of value or volume?
The market size is provided in terms of value, measured in Million and volume, measured in K Unit.
11. Are there any specific market keywords associated with the report?
Yes, the market keyword associated with the report is "PET Scanner Industry," which aids in identifying and referencing the specific market segment covered.
12. How do I determine which pricing option suits my needs best?
The pricing options vary based on user requirements and access needs. Individual users may opt for single-user licenses, while businesses requiring broader access may choose multi-user or enterprise licenses for cost-effective access to the report.
13. Are there any additional resources or data provided in the PET Scanner Industry report?
While the report offers comprehensive insights, it's advisable to review the specific contents or supplementary materials provided to ascertain if additional resources or data are available.
14. How can I stay updated on further developments or reports in the PET Scanner Industry?
To stay informed about further developments, trends, and reports in the PET Scanner Industry, consider subscribing to industry newsletters, following relevant companies and organizations, or regularly checking reputable industry news sources and publications.
Methodology
Step 1 - Identification of Relevant Samples Size from Population Database


Step 2 - Approaches for Defining Global Market Size (Value, Volume* & Price*)

Note*: In applicable scenarios
Step 3 - Data Sources
Primary Research
- Web Analytics
- Survey Reports
- Research Institute
- Latest Research Reports
- Opinion Leaders
Secondary Research
- Annual Reports
- White Paper
- Latest Press Release
- Industry Association
- Paid Database
- Investor Presentations

Step 4 - Data Triangulation
Involves using different sources of information in order to increase the validity of a study
These sources are likely to be stakeholders in a program - participants, other researchers, program staff, other community members, and so on.
Then we put all data in single framework & apply various statistical tools to find out the dynamic on the market.
During the analysis stage, feedback from the stakeholder groups would be compared to determine areas of agreement as well as areas of divergence
