

Key Insights
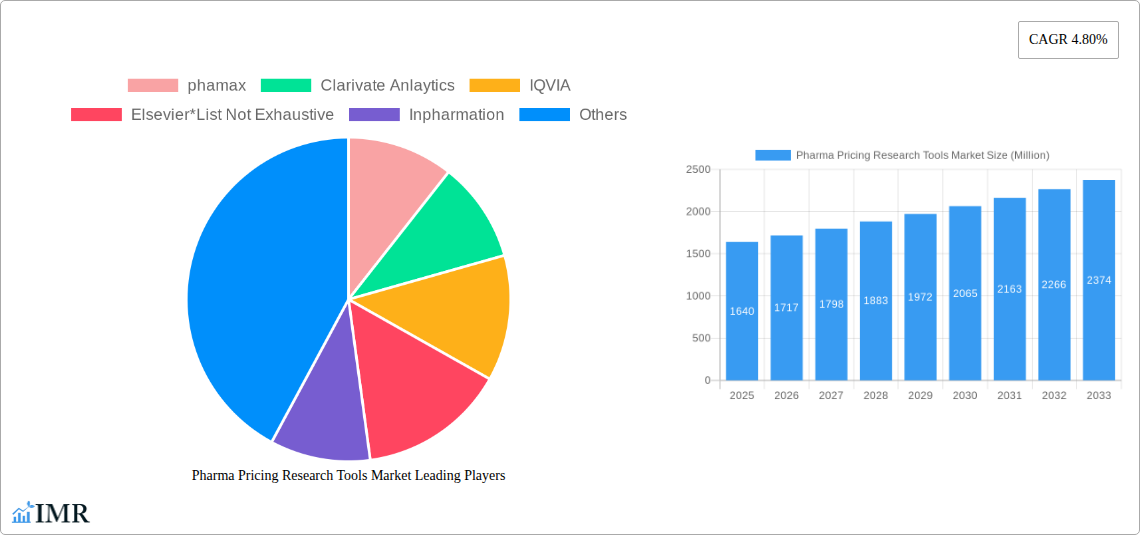
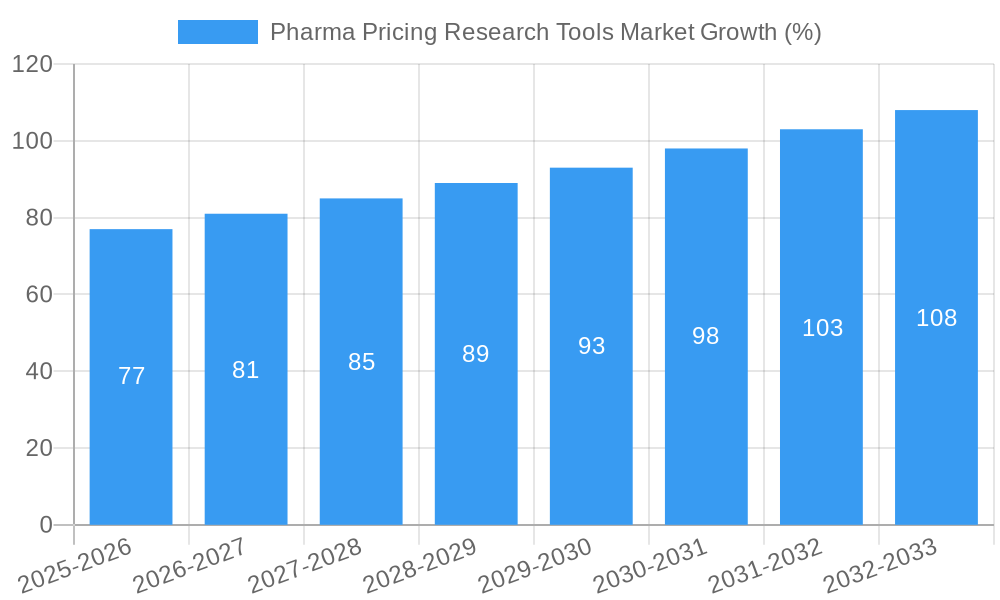
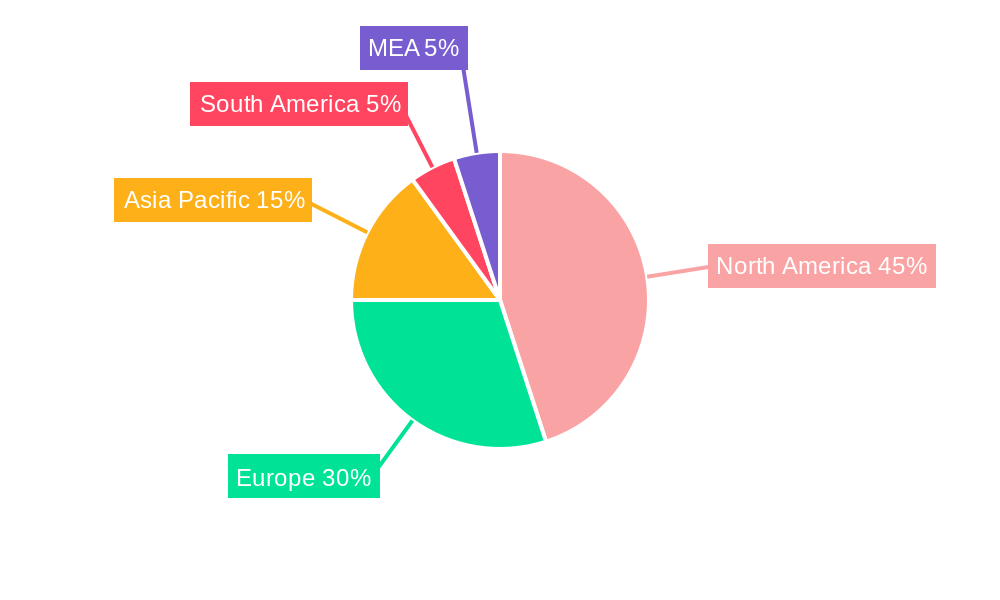
The Pharma Pricing Research Tools market, valued at $1.64 billion in 2025, is projected to experience robust growth, driven by the increasing complexity of pharmaceutical pricing and reimbursement models globally. The market's Compound Annual Growth Rate (CAGR) of 4.80% from 2025 to 2033 indicates a steady expansion, fueled by several key factors. Pharmaceutical companies are under increasing pressure to optimize pricing strategies, ensuring profitability while maintaining market access and addressing regulatory scrutiny. This necessitates sophisticated tools for analyzing pricing trends, competitor strategies, and the impact of various reimbursement schemes. The rising adoption of value-based pricing models, which focus on the clinical and economic value of drugs, further propels demand for advanced analytics and forecasting capabilities offered by these tools. Market segmentation reveals significant opportunities in both prescription and over-the-counter (OTC) drug pricing analysis, with market-based, value-based, and cost-based pricing tools all contributing to market growth. Leading players like Pharmax, Clarivate Analytics, IQVIA, and Elsevier are shaping the market landscape through continuous innovation and strategic partnerships. Geographic expansion is another vital trend, with North America currently holding a significant market share, followed by Europe and the Asia-Pacific region. However, emerging markets in Asia and South America present substantial growth potential due to increasing healthcare spending and regulatory changes.
The market faces certain challenges, primarily the high cost of these sophisticated tools and the need for specialized expertise to effectively utilize them. However, these challenges are outweighed by the growing imperative for pharmaceutical companies to maintain pricing competitiveness, ensure regulatory compliance, and demonstrate the value proposition of their products. The increasing integration of these tools with broader data analytics platforms and the development of artificial intelligence (AI)-powered pricing solutions will further accelerate market growth. Competitive dynamics are expected to remain intense, with existing players continually investing in research and development to enhance their offerings and new entrants entering niche segments. The long-term outlook for the Pharma Pricing Research Tools market remains positive, driven by ongoing technological advancements, changing regulatory landscapes, and the persistent need for data-driven decision-making in the pharmaceutical industry.
Pharma Pricing Research Tools Market: A Comprehensive Report (2019-2033)
This comprehensive report provides an in-depth analysis of the Pharma Pricing Research Tools Market, encompassing market dynamics, growth trends, regional dominance, product landscape, key players, and future outlook. The report covers the parent market of Pharmaceutical Research and the child market of Pricing Research Tools, offering a granular view of this crucial sector. The study period spans from 2019 to 2033, with 2025 serving as the base and estimated year. The market value is presented in million USD.
Pharma Pricing Research Tools Market Dynamics & Structure
The Pharma Pricing Research Tools Market is characterized by moderate concentration, with key players like Phamax, Clarivate Analytics, IQVIA, Elsevier, Inpharmation, Wolters Kluwer N.V., Veeva Systems, and Avalere Health LLC holding significant market share. However, the market exhibits a dynamic competitive landscape due to continuous technological advancements and the emergence of new players. The market is driven by the increasing need for sophisticated pricing strategies within the pharmaceutical industry, coupled with stringent regulatory frameworks and the growing adoption of value-based pricing models.
- Market Concentration: Moderately concentrated, with the top 5 players holding approximately xx% of the market share in 2025.
- Technological Innovation: Significant drivers include AI-powered pricing analytics, predictive modeling, and real-world evidence integration. Barriers include high initial investment costs and data security concerns.
- Regulatory Frameworks: Stringent regulatory compliance requirements across various geographies significantly influence pricing strategies and the demand for compliant research tools.
- Competitive Substitutes: Limited direct substitutes exist, but alternative analytical methods and in-house development present indirect competition.
- End-User Demographics: Primarily pharmaceutical companies, healthcare providers, and regulatory bodies constitute the end-user base.
- M&A Trends: The past five years have witnessed xx M&A deals, primarily focused on enhancing technological capabilities and expanding market reach.
Pharma Pricing Research Tools Market Growth Trends & Insights
The Pharma Pricing Research Tools Market is experiencing robust growth, driven by factors such as the increasing adoption of value-based pricing, the rising complexity of drug development and pricing regulations, and the growing demand for data-driven decision-making in the pharmaceutical industry. The market size is projected to reach xx million USD in 2025, exhibiting a CAGR of xx% during the forecast period (2025-2033). Technological advancements, such as the integration of AI and machine learning, are accelerating market penetration and driving adoption rates. Consumer behavior shifts towards increased transparency and value-based care further fuel market expansion. The market witnessed a significant increase in the adoption of cloud-based solutions, contributing to this growth.
Dominant Regions, Countries, or Segments in Pharma Pricing Research Tools Market
North America currently dominates the Pharma Pricing Research Tools Market, followed by Europe and Asia Pacific. This dominance is attributed to factors such as robust healthcare infrastructure, high pharmaceutical spending, and advanced technological adoption in these regions. Within the segments:
- By Type: Value-based pricing is the fastest-growing segment, driven by the increasing focus on patient outcomes and cost-effectiveness.
- By Application: The prescription drugs segment holds the largest market share due to the higher complexity and regulatory scrutiny associated with prescription drug pricing.
Key Drivers:
- North America: Strong regulatory push towards value-based care, coupled with high pharmaceutical expenditure.
- Europe: Increasing adoption of advanced analytics and stringent pricing regulations.
- Asia Pacific: Growing healthcare expenditure and rising demand for efficient pricing strategies.
Pharma Pricing Research Tools Market Product Landscape
The market offers a wide range of tools, from basic pricing databases to sophisticated AI-powered platforms. These tools vary in functionality, encompassing data analytics, predictive modeling, regulatory compliance support, and real-world evidence integration. Key innovations include advanced algorithms that facilitate more accurate pricing analysis, intuitive user interfaces enhancing usability, and seamless integration with other healthcare data systems.
Key Drivers, Barriers & Challenges in Pharma Pricing Research Tools Market
Key Drivers:
- The increasing need for data-driven pricing strategies in the pharmaceutical industry.
- Growing adoption of value-based pricing models.
- Stringent regulatory requirements necessitating advanced pricing analytics tools.
Key Challenges:
- High cost of implementation and maintenance of advanced pricing software.
- Data security and privacy concerns.
- Competition from existing and emerging players.
- Complex regulatory landscape across different geographies.
Emerging Opportunities in Pharma Pricing Research Tools Market
Untapped opportunities lie in emerging markets with growing healthcare expenditure and expanding pharmaceutical industries. Furthermore, integrating real-world data and incorporating AI-powered predictive analytics into existing platforms represents significant growth potential. The increasing demand for personalized medicine creates opportunities for specialized pricing tools catering to individual patient needs and outcomes.
Growth Accelerators in the Pharma Pricing Research Tools Market Industry
Technological advancements, especially in AI and machine learning, are key growth accelerators. Strategic partnerships between pharmaceutical companies and technology providers also contribute to market expansion. Expanding into emerging markets and developing innovative pricing solutions tailored to specific needs can further drive growth.
Key Players Shaping the Pharma Pricing Research Tools Market Market
- Phamax
- Clarivate Analytics
- IQVIA
- Elsevier
- Inpharmation
- Wolters Kluwer N.V.
- Veeva Systems
- Avalere Health LLC
Notable Milestones in Pharma Pricing Research Tools Market Sector
- 2021: Phamax launched its AI-powered pricing platform.
- 2022: IQVIA and Elsevier partnered to integrate real-world data into their pricing analytics tools.
- 2023: Several smaller companies were acquired by larger players, consolidating the market.
In-Depth Pharma Pricing Research Tools Market Market Outlook
The Pharma Pricing Research Tools Market is poised for significant growth, driven by continuous technological innovation, evolving regulatory landscapes, and the increasing adoption of value-based pricing models. Strategic partnerships, expansion into new markets, and the development of sophisticated analytical tools will further fuel market expansion in the coming years. Companies that embrace innovation and adapt to the changing dynamics of the pharmaceutical industry are best positioned to capitalize on the growth opportunities presented by this evolving market.
Pharma Pricing Research Tools Market Segmentation
-
1. Application
- 1.1. Prescription Drugs
- 1.2. Over-the-counter Drugs
-
2. Type
- 2.1. Market-Based Pricing
- 2.2. Value-Based Pricing
- 2.3. Cost-based pricing
Pharma Pricing Research Tools Market Segmentation By Geography
-
1. North America
- 1.1. United States
- 1.2. Canada
- 1.3. Mexico
-
2. Europe
- 2.1. Germany
- 2.2. United Kingdom
- 2.3. France
- 2.4. Italy
- 2.5. Spain
- 2.6. Rest of Europe
- 3. Rest of the World
Pharma Pricing Research Tools Market REPORT HIGHLIGHTS
| Aspects | Details |
|---|---|
| Study Period | 2019-2033 |
| Base Year | 2024 |
| Estimated Year | 2025 |
| Forecast Period | 2025-2033 |
| Historical Period | 2019-2024 |
| Growth Rate | CAGR of 4.80% from 2019-2033 |
| Segmentation |
|
Table of Contents
- 1. Introduction
- 1.1. Research Scope
- 1.2. Market Segmentation
- 1.3. Research Methodology
- 1.4. Definitions and Assumptions
- 2. Executive Summary
- 2.1. Introduction
- 3. Market Dynamics
- 3.1. Introduction
- 3.2. Market Drivers
- 3.2.1. Increasing Complexity of Pharmaceutical Pricing; Rising Demand for Pricing Research & Analytics in Healthcare
- 3.3. Market Restrains
- 3.3.1. Lack of Standardization in Underdeveloped Countries
- 3.4. Market Trends
- 3.4.1. The Over-the-Counter Segment is Expected to Show Healthy Growth Over the Forecast Period
- 4. Market Factor Analysis
- 4.1. Porters Five Forces
- 4.2. Supply/Value Chain
- 4.3. PESTEL analysis
- 4.4. Market Entropy
- 4.5. Patent/Trademark Analysis
- 5. Global Pharma Pricing Research Tools Market Analysis, Insights and Forecast, 2019-2031
- 5.1. Market Analysis, Insights and Forecast - by Application
- 5.1.1. Prescription Drugs
- 5.1.2. Over-the-counter Drugs
- 5.2. Market Analysis, Insights and Forecast - by Type
- 5.2.1. Market-Based Pricing
- 5.2.2. Value-Based Pricing
- 5.2.3. Cost-based pricing
- 5.3. Market Analysis, Insights and Forecast - by Region
- 5.3.1. North America
- 5.3.2. Europe
- 5.3.3. Rest of the World
- 5.1. Market Analysis, Insights and Forecast - by Application
- 6. North America Pharma Pricing Research Tools Market Analysis, Insights and Forecast, 2019-2031
- 6.1. Market Analysis, Insights and Forecast - by Application
- 6.1.1. Prescription Drugs
- 6.1.2. Over-the-counter Drugs
- 6.2. Market Analysis, Insights and Forecast - by Type
- 6.2.1. Market-Based Pricing
- 6.2.2. Value-Based Pricing
- 6.2.3. Cost-based pricing
- 6.1. Market Analysis, Insights and Forecast - by Application
- 7. Europe Pharma Pricing Research Tools Market Analysis, Insights and Forecast, 2019-2031
- 7.1. Market Analysis, Insights and Forecast - by Application
- 7.1.1. Prescription Drugs
- 7.1.2. Over-the-counter Drugs
- 7.2. Market Analysis, Insights and Forecast - by Type
- 7.2.1. Market-Based Pricing
- 7.2.2. Value-Based Pricing
- 7.2.3. Cost-based pricing
- 7.1. Market Analysis, Insights and Forecast - by Application
- 8. Rest of the World Pharma Pricing Research Tools Market Analysis, Insights and Forecast, 2019-2031
- 8.1. Market Analysis, Insights and Forecast - by Application
- 8.1.1. Prescription Drugs
- 8.1.2. Over-the-counter Drugs
- 8.2. Market Analysis, Insights and Forecast - by Type
- 8.2.1. Market-Based Pricing
- 8.2.2. Value-Based Pricing
- 8.2.3. Cost-based pricing
- 8.1. Market Analysis, Insights and Forecast - by Application
- 9. North America Pharma Pricing Research Tools Market Analysis, Insights and Forecast, 2019-2031
- 9.1. Market Analysis, Insights and Forecast - By Country/Sub-region
- 9.1.1 United States
- 9.1.2 Canada
- 9.1.3 Mexico
- 10. Europe Pharma Pricing Research Tools Market Analysis, Insights and Forecast, 2019-2031
- 10.1. Market Analysis, Insights and Forecast - By Country/Sub-region
- 10.1.1 Germany
- 10.1.2 United Kingdom
- 10.1.3 France
- 10.1.4 Spain
- 10.1.5 Italy
- 10.1.6 Spain
- 10.1.7 Belgium
- 10.1.8 Netherland
- 10.1.9 Nordics
- 10.1.10 Rest of Europe
- 11. Asia Pacific Pharma Pricing Research Tools Market Analysis, Insights and Forecast, 2019-2031
- 11.1. Market Analysis, Insights and Forecast - By Country/Sub-region
- 11.1.1 China
- 11.1.2 Japan
- 11.1.3 India
- 11.1.4 South Korea
- 11.1.5 Southeast Asia
- 11.1.6 Australia
- 11.1.7 Indonesia
- 11.1.8 Phillipes
- 11.1.9 Singapore
- 11.1.10 Thailandc
- 11.1.11 Rest of Asia Pacific
- 12. South America Pharma Pricing Research Tools Market Analysis, Insights and Forecast, 2019-2031
- 12.1. Market Analysis, Insights and Forecast - By Country/Sub-region
- 12.1.1 Brazil
- 12.1.2 Argentina
- 12.1.3 Peru
- 12.1.4 Chile
- 12.1.5 Colombia
- 12.1.6 Ecuador
- 12.1.7 Venezuela
- 12.1.8 Rest of South America
- 13. North America Pharma Pricing Research Tools Market Analysis, Insights and Forecast, 2019-2031
- 13.1. Market Analysis, Insights and Forecast - By Country/Sub-region
- 13.1.1 United States
- 13.1.2 Canada
- 13.1.3 Mexico
- 14. MEA Pharma Pricing Research Tools Market Analysis, Insights and Forecast, 2019-2031
- 14.1. Market Analysis, Insights and Forecast - By Country/Sub-region
- 14.1.1 United Arab Emirates
- 14.1.2 Saudi Arabia
- 14.1.3 South Africa
- 14.1.4 Rest of Middle East and Africa
- 15. Competitive Analysis
- 15.1. Global Market Share Analysis 2024
- 15.2. Company Profiles
- 15.2.1 phamax
- 15.2.1.1. Overview
- 15.2.1.2. Products
- 15.2.1.3. SWOT Analysis
- 15.2.1.4. Recent Developments
- 15.2.1.5. Financials (Based on Availability)
- 15.2.2 Clarivate Anlaytics
- 15.2.2.1. Overview
- 15.2.2.2. Products
- 15.2.2.3. SWOT Analysis
- 15.2.2.4. Recent Developments
- 15.2.2.5. Financials (Based on Availability)
- 15.2.3 IQVIA
- 15.2.3.1. Overview
- 15.2.3.2. Products
- 15.2.3.3. SWOT Analysis
- 15.2.3.4. Recent Developments
- 15.2.3.5. Financials (Based on Availability)
- 15.2.4 Elsevier*List Not Exhaustive
- 15.2.4.1. Overview
- 15.2.4.2. Products
- 15.2.4.3. SWOT Analysis
- 15.2.4.4. Recent Developments
- 15.2.4.5. Financials (Based on Availability)
- 15.2.5 Inpharmation
- 15.2.5.1. Overview
- 15.2.5.2. Products
- 15.2.5.3. SWOT Analysis
- 15.2.5.4. Recent Developments
- 15.2.5.5. Financials (Based on Availability)
- 15.2.6 Wolters Kluwer N V
- 15.2.6.1. Overview
- 15.2.6.2. Products
- 15.2.6.3. SWOT Analysis
- 15.2.6.4. Recent Developments
- 15.2.6.5. Financials (Based on Availability)
- 15.2.7 Veeva Systems
- 15.2.7.1. Overview
- 15.2.7.2. Products
- 15.2.7.3. SWOT Analysis
- 15.2.7.4. Recent Developments
- 15.2.7.5. Financials (Based on Availability)
- 15.2.8 Avalere Health LLC
- 15.2.8.1. Overview
- 15.2.8.2. Products
- 15.2.8.3. SWOT Analysis
- 15.2.8.4. Recent Developments
- 15.2.8.5. Financials (Based on Availability)
- 15.2.1 phamax
List of Figures
- Figure 1: Global Pharma Pricing Research Tools Market Revenue Breakdown (Million, %) by Region 2024 & 2032
- Figure 2: North America Pharma Pricing Research Tools Market Revenue (Million), by Country 2024 & 2032
- Figure 3: North America Pharma Pricing Research Tools Market Revenue Share (%), by Country 2024 & 2032
- Figure 4: Europe Pharma Pricing Research Tools Market Revenue (Million), by Country 2024 & 2032
- Figure 5: Europe Pharma Pricing Research Tools Market Revenue Share (%), by Country 2024 & 2032
- Figure 6: Asia Pacific Pharma Pricing Research Tools Market Revenue (Million), by Country 2024 & 2032
- Figure 7: Asia Pacific Pharma Pricing Research Tools Market Revenue Share (%), by Country 2024 & 2032
- Figure 8: South America Pharma Pricing Research Tools Market Revenue (Million), by Country 2024 & 2032
- Figure 9: South America Pharma Pricing Research Tools Market Revenue Share (%), by Country 2024 & 2032
- Figure 10: North America Pharma Pricing Research Tools Market Revenue (Million), by Country 2024 & 2032
- Figure 11: North America Pharma Pricing Research Tools Market Revenue Share (%), by Country 2024 & 2032
- Figure 12: MEA Pharma Pricing Research Tools Market Revenue (Million), by Country 2024 & 2032
- Figure 13: MEA Pharma Pricing Research Tools Market Revenue Share (%), by Country 2024 & 2032
- Figure 14: North America Pharma Pricing Research Tools Market Revenue (Million), by Application 2024 & 2032
- Figure 15: North America Pharma Pricing Research Tools Market Revenue Share (%), by Application 2024 & 2032
- Figure 16: North America Pharma Pricing Research Tools Market Revenue (Million), by Type 2024 & 2032
- Figure 17: North America Pharma Pricing Research Tools Market Revenue Share (%), by Type 2024 & 2032
- Figure 18: North America Pharma Pricing Research Tools Market Revenue (Million), by Country 2024 & 2032
- Figure 19: North America Pharma Pricing Research Tools Market Revenue Share (%), by Country 2024 & 2032
- Figure 20: Europe Pharma Pricing Research Tools Market Revenue (Million), by Application 2024 & 2032
- Figure 21: Europe Pharma Pricing Research Tools Market Revenue Share (%), by Application 2024 & 2032
- Figure 22: Europe Pharma Pricing Research Tools Market Revenue (Million), by Type 2024 & 2032
- Figure 23: Europe Pharma Pricing Research Tools Market Revenue Share (%), by Type 2024 & 2032
- Figure 24: Europe Pharma Pricing Research Tools Market Revenue (Million), by Country 2024 & 2032
- Figure 25: Europe Pharma Pricing Research Tools Market Revenue Share (%), by Country 2024 & 2032
- Figure 26: Rest of the World Pharma Pricing Research Tools Market Revenue (Million), by Application 2024 & 2032
- Figure 27: Rest of the World Pharma Pricing Research Tools Market Revenue Share (%), by Application 2024 & 2032
- Figure 28: Rest of the World Pharma Pricing Research Tools Market Revenue (Million), by Type 2024 & 2032
- Figure 29: Rest of the World Pharma Pricing Research Tools Market Revenue Share (%), by Type 2024 & 2032
- Figure 30: Rest of the World Pharma Pricing Research Tools Market Revenue (Million), by Country 2024 & 2032
- Figure 31: Rest of the World Pharma Pricing Research Tools Market Revenue Share (%), by Country 2024 & 2032
List of Tables
- Table 1: Global Pharma Pricing Research Tools Market Revenue Million Forecast, by Region 2019 & 2032
- Table 2: Global Pharma Pricing Research Tools Market Revenue Million Forecast, by Application 2019 & 2032
- Table 3: Global Pharma Pricing Research Tools Market Revenue Million Forecast, by Type 2019 & 2032
- Table 4: Global Pharma Pricing Research Tools Market Revenue Million Forecast, by Region 2019 & 2032
- Table 5: Global Pharma Pricing Research Tools Market Revenue Million Forecast, by Country 2019 & 2032
- Table 6: United States Pharma Pricing Research Tools Market Revenue (Million) Forecast, by Application 2019 & 2032
- Table 7: Canada Pharma Pricing Research Tools Market Revenue (Million) Forecast, by Application 2019 & 2032
- Table 8: Mexico Pharma Pricing Research Tools Market Revenue (Million) Forecast, by Application 2019 & 2032
- Table 9: Global Pharma Pricing Research Tools Market Revenue Million Forecast, by Country 2019 & 2032
- Table 10: Germany Pharma Pricing Research Tools Market Revenue (Million) Forecast, by Application 2019 & 2032
- Table 11: United Kingdom Pharma Pricing Research Tools Market Revenue (Million) Forecast, by Application 2019 & 2032
- Table 12: France Pharma Pricing Research Tools Market Revenue (Million) Forecast, by Application 2019 & 2032
- Table 13: Spain Pharma Pricing Research Tools Market Revenue (Million) Forecast, by Application 2019 & 2032
- Table 14: Italy Pharma Pricing Research Tools Market Revenue (Million) Forecast, by Application 2019 & 2032
- Table 15: Spain Pharma Pricing Research Tools Market Revenue (Million) Forecast, by Application 2019 & 2032
- Table 16: Belgium Pharma Pricing Research Tools Market Revenue (Million) Forecast, by Application 2019 & 2032
- Table 17: Netherland Pharma Pricing Research Tools Market Revenue (Million) Forecast, by Application 2019 & 2032
- Table 18: Nordics Pharma Pricing Research Tools Market Revenue (Million) Forecast, by Application 2019 & 2032
- Table 19: Rest of Europe Pharma Pricing Research Tools Market Revenue (Million) Forecast, by Application 2019 & 2032
- Table 20: Global Pharma Pricing Research Tools Market Revenue Million Forecast, by Country 2019 & 2032
- Table 21: China Pharma Pricing Research Tools Market Revenue (Million) Forecast, by Application 2019 & 2032
- Table 22: Japan Pharma Pricing Research Tools Market Revenue (Million) Forecast, by Application 2019 & 2032
- Table 23: India Pharma Pricing Research Tools Market Revenue (Million) Forecast, by Application 2019 & 2032
- Table 24: South Korea Pharma Pricing Research Tools Market Revenue (Million) Forecast, by Application 2019 & 2032
- Table 25: Southeast Asia Pharma Pricing Research Tools Market Revenue (Million) Forecast, by Application 2019 & 2032
- Table 26: Australia Pharma Pricing Research Tools Market Revenue (Million) Forecast, by Application 2019 & 2032
- Table 27: Indonesia Pharma Pricing Research Tools Market Revenue (Million) Forecast, by Application 2019 & 2032
- Table 28: Phillipes Pharma Pricing Research Tools Market Revenue (Million) Forecast, by Application 2019 & 2032
- Table 29: Singapore Pharma Pricing Research Tools Market Revenue (Million) Forecast, by Application 2019 & 2032
- Table 30: Thailandc Pharma Pricing Research Tools Market Revenue (Million) Forecast, by Application 2019 & 2032
- Table 31: Rest of Asia Pacific Pharma Pricing Research Tools Market Revenue (Million) Forecast, by Application 2019 & 2032
- Table 32: Global Pharma Pricing Research Tools Market Revenue Million Forecast, by Country 2019 & 2032
- Table 33: Brazil Pharma Pricing Research Tools Market Revenue (Million) Forecast, by Application 2019 & 2032
- Table 34: Argentina Pharma Pricing Research Tools Market Revenue (Million) Forecast, by Application 2019 & 2032
- Table 35: Peru Pharma Pricing Research Tools Market Revenue (Million) Forecast, by Application 2019 & 2032
- Table 36: Chile Pharma Pricing Research Tools Market Revenue (Million) Forecast, by Application 2019 & 2032
- Table 37: Colombia Pharma Pricing Research Tools Market Revenue (Million) Forecast, by Application 2019 & 2032
- Table 38: Ecuador Pharma Pricing Research Tools Market Revenue (Million) Forecast, by Application 2019 & 2032
- Table 39: Venezuela Pharma Pricing Research Tools Market Revenue (Million) Forecast, by Application 2019 & 2032
- Table 40: Rest of South America Pharma Pricing Research Tools Market Revenue (Million) Forecast, by Application 2019 & 2032
- Table 41: Global Pharma Pricing Research Tools Market Revenue Million Forecast, by Country 2019 & 2032
- Table 42: United States Pharma Pricing Research Tools Market Revenue (Million) Forecast, by Application 2019 & 2032
- Table 43: Canada Pharma Pricing Research Tools Market Revenue (Million) Forecast, by Application 2019 & 2032
- Table 44: Mexico Pharma Pricing Research Tools Market Revenue (Million) Forecast, by Application 2019 & 2032
- Table 45: Global Pharma Pricing Research Tools Market Revenue Million Forecast, by Country 2019 & 2032
- Table 46: United Arab Emirates Pharma Pricing Research Tools Market Revenue (Million) Forecast, by Application 2019 & 2032
- Table 47: Saudi Arabia Pharma Pricing Research Tools Market Revenue (Million) Forecast, by Application 2019 & 2032
- Table 48: South Africa Pharma Pricing Research Tools Market Revenue (Million) Forecast, by Application 2019 & 2032
- Table 49: Rest of Middle East and Africa Pharma Pricing Research Tools Market Revenue (Million) Forecast, by Application 2019 & 2032
- Table 50: Global Pharma Pricing Research Tools Market Revenue Million Forecast, by Application 2019 & 2032
- Table 51: Global Pharma Pricing Research Tools Market Revenue Million Forecast, by Type 2019 & 2032
- Table 52: Global Pharma Pricing Research Tools Market Revenue Million Forecast, by Country 2019 & 2032
- Table 53: United States Pharma Pricing Research Tools Market Revenue (Million) Forecast, by Application 2019 & 2032
- Table 54: Canada Pharma Pricing Research Tools Market Revenue (Million) Forecast, by Application 2019 & 2032
- Table 55: Mexico Pharma Pricing Research Tools Market Revenue (Million) Forecast, by Application 2019 & 2032
- Table 56: Global Pharma Pricing Research Tools Market Revenue Million Forecast, by Application 2019 & 2032
- Table 57: Global Pharma Pricing Research Tools Market Revenue Million Forecast, by Type 2019 & 2032
- Table 58: Global Pharma Pricing Research Tools Market Revenue Million Forecast, by Country 2019 & 2032
- Table 59: Germany Pharma Pricing Research Tools Market Revenue (Million) Forecast, by Application 2019 & 2032
- Table 60: United Kingdom Pharma Pricing Research Tools Market Revenue (Million) Forecast, by Application 2019 & 2032
- Table 61: France Pharma Pricing Research Tools Market Revenue (Million) Forecast, by Application 2019 & 2032
- Table 62: Italy Pharma Pricing Research Tools Market Revenue (Million) Forecast, by Application 2019 & 2032
- Table 63: Spain Pharma Pricing Research Tools Market Revenue (Million) Forecast, by Application 2019 & 2032
- Table 64: Rest of Europe Pharma Pricing Research Tools Market Revenue (Million) Forecast, by Application 2019 & 2032
- Table 65: Global Pharma Pricing Research Tools Market Revenue Million Forecast, by Application 2019 & 2032
- Table 66: Global Pharma Pricing Research Tools Market Revenue Million Forecast, by Type 2019 & 2032
- Table 67: Global Pharma Pricing Research Tools Market Revenue Million Forecast, by Country 2019 & 2032
Frequently Asked Questions
1. What is the projected Compound Annual Growth Rate (CAGR) of the Pharma Pricing Research Tools Market?
The projected CAGR is approximately 4.80%.
2. Which companies are prominent players in the Pharma Pricing Research Tools Market?
Key companies in the market include phamax, Clarivate Anlaytics, IQVIA, Elsevier*List Not Exhaustive, Inpharmation, Wolters Kluwer N V, Veeva Systems, Avalere Health LLC.
3. What are the main segments of the Pharma Pricing Research Tools Market?
The market segments include Application, Type.
4. Can you provide details about the market size?
The market size is estimated to be USD 1.64 Million as of 2022.
5. What are some drivers contributing to market growth?
Increasing Complexity of Pharmaceutical Pricing; Rising Demand for Pricing Research & Analytics in Healthcare.
6. What are the notable trends driving market growth?
The Over-the-Counter Segment is Expected to Show Healthy Growth Over the Forecast Period.
7. Are there any restraints impacting market growth?
Lack of Standardization in Underdeveloped Countries.
8. Can you provide examples of recent developments in the market?
N/A
9. What pricing options are available for accessing the report?
Pricing options include single-user, multi-user, and enterprise licenses priced at USD 4750, USD 5250, and USD 8750 respectively.
10. Is the market size provided in terms of value or volume?
The market size is provided in terms of value, measured in Million.
11. Are there any specific market keywords associated with the report?
Yes, the market keyword associated with the report is "Pharma Pricing Research Tools Market," which aids in identifying and referencing the specific market segment covered.
12. How do I determine which pricing option suits my needs best?
The pricing options vary based on user requirements and access needs. Individual users may opt for single-user licenses, while businesses requiring broader access may choose multi-user or enterprise licenses for cost-effective access to the report.
13. Are there any additional resources or data provided in the Pharma Pricing Research Tools Market report?
While the report offers comprehensive insights, it's advisable to review the specific contents or supplementary materials provided to ascertain if additional resources or data are available.
14. How can I stay updated on further developments or reports in the Pharma Pricing Research Tools Market?
To stay informed about further developments, trends, and reports in the Pharma Pricing Research Tools Market, consider subscribing to industry newsletters, following relevant companies and organizations, or regularly checking reputable industry news sources and publications.
Methodology
Step 1 - Identification of Relevant Samples Size from Population Database


Step 2 - Approaches for Defining Global Market Size (Value, Volume* & Price*)

Note*: In applicable scenarios
Step 3 - Data Sources
Primary Research
- Web Analytics
- Survey Reports
- Research Institute
- Latest Research Reports
- Opinion Leaders
Secondary Research
- Annual Reports
- White Paper
- Latest Press Release
- Industry Association
- Paid Database
- Investor Presentations

Step 4 - Data Triangulation
Involves using different sources of information in order to increase the validity of a study
These sources are likely to be stakeholders in a program - participants, other researchers, program staff, other community members, and so on.
Then we put all data in single framework & apply various statistical tools to find out the dynamic on the market.
During the analysis stage, feedback from the stakeholder groups would be compared to determine areas of agreement as well as areas of divergence
