

Key Insights
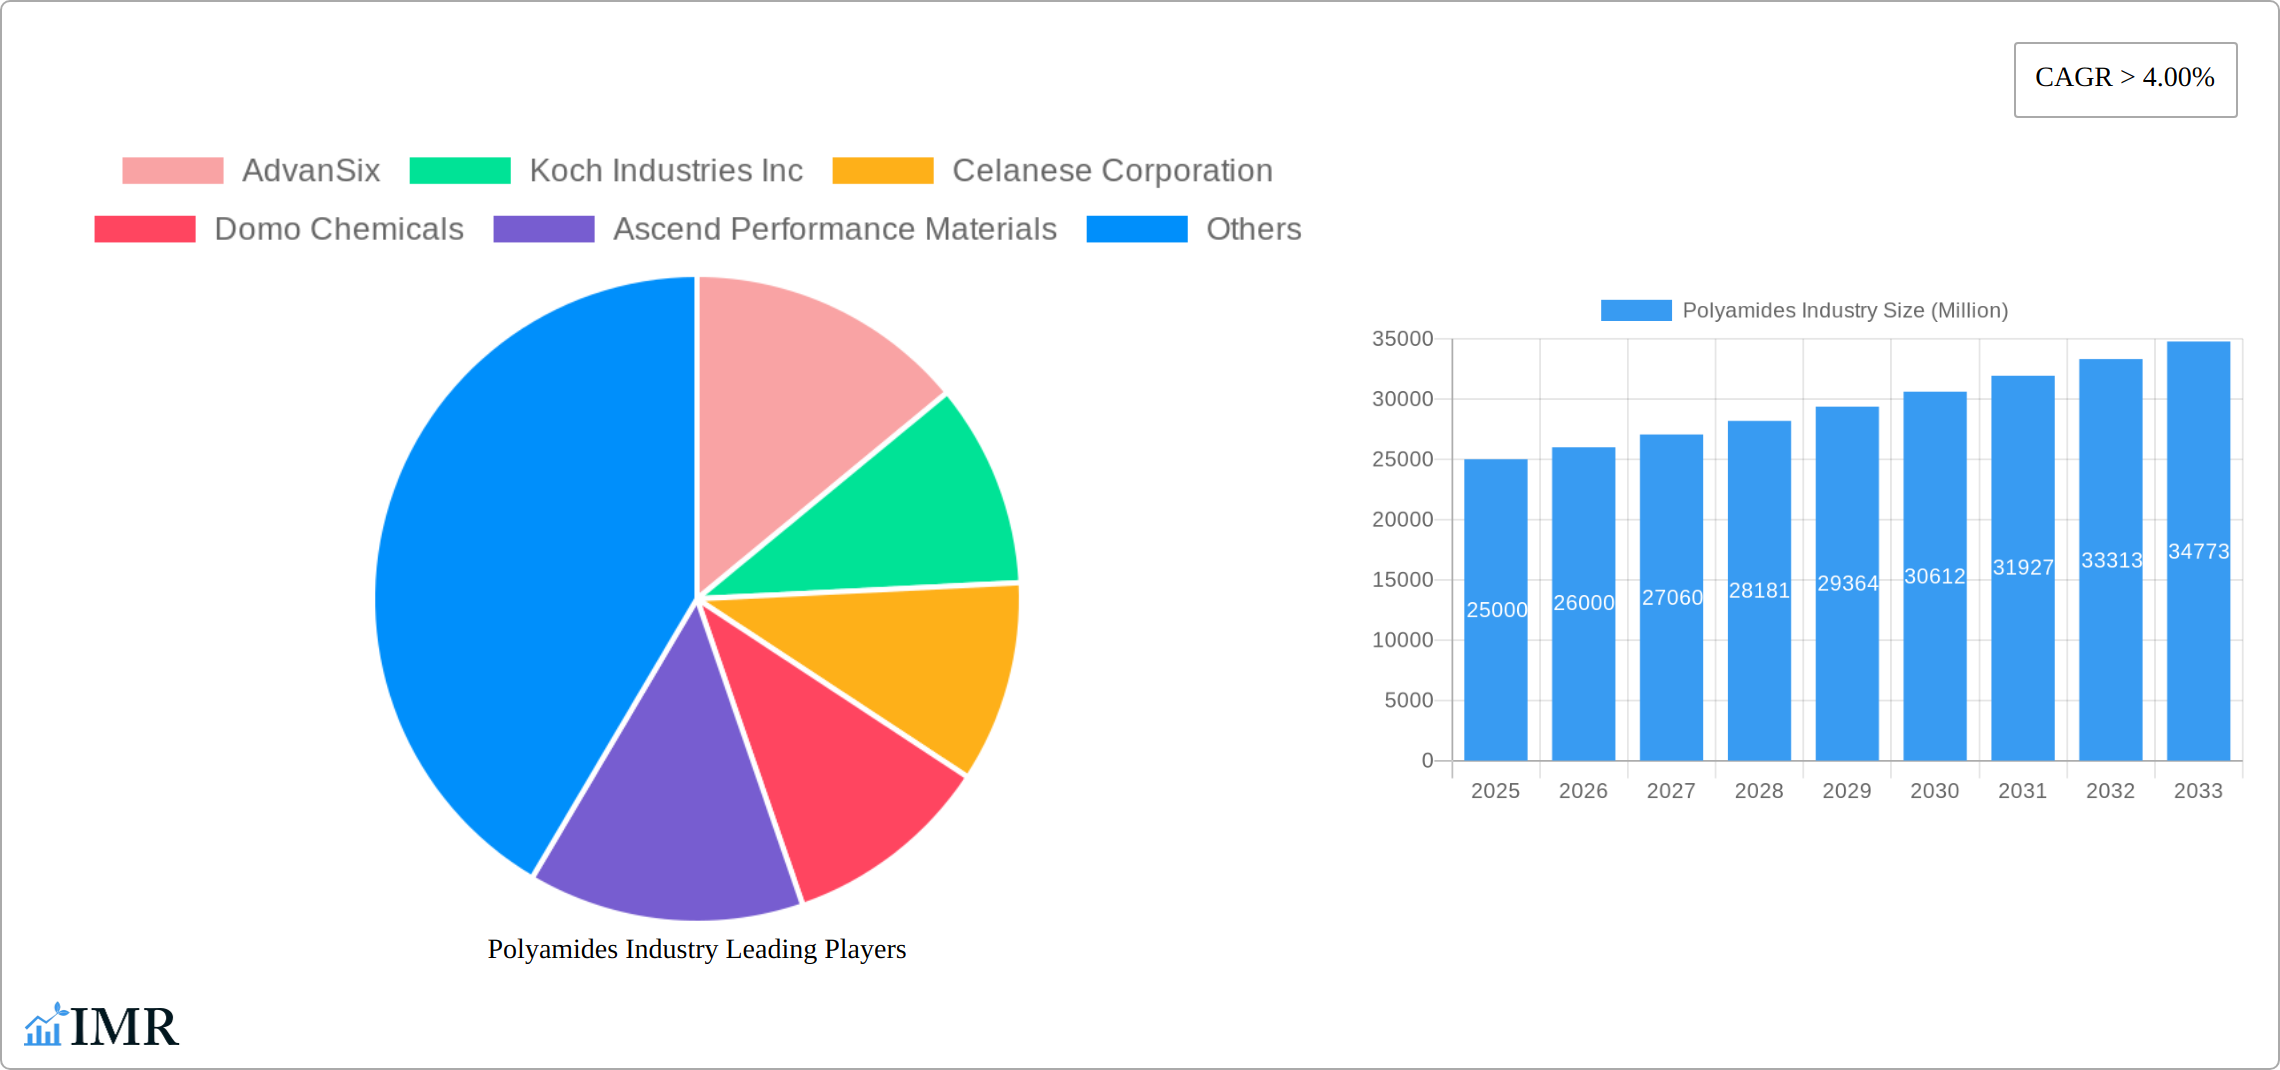
The global polyamides market is experiencing robust growth, driven by increasing demand across diverse end-use industries. The market's Compound Annual Growth Rate (CAGR) exceeding 4% signifies a consistently expanding market, projected to reach significant value in the coming years. Key drivers include the rising adoption of polyamides in lightweight automotive components, the burgeoning aerospace industry's need for high-performance materials, and the expansion of the electrical and electronics sector, particularly in areas like 5G infrastructure and electric vehicles. Furthermore, the construction industry's growing use of polyamides in pipes, fittings, and coatings is significantly contributing to market expansion. Specific resin types like polyamide 6 (PA6) and polyamide 66 (PA66) dominate the market due to their excellent mechanical properties and cost-effectiveness. However, the market faces certain restraints, including fluctuating raw material prices and environmental concerns surrounding the production and disposal of plastics. Innovation in sustainable polyamide production and the development of bio-based alternatives are expected to mitigate these challenges. Major players like BASF, DuPont, and Lanxess are investing heavily in research and development to introduce high-performance, specialized polyamides tailored to specific applications, furthering market growth. The geographical distribution of the market is likely to see strong growth in Asia-Pacific regions, fueled by rapid industrialization and increasing consumer demand.
The segmentation of the polyamides market reflects the diverse applications of this versatile material. The end-user industry segmentation highlights the significant contributions of the automotive, aerospace, and electronics sectors. Meanwhile, the sub-resin type segmentation emphasizes the popularity and market share of polyamide 6 and polyamide 66. Competition within the market is intense, with established players and emerging regional manufacturers vying for market share. Strategic partnerships, mergers and acquisitions, and technological advancements are key strategies employed by companies to maintain a competitive edge and cater to the evolving needs of various industries. Future market growth will depend on several factors, including technological advancements leading to improved material properties, the increasing adoption of sustainable manufacturing practices, and the overall economic growth in key regions. The forecasted market value for 2033, calculated based on the provided CAGR and considering market dynamics, suggests a significant expansion compared to the 2025 base year.
Polyamides Industry Market Report: 2019-2033
This comprehensive report provides an in-depth analysis of the global polyamides industry, encompassing market dynamics, growth trends, competitive landscape, and future outlook. With a focus on key segments like Aramid, Polyamide (PA), and Polyphthalamide, and major end-use industries including automotive, electronics, and packaging, this report is essential for industry professionals, investors, and strategic decision-makers. The study period covers 2019-2033, with 2025 as the base and estimated year.
Polyamides Industry Market Dynamics & Structure
The polyamides market exhibits moderate concentration, with key players like BASF SE, Celanese Corporation, and Ascend Performance Materials holding substantial market share. This dynamic landscape is propelled by continuous technological advancements in sustainable materials and high-performance polymers, coupled with increasingly stringent regulatory frameworks that incentivize environmentally responsible manufacturing processes. While competition from alternative materials such as other plastics and composites remains a factor, the inherent strength, durability, and versatility of polyamides continue to fuel robust demand. A notable increase in mergers and acquisitions (M&A) activity reflects ongoing industry consolidation and a strategic push to expand product portfolios and market reach.
- Market Concentration: Moderately concentrated, with leading players commanding a significant portion of the global market share in 2024. Precise figures require further research and data analysis.
- Technological Innovation: A strong focus on developing bio-based polyamides, incorporating recycled content into production, and enhancing mechanical properties to meet diverse application requirements.
- Regulatory Landscape: A global trend toward stricter environmental regulations is driving manufacturers to adopt more sustainable practices, reducing their carbon footprint, and improving overall environmental performance.
- Competitive Substitutes: Competition exists from other polymers, bioplastics, and advanced composites, necessitating continuous innovation and differentiation to maintain market competitiveness.
- M&A Activity: Significant M&A activity between 2019 and 2024 indicates industry consolidation, driven by strategic objectives like vertical and horizontal integration to optimize operations and expand market access.
- End-User Demographics: Market growth is fueled by increasing demand from key sectors including automotive, electronics, packaging, and textiles, reflecting the broad applicability of polyamides.
Polyamides Industry Growth Trends & Insights
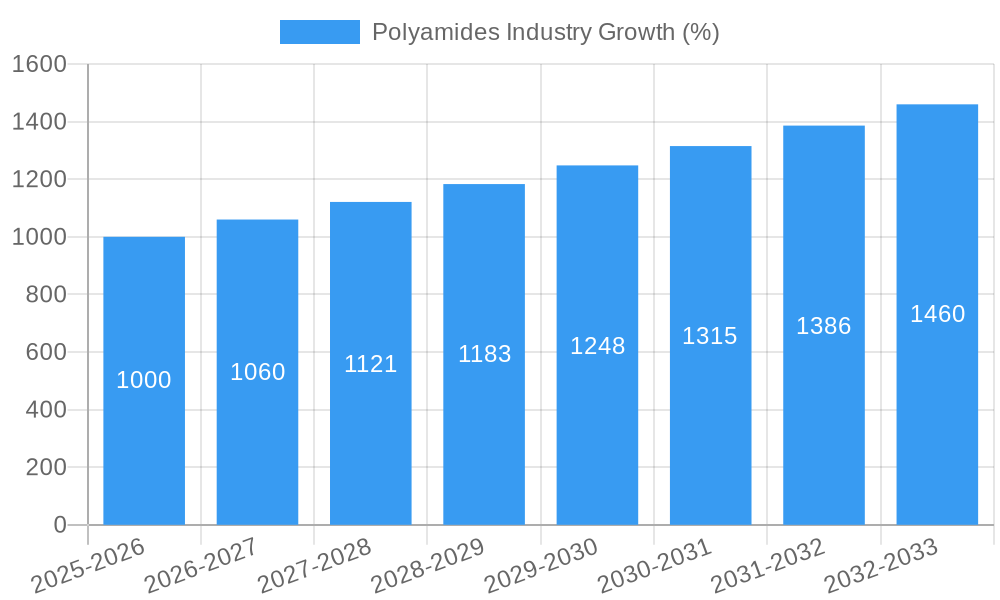
The global polyamides market experienced significant growth during the historical period (2019-2024), with a CAGR of xx%. This growth is projected to continue throughout the forecast period (2025-2033), driven by factors such as increasing demand from emerging economies, rising adoption in high-growth end-use sectors, and the development of innovative polyamide materials with enhanced properties. Market penetration in key regions is expected to increase steadily, especially in Asia-Pacific. Technological advancements such as the use of recycled materials and bio-based feedstocks are also driving market growth, promoting sustainability. Consumer behavior shifts towards eco-friendly products further bolster the demand for sustainable polyamides. The market size is expected to reach xx Million units by 2033.
Dominant Regions, Countries, or Segments in Polyamides Industry
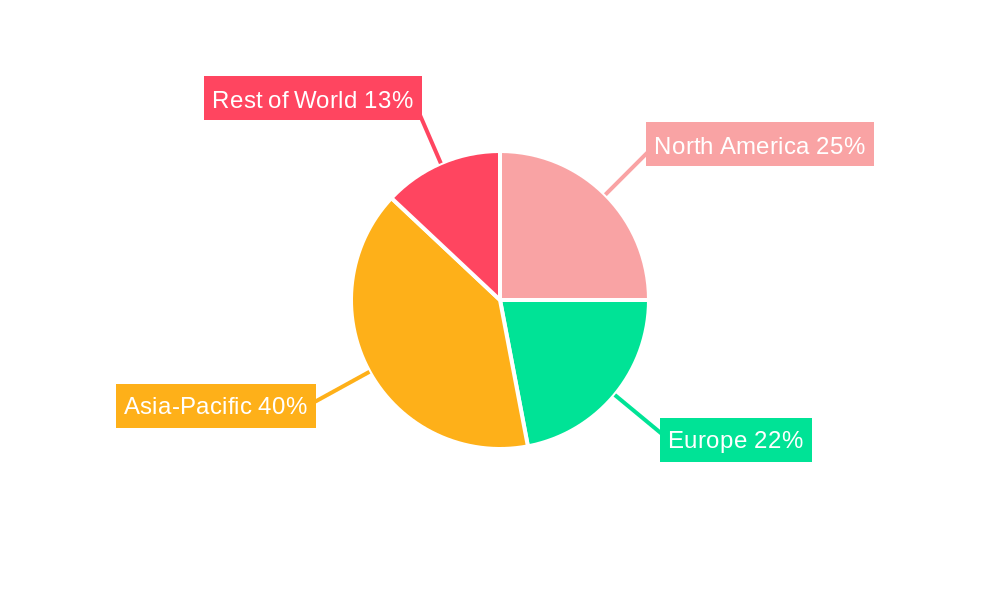
The Asia-Pacific region is the dominant market for polyamides, driven by strong growth in the automotive and electronics sectors. China, India, and Japan are key contributors to this regional dominance. Within the end-use industries, automotive and electrical and electronics segments are leading market growth due to increasing vehicle production and electronic device adoption. Similarly, Polyamide (PA) holds the largest market share amongst resin types due to its versatility and cost-effectiveness.
- Key Drivers: Rapid industrialization, increasing disposable incomes, and government support for infrastructure development in Asia-Pacific.
- Dominance Factors: Large manufacturing base, robust automotive and electronics industries, and cost-competitive production in Asia-Pacific.
- Growth Potential: High growth potential in emerging economies, particularly in Southeast Asia and India.
- Market Share: Asia-Pacific holds approximately xx% of the global polyamides market.
Polyamides Industry Product Landscape
The polyamides market offers a diverse range of products, encompassing high-performance engineering plastics tailored for demanding applications, specialty polyamides with unique properties, and a growing segment of sustainable alternatives incorporating recycled or bio-based materials. Key product innovations emphasize enhancements in mechanical properties, including increased tensile strength, impact resistance, fatigue endurance, and chemical resistance. The development of high-temperature resistant polyamides and readily biodegradable bio-based alternatives presents compelling value propositions, particularly appealing to the expanding market for eco-friendly materials. Ongoing technological advancements are continuously improving material performance, processing efficiency, and overall cost-effectiveness.
Key Drivers, Barriers & Challenges in Polyamides Industry
Key Drivers:
- Increasing demand from automotive and electronics sectors
- Growing adoption of sustainable and eco-friendly materials
- Technological advancements leading to improved product performance
- Infrastructure development in emerging economies
Challenges & Restraints:
- Fluctuations in raw material prices, particularly oil-based feedstocks
- Stringent environmental regulations and their impact on manufacturing costs
- Intense competition from alternative materials
- Supply chain disruptions impacting production and delivery timelines.
Emerging Opportunities in Polyamides Industry
Untapped markets in developing economies, particularly in Africa and Latin America, present substantial growth opportunities. Innovative applications of polyamides in renewable energy technologies and 3D printing are gaining traction. Evolving consumer preferences for sustainable and ethically produced goods drive demand for bio-based and recycled polyamide materials.
Growth Accelerators in the Polyamides Industry Industry
Technological breakthroughs in material science, such as the development of high-performance bio-based polyamides and improved recycling technologies, will accelerate market growth. Strategic partnerships and collaborations between manufacturers and end-users foster innovation and market expansion. Expanding production capacity in growth markets and adopting circular economy models contribute to long-term growth.
Key Players Shaping the Polyamides Industry Market
- AdvanSix
- Koch Industries Inc
- Celanese Corporation
- Domo Chemicals
- Ascend Performance Materials
- LANXESS
- Highsun Holding Group
- BASF SE
- LIBOLO
- Hangzhou Juheshun New Materials Co Ltd
Notable Milestones in Polyamides Industry Sector
- November 2022: Celanese Corporation's acquisition of DuPont's Mobility & Materials business expanded its engineered thermoplastic portfolio.
- September 2022: LANXESS launched Durethan ECO, a sustainable polyamide resin incorporating recycled glass fibers.
- July 2022: BASF SE announced plans to expand its ultramid polyamide production capacity in India.
In-Depth Polyamides Industry Market Outlook
The polyamides market is projected to experience sustained growth driven by a confluence of factors: technological advancements leading to superior materials, increasing demand from diverse end-use sectors, and a strong push toward the adoption of sustainable and eco-friendly materials. Strategic partnerships, capacity expansion initiatives in emerging markets, and the development of innovative applications across various sectors will unlock significant future market potential. The growing emphasis on sustainability and the principles of the circular economy will continue to shape the market landscape, creating lucrative opportunities for companies that prioritize and implement eco-conscious manufacturing practices and supply chain strategies.
Polyamides Industry Segmentation
-
1. End User Industry
- 1.1. Aerospace
- 1.2. Automotive
- 1.3. Building and Construction
- 1.4. Electrical and Electronics
- 1.5. Industrial and Machinery
- 1.6. Packaging
- 1.7. Other End-user Industries
-
2. Sub Resin Type
- 2.1. Aramid
- 2.2. Polyamide (PA) 6
- 2.3. Polyamide (PA) 66
- 2.4. Polyphthalamide
Polyamides Industry Segmentation By Geography
-
1. North America
- 1.1. United States
- 1.2. Canada
- 1.3. Mexico
-
2. South America
- 2.1. Brazil
- 2.2. Argentina
- 2.3. Rest of South America
-
3. Europe
- 3.1. United Kingdom
- 3.2. Germany
- 3.3. France
- 3.4. Italy
- 3.5. Spain
- 3.6. Russia
- 3.7. Benelux
- 3.8. Nordics
- 3.9. Rest of Europe
-
4. Middle East & Africa
- 4.1. Turkey
- 4.2. Israel
- 4.3. GCC
- 4.4. North Africa
- 4.5. South Africa
- 4.6. Rest of Middle East & Africa
-
5. Asia Pacific
- 5.1. China
- 5.2. India
- 5.3. Japan
- 5.4. South Korea
- 5.5. ASEAN
- 5.6. Oceania
- 5.7. Rest of Asia Pacific
Polyamides Industry REPORT HIGHLIGHTS
| Aspects | Details |
|---|---|
| Study Period | 2019-2033 |
| Base Year | 2024 |
| Estimated Year | 2025 |
| Forecast Period | 2025-2033 |
| Historical Period | 2019-2024 |
| Growth Rate | CAGR of > 4.00% from 2019-2033 |
| Segmentation |
|
Table of Contents
- 1. Introduction
- 1.1. Research Scope
- 1.2. Market Segmentation
- 1.3. Research Methodology
- 1.4. Definitions and Assumptions
- 2. Executive Summary
- 2.1. Introduction
- 3. Market Dynamics
- 3.1. Introduction
- 3.2. Market Drivers
- 3.2.1. Rapidly Growing Demand from the Poultry Industry; Increased Intake of Human Nutritional Supplements; Other Drivers
- 3.3. Market Restrains
- 3.3.1. Outbreak of Animal Diseases; Other Restraints
- 3.4. Market Trends
- 3.4.1. shift toward innovation and sustainability
- 4. Market Factor Analysis
- 4.1. Porters Five Forces
- 4.2. Supply/Value Chain
- 4.3. PESTEL analysis
- 4.4. Market Entropy
- 4.5. Patent/Trademark Analysis
- 5. Global Polyamides Industry Analysis, Insights and Forecast, 2019-2031
- 5.1. Market Analysis, Insights and Forecast - by End User Industry
- 5.1.1. Aerospace
- 5.1.2. Automotive
- 5.1.3. Building and Construction
- 5.1.4. Electrical and Electronics
- 5.1.5. Industrial and Machinery
- 5.1.6. Packaging
- 5.1.7. Other End-user Industries
- 5.2. Market Analysis, Insights and Forecast - by Sub Resin Type
- 5.2.1. Aramid
- 5.2.2. Polyamide (PA) 6
- 5.2.3. Polyamide (PA) 66
- 5.2.4. Polyphthalamide
- 5.3. Market Analysis, Insights and Forecast - by Region
- 5.3.1. North America
- 5.3.2. South America
- 5.3.3. Europe
- 5.3.4. Middle East & Africa
- 5.3.5. Asia Pacific
- 5.1. Market Analysis, Insights and Forecast - by End User Industry
- 6. North America Polyamides Industry Analysis, Insights and Forecast, 2019-2031
- 6.1. Market Analysis, Insights and Forecast - by End User Industry
- 6.1.1. Aerospace
- 6.1.2. Automotive
- 6.1.3. Building and Construction
- 6.1.4. Electrical and Electronics
- 6.1.5. Industrial and Machinery
- 6.1.6. Packaging
- 6.1.7. Other End-user Industries
- 6.2. Market Analysis, Insights and Forecast - by Sub Resin Type
- 6.2.1. Aramid
- 6.2.2. Polyamide (PA) 6
- 6.2.3. Polyamide (PA) 66
- 6.2.4. Polyphthalamide
- 6.1. Market Analysis, Insights and Forecast - by End User Industry
- 7. South America Polyamides Industry Analysis, Insights and Forecast, 2019-2031
- 7.1. Market Analysis, Insights and Forecast - by End User Industry
- 7.1.1. Aerospace
- 7.1.2. Automotive
- 7.1.3. Building and Construction
- 7.1.4. Electrical and Electronics
- 7.1.5. Industrial and Machinery
- 7.1.6. Packaging
- 7.1.7. Other End-user Industries
- 7.2. Market Analysis, Insights and Forecast - by Sub Resin Type
- 7.2.1. Aramid
- 7.2.2. Polyamide (PA) 6
- 7.2.3. Polyamide (PA) 66
- 7.2.4. Polyphthalamide
- 7.1. Market Analysis, Insights and Forecast - by End User Industry
- 8. Europe Polyamides Industry Analysis, Insights and Forecast, 2019-2031
- 8.1. Market Analysis, Insights and Forecast - by End User Industry
- 8.1.1. Aerospace
- 8.1.2. Automotive
- 8.1.3. Building and Construction
- 8.1.4. Electrical and Electronics
- 8.1.5. Industrial and Machinery
- 8.1.6. Packaging
- 8.1.7. Other End-user Industries
- 8.2. Market Analysis, Insights and Forecast - by Sub Resin Type
- 8.2.1. Aramid
- 8.2.2. Polyamide (PA) 6
- 8.2.3. Polyamide (PA) 66
- 8.2.4. Polyphthalamide
- 8.1. Market Analysis, Insights and Forecast - by End User Industry
- 9. Middle East & Africa Polyamides Industry Analysis, Insights and Forecast, 2019-2031
- 9.1. Market Analysis, Insights and Forecast - by End User Industry
- 9.1.1. Aerospace
- 9.1.2. Automotive
- 9.1.3. Building and Construction
- 9.1.4. Electrical and Electronics
- 9.1.5. Industrial and Machinery
- 9.1.6. Packaging
- 9.1.7. Other End-user Industries
- 9.2. Market Analysis, Insights and Forecast - by Sub Resin Type
- 9.2.1. Aramid
- 9.2.2. Polyamide (PA) 6
- 9.2.3. Polyamide (PA) 66
- 9.2.4. Polyphthalamide
- 9.1. Market Analysis, Insights and Forecast - by End User Industry
- 10. Asia Pacific Polyamides Industry Analysis, Insights and Forecast, 2019-2031
- 10.1. Market Analysis, Insights and Forecast - by End User Industry
- 10.1.1. Aerospace
- 10.1.2. Automotive
- 10.1.3. Building and Construction
- 10.1.4. Electrical and Electronics
- 10.1.5. Industrial and Machinery
- 10.1.6. Packaging
- 10.1.7. Other End-user Industries
- 10.2. Market Analysis, Insights and Forecast - by Sub Resin Type
- 10.2.1. Aramid
- 10.2.2. Polyamide (PA) 6
- 10.2.3. Polyamide (PA) 66
- 10.2.4. Polyphthalamide
- 10.1. Market Analysis, Insights and Forecast - by End User Industry
- 11. Competitive Analysis
- 11.1. Global Market Share Analysis 2024
- 11.2. Company Profiles
- 11.2.1 AdvanSix
- 11.2.1.1. Overview
- 11.2.1.2. Products
- 11.2.1.3. SWOT Analysis
- 11.2.1.4. Recent Developments
- 11.2.1.5. Financials (Based on Availability)
- 11.2.2 Koch Industries Inc
- 11.2.2.1. Overview
- 11.2.2.2. Products
- 11.2.2.3. SWOT Analysis
- 11.2.2.4. Recent Developments
- 11.2.2.5. Financials (Based on Availability)
- 11.2.3 Celanese Corporation
- 11.2.3.1. Overview
- 11.2.3.2. Products
- 11.2.3.3. SWOT Analysis
- 11.2.3.4. Recent Developments
- 11.2.3.5. Financials (Based on Availability)
- 11.2.4 Domo Chemicals
- 11.2.4.1. Overview
- 11.2.4.2. Products
- 11.2.4.3. SWOT Analysis
- 11.2.4.4. Recent Developments
- 11.2.4.5. Financials (Based on Availability)
- 11.2.5 Ascend Performance Materials
- 11.2.5.1. Overview
- 11.2.5.2. Products
- 11.2.5.3. SWOT Analysis
- 11.2.5.4. Recent Developments
- 11.2.5.5. Financials (Based on Availability)
- 11.2.6 LANXESS
- 11.2.6.1. Overview
- 11.2.6.2. Products
- 11.2.6.3. SWOT Analysis
- 11.2.6.4. Recent Developments
- 11.2.6.5. Financials (Based on Availability)
- 11.2.7 Highsun Holding Group
- 11.2.7.1. Overview
- 11.2.7.2. Products
- 11.2.7.3. SWOT Analysis
- 11.2.7.4. Recent Developments
- 11.2.7.5. Financials (Based on Availability)
- 11.2.8 BASF SE
- 11.2.8.1. Overview
- 11.2.8.2. Products
- 11.2.8.3. SWOT Analysis
- 11.2.8.4. Recent Developments
- 11.2.8.5. Financials (Based on Availability)
- 11.2.9 LIBOLO
- 11.2.9.1. Overview
- 11.2.9.2. Products
- 11.2.9.3. SWOT Analysis
- 11.2.9.4. Recent Developments
- 11.2.9.5. Financials (Based on Availability)
- 11.2.10 Hangzhou Juheshun New Materials Co Ltd
- 11.2.10.1. Overview
- 11.2.10.2. Products
- 11.2.10.3. SWOT Analysis
- 11.2.10.4. Recent Developments
- 11.2.10.5. Financials (Based on Availability)
- 11.2.1 AdvanSix
List of Figures
- Figure 1: Global Polyamides Industry Revenue Breakdown (Million, %) by Region 2024 & 2032
- Figure 2: Global Polyamides Industry Volume Breakdown (K Tons, %) by Region 2024 & 2032
- Figure 3: North America Polyamides Industry Revenue (Million), by End User Industry 2024 & 2032
- Figure 4: North America Polyamides Industry Volume (K Tons), by End User Industry 2024 & 2032
- Figure 5: North America Polyamides Industry Revenue Share (%), by End User Industry 2024 & 2032
- Figure 6: North America Polyamides Industry Volume Share (%), by End User Industry 2024 & 2032
- Figure 7: North America Polyamides Industry Revenue (Million), by Sub Resin Type 2024 & 2032
- Figure 8: North America Polyamides Industry Volume (K Tons), by Sub Resin Type 2024 & 2032
- Figure 9: North America Polyamides Industry Revenue Share (%), by Sub Resin Type 2024 & 2032
- Figure 10: North America Polyamides Industry Volume Share (%), by Sub Resin Type 2024 & 2032
- Figure 11: North America Polyamides Industry Revenue (Million), by Country 2024 & 2032
- Figure 12: North America Polyamides Industry Volume (K Tons), by Country 2024 & 2032
- Figure 13: North America Polyamides Industry Revenue Share (%), by Country 2024 & 2032
- Figure 14: North America Polyamides Industry Volume Share (%), by Country 2024 & 2032
- Figure 15: South America Polyamides Industry Revenue (Million), by End User Industry 2024 & 2032
- Figure 16: South America Polyamides Industry Volume (K Tons), by End User Industry 2024 & 2032
- Figure 17: South America Polyamides Industry Revenue Share (%), by End User Industry 2024 & 2032
- Figure 18: South America Polyamides Industry Volume Share (%), by End User Industry 2024 & 2032
- Figure 19: South America Polyamides Industry Revenue (Million), by Sub Resin Type 2024 & 2032
- Figure 20: South America Polyamides Industry Volume (K Tons), by Sub Resin Type 2024 & 2032
- Figure 21: South America Polyamides Industry Revenue Share (%), by Sub Resin Type 2024 & 2032
- Figure 22: South America Polyamides Industry Volume Share (%), by Sub Resin Type 2024 & 2032
- Figure 23: South America Polyamides Industry Revenue (Million), by Country 2024 & 2032
- Figure 24: South America Polyamides Industry Volume (K Tons), by Country 2024 & 2032
- Figure 25: South America Polyamides Industry Revenue Share (%), by Country 2024 & 2032
- Figure 26: South America Polyamides Industry Volume Share (%), by Country 2024 & 2032
- Figure 27: Europe Polyamides Industry Revenue (Million), by End User Industry 2024 & 2032
- Figure 28: Europe Polyamides Industry Volume (K Tons), by End User Industry 2024 & 2032
- Figure 29: Europe Polyamides Industry Revenue Share (%), by End User Industry 2024 & 2032
- Figure 30: Europe Polyamides Industry Volume Share (%), by End User Industry 2024 & 2032
- Figure 31: Europe Polyamides Industry Revenue (Million), by Sub Resin Type 2024 & 2032
- Figure 32: Europe Polyamides Industry Volume (K Tons), by Sub Resin Type 2024 & 2032
- Figure 33: Europe Polyamides Industry Revenue Share (%), by Sub Resin Type 2024 & 2032
- Figure 34: Europe Polyamides Industry Volume Share (%), by Sub Resin Type 2024 & 2032
- Figure 35: Europe Polyamides Industry Revenue (Million), by Country 2024 & 2032
- Figure 36: Europe Polyamides Industry Volume (K Tons), by Country 2024 & 2032
- Figure 37: Europe Polyamides Industry Revenue Share (%), by Country 2024 & 2032
- Figure 38: Europe Polyamides Industry Volume Share (%), by Country 2024 & 2032
- Figure 39: Middle East & Africa Polyamides Industry Revenue (Million), by End User Industry 2024 & 2032
- Figure 40: Middle East & Africa Polyamides Industry Volume (K Tons), by End User Industry 2024 & 2032
- Figure 41: Middle East & Africa Polyamides Industry Revenue Share (%), by End User Industry 2024 & 2032
- Figure 42: Middle East & Africa Polyamides Industry Volume Share (%), by End User Industry 2024 & 2032
- Figure 43: Middle East & Africa Polyamides Industry Revenue (Million), by Sub Resin Type 2024 & 2032
- Figure 44: Middle East & Africa Polyamides Industry Volume (K Tons), by Sub Resin Type 2024 & 2032
- Figure 45: Middle East & Africa Polyamides Industry Revenue Share (%), by Sub Resin Type 2024 & 2032
- Figure 46: Middle East & Africa Polyamides Industry Volume Share (%), by Sub Resin Type 2024 & 2032
- Figure 47: Middle East & Africa Polyamides Industry Revenue (Million), by Country 2024 & 2032
- Figure 48: Middle East & Africa Polyamides Industry Volume (K Tons), by Country 2024 & 2032
- Figure 49: Middle East & Africa Polyamides Industry Revenue Share (%), by Country 2024 & 2032
- Figure 50: Middle East & Africa Polyamides Industry Volume Share (%), by Country 2024 & 2032
- Figure 51: Asia Pacific Polyamides Industry Revenue (Million), by End User Industry 2024 & 2032
- Figure 52: Asia Pacific Polyamides Industry Volume (K Tons), by End User Industry 2024 & 2032
- Figure 53: Asia Pacific Polyamides Industry Revenue Share (%), by End User Industry 2024 & 2032
- Figure 54: Asia Pacific Polyamides Industry Volume Share (%), by End User Industry 2024 & 2032
- Figure 55: Asia Pacific Polyamides Industry Revenue (Million), by Sub Resin Type 2024 & 2032
- Figure 56: Asia Pacific Polyamides Industry Volume (K Tons), by Sub Resin Type 2024 & 2032
- Figure 57: Asia Pacific Polyamides Industry Revenue Share (%), by Sub Resin Type 2024 & 2032
- Figure 58: Asia Pacific Polyamides Industry Volume Share (%), by Sub Resin Type 2024 & 2032
- Figure 59: Asia Pacific Polyamides Industry Revenue (Million), by Country 2024 & 2032
- Figure 60: Asia Pacific Polyamides Industry Volume (K Tons), by Country 2024 & 2032
- Figure 61: Asia Pacific Polyamides Industry Revenue Share (%), by Country 2024 & 2032
- Figure 62: Asia Pacific Polyamides Industry Volume Share (%), by Country 2024 & 2032
List of Tables
- Table 1: Global Polyamides Industry Revenue Million Forecast, by Region 2019 & 2032
- Table 2: Global Polyamides Industry Volume K Tons Forecast, by Region 2019 & 2032
- Table 3: Global Polyamides Industry Revenue Million Forecast, by End User Industry 2019 & 2032
- Table 4: Global Polyamides Industry Volume K Tons Forecast, by End User Industry 2019 & 2032
- Table 5: Global Polyamides Industry Revenue Million Forecast, by Sub Resin Type 2019 & 2032
- Table 6: Global Polyamides Industry Volume K Tons Forecast, by Sub Resin Type 2019 & 2032
- Table 7: Global Polyamides Industry Revenue Million Forecast, by Region 2019 & 2032
- Table 8: Global Polyamides Industry Volume K Tons Forecast, by Region 2019 & 2032
- Table 9: Global Polyamides Industry Revenue Million Forecast, by End User Industry 2019 & 2032
- Table 10: Global Polyamides Industry Volume K Tons Forecast, by End User Industry 2019 & 2032
- Table 11: Global Polyamides Industry Revenue Million Forecast, by Sub Resin Type 2019 & 2032
- Table 12: Global Polyamides Industry Volume K Tons Forecast, by Sub Resin Type 2019 & 2032
- Table 13: Global Polyamides Industry Revenue Million Forecast, by Country 2019 & 2032
- Table 14: Global Polyamides Industry Volume K Tons Forecast, by Country 2019 & 2032
- Table 15: United States Polyamides Industry Revenue (Million) Forecast, by Application 2019 & 2032
- Table 16: United States Polyamides Industry Volume (K Tons) Forecast, by Application 2019 & 2032
- Table 17: Canada Polyamides Industry Revenue (Million) Forecast, by Application 2019 & 2032
- Table 18: Canada Polyamides Industry Volume (K Tons) Forecast, by Application 2019 & 2032
- Table 19: Mexico Polyamides Industry Revenue (Million) Forecast, by Application 2019 & 2032
- Table 20: Mexico Polyamides Industry Volume (K Tons) Forecast, by Application 2019 & 2032
- Table 21: Global Polyamides Industry Revenue Million Forecast, by End User Industry 2019 & 2032
- Table 22: Global Polyamides Industry Volume K Tons Forecast, by End User Industry 2019 & 2032
- Table 23: Global Polyamides Industry Revenue Million Forecast, by Sub Resin Type 2019 & 2032
- Table 24: Global Polyamides Industry Volume K Tons Forecast, by Sub Resin Type 2019 & 2032
- Table 25: Global Polyamides Industry Revenue Million Forecast, by Country 2019 & 2032
- Table 26: Global Polyamides Industry Volume K Tons Forecast, by Country 2019 & 2032
- Table 27: Brazil Polyamides Industry Revenue (Million) Forecast, by Application 2019 & 2032
- Table 28: Brazil Polyamides Industry Volume (K Tons) Forecast, by Application 2019 & 2032
- Table 29: Argentina Polyamides Industry Revenue (Million) Forecast, by Application 2019 & 2032
- Table 30: Argentina Polyamides Industry Volume (K Tons) Forecast, by Application 2019 & 2032
- Table 31: Rest of South America Polyamides Industry Revenue (Million) Forecast, by Application 2019 & 2032
- Table 32: Rest of South America Polyamides Industry Volume (K Tons) Forecast, by Application 2019 & 2032
- Table 33: Global Polyamides Industry Revenue Million Forecast, by End User Industry 2019 & 2032
- Table 34: Global Polyamides Industry Volume K Tons Forecast, by End User Industry 2019 & 2032
- Table 35: Global Polyamides Industry Revenue Million Forecast, by Sub Resin Type 2019 & 2032
- Table 36: Global Polyamides Industry Volume K Tons Forecast, by Sub Resin Type 2019 & 2032
- Table 37: Global Polyamides Industry Revenue Million Forecast, by Country 2019 & 2032
- Table 38: Global Polyamides Industry Volume K Tons Forecast, by Country 2019 & 2032
- Table 39: United Kingdom Polyamides Industry Revenue (Million) Forecast, by Application 2019 & 2032
- Table 40: United Kingdom Polyamides Industry Volume (K Tons) Forecast, by Application 2019 & 2032
- Table 41: Germany Polyamides Industry Revenue (Million) Forecast, by Application 2019 & 2032
- Table 42: Germany Polyamides Industry Volume (K Tons) Forecast, by Application 2019 & 2032
- Table 43: France Polyamides Industry Revenue (Million) Forecast, by Application 2019 & 2032
- Table 44: France Polyamides Industry Volume (K Tons) Forecast, by Application 2019 & 2032
- Table 45: Italy Polyamides Industry Revenue (Million) Forecast, by Application 2019 & 2032
- Table 46: Italy Polyamides Industry Volume (K Tons) Forecast, by Application 2019 & 2032
- Table 47: Spain Polyamides Industry Revenue (Million) Forecast, by Application 2019 & 2032
- Table 48: Spain Polyamides Industry Volume (K Tons) Forecast, by Application 2019 & 2032
- Table 49: Russia Polyamides Industry Revenue (Million) Forecast, by Application 2019 & 2032
- Table 50: Russia Polyamides Industry Volume (K Tons) Forecast, by Application 2019 & 2032
- Table 51: Benelux Polyamides Industry Revenue (Million) Forecast, by Application 2019 & 2032
- Table 52: Benelux Polyamides Industry Volume (K Tons) Forecast, by Application 2019 & 2032
- Table 53: Nordics Polyamides Industry Revenue (Million) Forecast, by Application 2019 & 2032
- Table 54: Nordics Polyamides Industry Volume (K Tons) Forecast, by Application 2019 & 2032
- Table 55: Rest of Europe Polyamides Industry Revenue (Million) Forecast, by Application 2019 & 2032
- Table 56: Rest of Europe Polyamides Industry Volume (K Tons) Forecast, by Application 2019 & 2032
- Table 57: Global Polyamides Industry Revenue Million Forecast, by End User Industry 2019 & 2032
- Table 58: Global Polyamides Industry Volume K Tons Forecast, by End User Industry 2019 & 2032
- Table 59: Global Polyamides Industry Revenue Million Forecast, by Sub Resin Type 2019 & 2032
- Table 60: Global Polyamides Industry Volume K Tons Forecast, by Sub Resin Type 2019 & 2032
- Table 61: Global Polyamides Industry Revenue Million Forecast, by Country 2019 & 2032
- Table 62: Global Polyamides Industry Volume K Tons Forecast, by Country 2019 & 2032
- Table 63: Turkey Polyamides Industry Revenue (Million) Forecast, by Application 2019 & 2032
- Table 64: Turkey Polyamides Industry Volume (K Tons) Forecast, by Application 2019 & 2032
- Table 65: Israel Polyamides Industry Revenue (Million) Forecast, by Application 2019 & 2032
- Table 66: Israel Polyamides Industry Volume (K Tons) Forecast, by Application 2019 & 2032
- Table 67: GCC Polyamides Industry Revenue (Million) Forecast, by Application 2019 & 2032
- Table 68: GCC Polyamides Industry Volume (K Tons) Forecast, by Application 2019 & 2032
- Table 69: North Africa Polyamides Industry Revenue (Million) Forecast, by Application 2019 & 2032
- Table 70: North Africa Polyamides Industry Volume (K Tons) Forecast, by Application 2019 & 2032
- Table 71: South Africa Polyamides Industry Revenue (Million) Forecast, by Application 2019 & 2032
- Table 72: South Africa Polyamides Industry Volume (K Tons) Forecast, by Application 2019 & 2032
- Table 73: Rest of Middle East & Africa Polyamides Industry Revenue (Million) Forecast, by Application 2019 & 2032
- Table 74: Rest of Middle East & Africa Polyamides Industry Volume (K Tons) Forecast, by Application 2019 & 2032
- Table 75: Global Polyamides Industry Revenue Million Forecast, by End User Industry 2019 & 2032
- Table 76: Global Polyamides Industry Volume K Tons Forecast, by End User Industry 2019 & 2032
- Table 77: Global Polyamides Industry Revenue Million Forecast, by Sub Resin Type 2019 & 2032
- Table 78: Global Polyamides Industry Volume K Tons Forecast, by Sub Resin Type 2019 & 2032
- Table 79: Global Polyamides Industry Revenue Million Forecast, by Country 2019 & 2032
- Table 80: Global Polyamides Industry Volume K Tons Forecast, by Country 2019 & 2032
- Table 81: China Polyamides Industry Revenue (Million) Forecast, by Application 2019 & 2032
- Table 82: China Polyamides Industry Volume (K Tons) Forecast, by Application 2019 & 2032
- Table 83: India Polyamides Industry Revenue (Million) Forecast, by Application 2019 & 2032
- Table 84: India Polyamides Industry Volume (K Tons) Forecast, by Application 2019 & 2032
- Table 85: Japan Polyamides Industry Revenue (Million) Forecast, by Application 2019 & 2032
- Table 86: Japan Polyamides Industry Volume (K Tons) Forecast, by Application 2019 & 2032
- Table 87: South Korea Polyamides Industry Revenue (Million) Forecast, by Application 2019 & 2032
- Table 88: South Korea Polyamides Industry Volume (K Tons) Forecast, by Application 2019 & 2032
- Table 89: ASEAN Polyamides Industry Revenue (Million) Forecast, by Application 2019 & 2032
- Table 90: ASEAN Polyamides Industry Volume (K Tons) Forecast, by Application 2019 & 2032
- Table 91: Oceania Polyamides Industry Revenue (Million) Forecast, by Application 2019 & 2032
- Table 92: Oceania Polyamides Industry Volume (K Tons) Forecast, by Application 2019 & 2032
- Table 93: Rest of Asia Pacific Polyamides Industry Revenue (Million) Forecast, by Application 2019 & 2032
- Table 94: Rest of Asia Pacific Polyamides Industry Volume (K Tons) Forecast, by Application 2019 & 2032
Frequently Asked Questions
1. What is the projected Compound Annual Growth Rate (CAGR) of the Polyamides Industry?
The projected CAGR is approximately > 4.00%.
2. Which companies are prominent players in the Polyamides Industry?
Key companies in the market include AdvanSix, Koch Industries Inc, Celanese Corporation, Domo Chemicals, Ascend Performance Materials, LANXESS, Highsun Holding Group, BASF SE, LIBOLO, Hangzhou Juheshun New Materials Co Ltd.
3. What are the main segments of the Polyamides Industry?
The market segments include End User Industry, Sub Resin Type.
4. Can you provide details about the market size?
The market size is estimated to be USD XX Million as of 2022.
5. What are some drivers contributing to market growth?
Rapidly Growing Demand from the Poultry Industry; Increased Intake of Human Nutritional Supplements; Other Drivers.
6. What are the notable trends driving market growth?
shift toward innovation and sustainability.
7. Are there any restraints impacting market growth?
Outbreak of Animal Diseases; Other Restraints.
8. Can you provide examples of recent developments in the market?
November 2022: Celanese Corporation completed the acquisition of the Mobility & Materials (“M&M”) business of DuPont. This acquisition enhanced the company's product portfolio of engineered thermoplastics through the addition of well-recognized brands and intellectual properties of DuPont.September 2022: LANXESS introduced a sustainable polyamide resin, Durethan ECO, which consists of recycled fibers made from waste glass to reduce its carbon footprint.July 2022: BASF SE announced plans to expand its ultramid polyamide grade production capacity in India to meet the growing demand from automotive, electrical and electronics, industrial, and consumer goods applications.
9. What pricing options are available for accessing the report?
Pricing options include single-user, multi-user, and enterprise licenses priced at USD 3800, USD 4500, and USD 5800 respectively.
10. Is the market size provided in terms of value or volume?
The market size is provided in terms of value, measured in Million and volume, measured in K Tons.
11. Are there any specific market keywords associated with the report?
Yes, the market keyword associated with the report is "Polyamides Industry," which aids in identifying and referencing the specific market segment covered.
12. How do I determine which pricing option suits my needs best?
The pricing options vary based on user requirements and access needs. Individual users may opt for single-user licenses, while businesses requiring broader access may choose multi-user or enterprise licenses for cost-effective access to the report.
13. Are there any additional resources or data provided in the Polyamides Industry report?
While the report offers comprehensive insights, it's advisable to review the specific contents or supplementary materials provided to ascertain if additional resources or data are available.
14. How can I stay updated on further developments or reports in the Polyamides Industry?
To stay informed about further developments, trends, and reports in the Polyamides Industry, consider subscribing to industry newsletters, following relevant companies and organizations, or regularly checking reputable industry news sources and publications.
Methodology
Step 1 - Identification of Relevant Samples Size from Population Database


Step 2 - Approaches for Defining Global Market Size (Value, Volume* & Price*)

Note*: In applicable scenarios
Step 3 - Data Sources
Primary Research
- Web Analytics
- Survey Reports
- Research Institute
- Latest Research Reports
- Opinion Leaders
Secondary Research
- Annual Reports
- White Paper
- Latest Press Release
- Industry Association
- Paid Database
- Investor Presentations

Step 4 - Data Triangulation
Involves using different sources of information in order to increase the validity of a study
These sources are likely to be stakeholders in a program - participants, other researchers, program staff, other community members, and so on.
Then we put all data in single framework & apply various statistical tools to find out the dynamic on the market.
During the analysis stage, feedback from the stakeholder groups would be compared to determine areas of agreement as well as areas of divergence
