

Key Insights
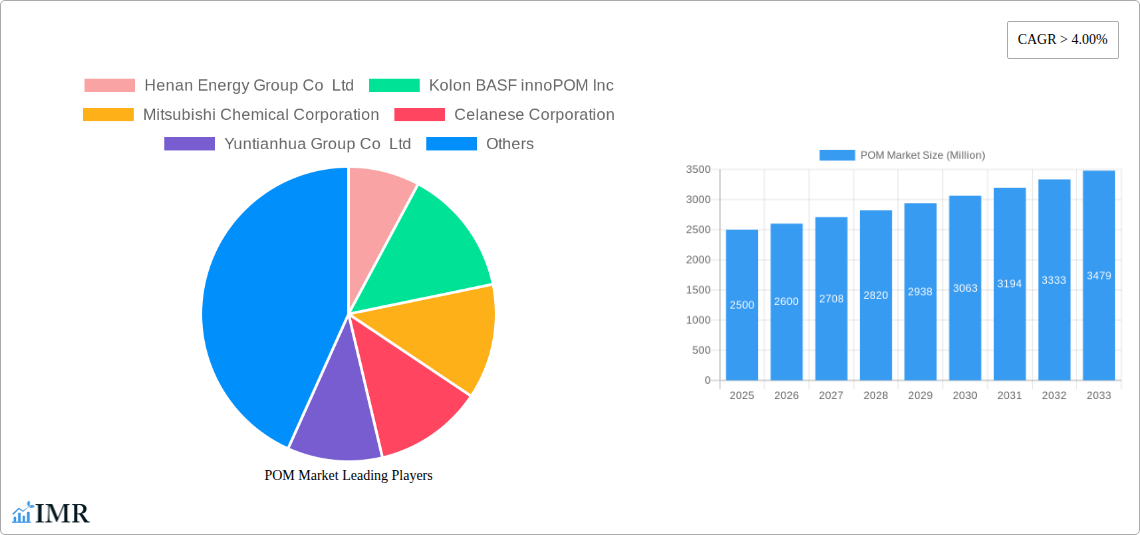
The global polyoxymethylene (POM) market is experiencing robust growth, projected to maintain a Compound Annual Growth Rate (CAGR) exceeding 4.00% from 2025 to 2033. This expansion is driven by the increasing demand from key end-user industries such as automotive, electrical and electronics, and industrial machinery. The automotive sector, in particular, is a significant driver due to the material's excellent mechanical strength, dimensional stability, and wear resistance, making it ideal for applications like gears, bearings, and fuel system components. The rising adoption of electric vehicles (EVs) further fuels this demand, as POM finds applications in various EV components. Growth in the electrical and electronics sector is propelled by its use in precision parts for consumer electronics and industrial automation equipment. The industrial machinery segment benefits from POM's ability to withstand harsh operating conditions and its self-lubricating properties. While the market faces challenges such as fluctuating raw material prices and potential environmental concerns related to plastic production, technological advancements in POM production and the development of more sustainable formulations are mitigating these risks. The market is segmented by end-user industry, with Aerospace, Automotive, Electrical & Electronics, and Industrial & Machinery representing the largest contributors. Major players like DuPont, Celanese, and SABIC continue to invest in research and development, enhancing the material's properties and expanding its applications. This competitive landscape fosters innovation and fuels the market's overall growth trajectory.
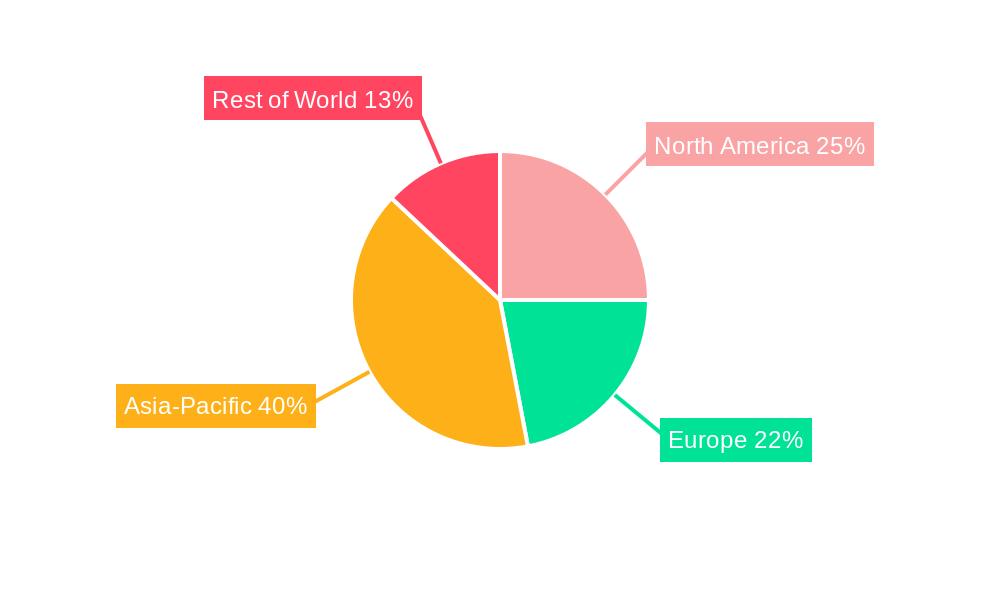
The market's geographic distribution is likely varied, with established industrial economies in North America, Europe, and Asia-Pacific holding significant shares. However, rapid industrialization in developing economies, particularly in Asia, is expected to drive significant growth in these regions over the forecast period. The competitive landscape is marked by established global players and regional manufacturers, leading to both price competition and innovation. The market will continue to see the introduction of high-performance POM variants with improved properties and specialized applications, further driving market expansion. The focus on sustainability will also influence market trends, pushing manufacturers to develop more environmentally friendly POM solutions and recycling technologies. Overall, the POM market presents significant opportunities for growth and innovation across diverse industrial sectors.
Polyoxymethylene (POM) Market: A Comprehensive Analysis (2019-2033)
This comprehensive report provides a detailed analysis of the global Polyoxymethylene (POM) market, encompassing market dynamics, growth trends, regional dominance, product landscape, key players, and future outlook. The study period covers 2019-2033, with 2025 as the base and estimated year. This in-depth analysis is essential for industry professionals, investors, and strategic decision-makers seeking to navigate the complexities and capitalize on the growth opportunities within this dynamic market. The report segments the market by end-user industry (Aerospace, Automotive, Electrical and Electronics, Industrial and Machinery, Other End-user Industries) to provide granular insights.
POM Market Market Dynamics & Structure
The global POM market is characterized by a moderately concentrated landscape with key players like Celanese Corporation, DuPont, and Mitsubishi Chemical Corporation holding significant market share. Technological innovation, particularly in high-performance POM grades, drives market growth, alongside stringent regulatory frameworks concerning material safety and sustainability. The market experiences competitive pressure from alternative materials like PBT and PET, particularly in price-sensitive applications. End-user demographics, particularly the growth of the automotive and electronics sectors, significantly impact market demand. M&A activity, as evidenced by recent deals (detailed below), further shapes the market structure.
- Market Concentration: Moderately concentrated, with top 5 players holding approximately xx% market share in 2024.
- Technological Innovation: Focus on high-performance grades with improved strength, durability, and chemical resistance.
- Regulatory Framework: Increasing emphasis on environmental compliance and safety regulations impacts material selection and production processes.
- Competitive Substitutes: PBT and PET pose significant competition, particularly in cost-sensitive applications.
- M&A Trends: Significant consolidation through mergers and acquisitions, leading to increased market share for larger players. The total value of M&A deals in the POM market from 2019-2024 reached approximately xx Million.
POM Market Growth Trends & Insights
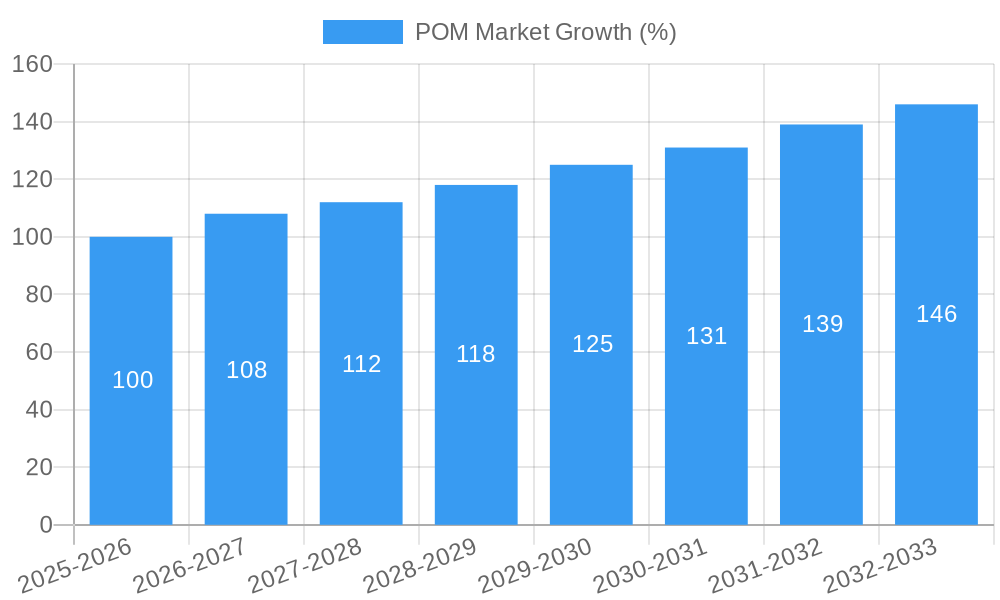
The global POM market is projected to witness robust growth during the forecast period (2025-2033), driven by increasing demand from various end-user industries. The automotive sector, particularly electric vehicles (EVs) and advanced driver-assistance systems (ADAS), presents a major growth driver. The electronics industry's demand for high-performance materials in consumer electronics and communication infrastructure further fuels market expansion. Technological advancements, such as the development of bio-based POM, contribute to market growth. Consumer behavior shifts towards sustainable and environmentally friendly materials also create new market opportunities.
- Market Size Evolution: The market size grew from xx Million in 2019 to xx Million in 2024, with a CAGR of xx%.
- Adoption Rates: High adoption rates in automotive and electronics industries drive market growth, with penetration rates expected to increase to xx% by 2033.
- Technological Disruptions: Introduction of bio-based and high-performance POM grades disrupts traditional market dynamics.
- Consumer Behavior Shifts: Increased preference for sustainable materials creates opportunities for eco-friendly POM solutions.
Dominant Regions, Countries, or Segments in POM Market
The Asia-Pacific region, particularly China, dominates the global POM market, driven by rapid industrialization, substantial automotive production, and a growing electronics sector. Strong economic growth and favorable government policies supporting infrastructure development further contribute to regional dominance. North America and Europe also hold significant market shares, driven by technological advancements and robust automotive and electronics industries. The automotive segment is the largest end-user industry, accounting for approximately xx% of the market share in 2024.
- Key Drivers (Asia-Pacific): Rapid industrialization, robust automotive and electronics industries, and supportive government policies.
- Key Drivers (North America): Technological innovation, high adoption of advanced technologies, and strong automotive industry.
- Key Drivers (Europe): Stringent environmental regulations, high adoption of sustainable materials, and technologically advanced automotive sector.
- Dominant Segment: Automotive industry, with a market share of xx% in 2024.
POM Market Product Landscape
POM resins are available in various grades, tailored for specific applications. High-performance grades offer enhanced mechanical properties, while specialized formulations cater to specific requirements in terms of temperature resistance, chemical resistance, and dimensional stability. Innovations focus on increasing the material's biodegradability and incorporating recycled content to meet sustainability goals. Unique selling propositions include superior strength-to-weight ratio, excellent dimensional stability, and resistance to various chemicals and solvents.
Key Drivers, Barriers & Challenges in POM Market
Key Drivers: Increasing demand from the automotive and electronics industries, technological advancements in high-performance grades, and government regulations promoting sustainable materials. Growing infrastructure development in emerging economies also significantly impacts growth.
Key Challenges: Fluctuations in raw material prices, competition from alternative materials (PBT, PET), and potential supply chain disruptions due to geopolitical uncertainties. Furthermore, maintaining sustainability while achieving cost-effectiveness remains a crucial challenge for manufacturers.
Emerging Opportunities in POM Market
Emerging opportunities lie in the growing demand for lightweight materials in automotive and aerospace applications, the development of bio-based and recycled POM, and the expansion into new markets, such as medical devices and 3D printing.
Growth Accelerators in the POM Market Industry
Technological advancements leading to high-performance grades, strategic partnerships between material suppliers and end-users, and focused market expansion into high-growth sectors (e.g., renewable energy) will accelerate long-term growth.
Key Players Shaping the POM Market Market
- Henan Energy Group Co Ltd
- Kolon BASF innoPOM Inc
- Mitsubishi Chemical Corporation
- Celanese Corporation
- Yuntianhua Group Co Ltd
- Korea Engineering Plastics Co Ltd
- SABIC
- DuPont
- China BlueChemical Ltd
- Daicel Corporation
Notable Milestones in POM Market Sector
- May 2022: MGC expanded its production facility for POM resin in China by acquiring a 30% equity stake in P Holdings Inc. through its Global Polyacetal Co. Ltd subsidiary. This significantly boosted production capacity and market presence in a key region.
- March 2022: Celanese Corporation completed the restructuring of Korea Engineering Plastics Co. (KEP), gaining access to approximately 70KTA of POM production in Asia and global marketing rights. This strengthened Celanese's position in the Asian market.
- February 2022: DuPont announced definitive agreements with Celanese Corporation to divest a majority of its Mobility & Materials segment. This restructuring significantly altered the competitive landscape.
In-Depth POM Market Market Outlook
The POM market is poised for continued growth, driven by technological innovations, strategic partnerships, and expanding applications across diverse industries. The focus on sustainable materials and lightweight solutions will further fuel market expansion. Strategic acquisitions and collaborations among key players will shape future market dynamics, creating both opportunities and challenges for market participants. The long-term outlook remains positive, with substantial potential for market expansion and innovation.
POM Market Segmentation
- 1. Production Analysis
- 2. Consumption Analysis
- 3. Import Market Analysis (Value & Volume)
- 4. Export Market Analysis (Value & Volume)
- 5. Price Trend Analysis
POM Market Segmentation By Geography
-
1. North America
- 1.1. United States
- 1.2. Canada
- 1.3. Mexico
-
2. South America
- 2.1. Brazil
- 2.2. Argentina
- 2.3. Rest of South America
-
3. Europe
- 3.1. United Kingdom
- 3.2. Germany
- 3.3. France
- 3.4. Italy
- 3.5. Spain
- 3.6. Russia
- 3.7. Benelux
- 3.8. Nordics
- 3.9. Rest of Europe
-
4. Middle East & Africa
- 4.1. Turkey
- 4.2. Israel
- 4.3. GCC
- 4.4. North Africa
- 4.5. South Africa
- 4.6. Rest of Middle East & Africa
-
5. Asia Pacific
- 5.1. China
- 5.2. India
- 5.3. Japan
- 5.4. South Korea
- 5.5. ASEAN
- 5.6. Oceania
- 5.7. Rest of Asia Pacific
POM Market REPORT HIGHLIGHTS
| Aspects | Details |
|---|---|
| Study Period | 2019-2033 |
| Base Year | 2024 |
| Estimated Year | 2025 |
| Forecast Period | 2025-2033 |
| Historical Period | 2019-2024 |
| Growth Rate | CAGR of > 4.00% from 2019-2033 |
| Segmentation |
|
Table of Contents
- 1. Introduction
- 1.1. Research Scope
- 1.2. Market Segmentation
- 1.3. Research Methodology
- 1.4. Definitions and Assumptions
- 2. Executive Summary
- 2.1. Introduction
- 3. Market Dynamics
- 3.1. Introduction
- 3.2. Market Drivers
- 3.2.1. Increasing Application of PFA Resin in the Semiconductor Industry; Increasing Demand for High- and Ultra High-purity PFA in Critical Fluid Transport Tubing Applications
- 3.3. Market Restrains
- 3.3.1. Environmental and Health Hazards Associated With PFA; Other Restraints
- 3.4. Market Trends
- 3.4.1. OTHER KEY INDUSTRY TRENDS COVERED IN THE REPORT
- 4. Market Factor Analysis
- 4.1. Porters Five Forces
- 4.2. Supply/Value Chain
- 4.3. PESTEL analysis
- 4.4. Market Entropy
- 4.5. Patent/Trademark Analysis
- 5. Global POM Market Analysis, Insights and Forecast, 2019-2031
- 5.1. Market Analysis, Insights and Forecast - by Production Analysis
- 5.2. Market Analysis, Insights and Forecast - by Consumption Analysis
- 5.3. Market Analysis, Insights and Forecast - by Import Market Analysis (Value & Volume)
- 5.4. Market Analysis, Insights and Forecast - by Export Market Analysis (Value & Volume)
- 5.5. Market Analysis, Insights and Forecast - by Price Trend Analysis
- 5.6. Market Analysis, Insights and Forecast - by Region
- 5.6.1. North America
- 5.6.2. South America
- 5.6.3. Europe
- 5.6.4. Middle East & Africa
- 5.6.5. Asia Pacific
- 5.1. Market Analysis, Insights and Forecast - by Production Analysis
- 6. North America POM Market Analysis, Insights and Forecast, 2019-2031
- 6.1. Market Analysis, Insights and Forecast - by Production Analysis
- 6.2. Market Analysis, Insights and Forecast - by Consumption Analysis
- 6.3. Market Analysis, Insights and Forecast - by Import Market Analysis (Value & Volume)
- 6.4. Market Analysis, Insights and Forecast - by Export Market Analysis (Value & Volume)
- 6.5. Market Analysis, Insights and Forecast - by Price Trend Analysis
- 6.1. Market Analysis, Insights and Forecast - by Production Analysis
- 7. South America POM Market Analysis, Insights and Forecast, 2019-2031
- 7.1. Market Analysis, Insights and Forecast - by Production Analysis
- 7.2. Market Analysis, Insights and Forecast - by Consumption Analysis
- 7.3. Market Analysis, Insights and Forecast - by Import Market Analysis (Value & Volume)
- 7.4. Market Analysis, Insights and Forecast - by Export Market Analysis (Value & Volume)
- 7.5. Market Analysis, Insights and Forecast - by Price Trend Analysis
- 7.1. Market Analysis, Insights and Forecast - by Production Analysis
- 8. Europe POM Market Analysis, Insights and Forecast, 2019-2031
- 8.1. Market Analysis, Insights and Forecast - by Production Analysis
- 8.2. Market Analysis, Insights and Forecast - by Consumption Analysis
- 8.3. Market Analysis, Insights and Forecast - by Import Market Analysis (Value & Volume)
- 8.4. Market Analysis, Insights and Forecast - by Export Market Analysis (Value & Volume)
- 8.5. Market Analysis, Insights and Forecast - by Price Trend Analysis
- 8.1. Market Analysis, Insights and Forecast - by Production Analysis
- 9. Middle East & Africa POM Market Analysis, Insights and Forecast, 2019-2031
- 9.1. Market Analysis, Insights and Forecast - by Production Analysis
- 9.2. Market Analysis, Insights and Forecast - by Consumption Analysis
- 9.3. Market Analysis, Insights and Forecast - by Import Market Analysis (Value & Volume)
- 9.4. Market Analysis, Insights and Forecast - by Export Market Analysis (Value & Volume)
- 9.5. Market Analysis, Insights and Forecast - by Price Trend Analysis
- 9.1. Market Analysis, Insights and Forecast - by Production Analysis
- 10. Asia Pacific POM Market Analysis, Insights and Forecast, 2019-2031
- 10.1. Market Analysis, Insights and Forecast - by Production Analysis
- 10.2. Market Analysis, Insights and Forecast - by Consumption Analysis
- 10.3. Market Analysis, Insights and Forecast - by Import Market Analysis (Value & Volume)
- 10.4. Market Analysis, Insights and Forecast - by Export Market Analysis (Value & Volume)
- 10.5. Market Analysis, Insights and Forecast - by Price Trend Analysis
- 10.1. Market Analysis, Insights and Forecast - by Production Analysis
- 11. Competitive Analysis
- 11.1. Global Market Share Analysis 2024
- 11.2. Company Profiles
- 11.2.1 Henan Energy Group Co Ltd
- 11.2.1.1. Overview
- 11.2.1.2. Products
- 11.2.1.3. SWOT Analysis
- 11.2.1.4. Recent Developments
- 11.2.1.5. Financials (Based on Availability)
- 11.2.2 Kolon BASF innoPOM Inc
- 11.2.2.1. Overview
- 11.2.2.2. Products
- 11.2.2.3. SWOT Analysis
- 11.2.2.4. Recent Developments
- 11.2.2.5. Financials (Based on Availability)
- 11.2.3 Mitsubishi Chemical Corporation
- 11.2.3.1. Overview
- 11.2.3.2. Products
- 11.2.3.3. SWOT Analysis
- 11.2.3.4. Recent Developments
- 11.2.3.5. Financials (Based on Availability)
- 11.2.4 Celanese Corporation
- 11.2.4.1. Overview
- 11.2.4.2. Products
- 11.2.4.3. SWOT Analysis
- 11.2.4.4. Recent Developments
- 11.2.4.5. Financials (Based on Availability)
- 11.2.5 Yuntianhua Group Co Ltd
- 11.2.5.1. Overview
- 11.2.5.2. Products
- 11.2.5.3. SWOT Analysis
- 11.2.5.4. Recent Developments
- 11.2.5.5. Financials (Based on Availability)
- 11.2.6 Korea Engineering Plastics Co Ltd
- 11.2.6.1. Overview
- 11.2.6.2. Products
- 11.2.6.3. SWOT Analysis
- 11.2.6.4. Recent Developments
- 11.2.6.5. Financials (Based on Availability)
- 11.2.7 SABIC
- 11.2.7.1. Overview
- 11.2.7.2. Products
- 11.2.7.3. SWOT Analysis
- 11.2.7.4. Recent Developments
- 11.2.7.5. Financials (Based on Availability)
- 11.2.8 DuPont
- 11.2.8.1. Overview
- 11.2.8.2. Products
- 11.2.8.3. SWOT Analysis
- 11.2.8.4. Recent Developments
- 11.2.8.5. Financials (Based on Availability)
- 11.2.9 China BlueChemical Ltd
- 11.2.9.1. Overview
- 11.2.9.2. Products
- 11.2.9.3. SWOT Analysis
- 11.2.9.4. Recent Developments
- 11.2.9.5. Financials (Based on Availability)
- 11.2.10 Daicel Corporation
- 11.2.10.1. Overview
- 11.2.10.2. Products
- 11.2.10.3. SWOT Analysis
- 11.2.10.4. Recent Developments
- 11.2.10.5. Financials (Based on Availability)
- 11.2.1 Henan Energy Group Co Ltd
List of Figures
- Figure 1: Global POM Market Revenue Breakdown (Million, %) by Region 2024 & 2032
- Figure 2: North America POM Market Revenue (Million), by Production Analysis 2024 & 2032
- Figure 3: North America POM Market Revenue Share (%), by Production Analysis 2024 & 2032
- Figure 4: North America POM Market Revenue (Million), by Consumption Analysis 2024 & 2032
- Figure 5: North America POM Market Revenue Share (%), by Consumption Analysis 2024 & 2032
- Figure 6: North America POM Market Revenue (Million), by Import Market Analysis (Value & Volume) 2024 & 2032
- Figure 7: North America POM Market Revenue Share (%), by Import Market Analysis (Value & Volume) 2024 & 2032
- Figure 8: North America POM Market Revenue (Million), by Export Market Analysis (Value & Volume) 2024 & 2032
- Figure 9: North America POM Market Revenue Share (%), by Export Market Analysis (Value & Volume) 2024 & 2032
- Figure 10: North America POM Market Revenue (Million), by Price Trend Analysis 2024 & 2032
- Figure 11: North America POM Market Revenue Share (%), by Price Trend Analysis 2024 & 2032
- Figure 12: North America POM Market Revenue (Million), by Country 2024 & 2032
- Figure 13: North America POM Market Revenue Share (%), by Country 2024 & 2032
- Figure 14: South America POM Market Revenue (Million), by Production Analysis 2024 & 2032
- Figure 15: South America POM Market Revenue Share (%), by Production Analysis 2024 & 2032
- Figure 16: South America POM Market Revenue (Million), by Consumption Analysis 2024 & 2032
- Figure 17: South America POM Market Revenue Share (%), by Consumption Analysis 2024 & 2032
- Figure 18: South America POM Market Revenue (Million), by Import Market Analysis (Value & Volume) 2024 & 2032
- Figure 19: South America POM Market Revenue Share (%), by Import Market Analysis (Value & Volume) 2024 & 2032
- Figure 20: South America POM Market Revenue (Million), by Export Market Analysis (Value & Volume) 2024 & 2032
- Figure 21: South America POM Market Revenue Share (%), by Export Market Analysis (Value & Volume) 2024 & 2032
- Figure 22: South America POM Market Revenue (Million), by Price Trend Analysis 2024 & 2032
- Figure 23: South America POM Market Revenue Share (%), by Price Trend Analysis 2024 & 2032
- Figure 24: South America POM Market Revenue (Million), by Country 2024 & 2032
- Figure 25: South America POM Market Revenue Share (%), by Country 2024 & 2032
- Figure 26: Europe POM Market Revenue (Million), by Production Analysis 2024 & 2032
- Figure 27: Europe POM Market Revenue Share (%), by Production Analysis 2024 & 2032
- Figure 28: Europe POM Market Revenue (Million), by Consumption Analysis 2024 & 2032
- Figure 29: Europe POM Market Revenue Share (%), by Consumption Analysis 2024 & 2032
- Figure 30: Europe POM Market Revenue (Million), by Import Market Analysis (Value & Volume) 2024 & 2032
- Figure 31: Europe POM Market Revenue Share (%), by Import Market Analysis (Value & Volume) 2024 & 2032
- Figure 32: Europe POM Market Revenue (Million), by Export Market Analysis (Value & Volume) 2024 & 2032
- Figure 33: Europe POM Market Revenue Share (%), by Export Market Analysis (Value & Volume) 2024 & 2032
- Figure 34: Europe POM Market Revenue (Million), by Price Trend Analysis 2024 & 2032
- Figure 35: Europe POM Market Revenue Share (%), by Price Trend Analysis 2024 & 2032
- Figure 36: Europe POM Market Revenue (Million), by Country 2024 & 2032
- Figure 37: Europe POM Market Revenue Share (%), by Country 2024 & 2032
- Figure 38: Middle East & Africa POM Market Revenue (Million), by Production Analysis 2024 & 2032
- Figure 39: Middle East & Africa POM Market Revenue Share (%), by Production Analysis 2024 & 2032
- Figure 40: Middle East & Africa POM Market Revenue (Million), by Consumption Analysis 2024 & 2032
- Figure 41: Middle East & Africa POM Market Revenue Share (%), by Consumption Analysis 2024 & 2032
- Figure 42: Middle East & Africa POM Market Revenue (Million), by Import Market Analysis (Value & Volume) 2024 & 2032
- Figure 43: Middle East & Africa POM Market Revenue Share (%), by Import Market Analysis (Value & Volume) 2024 & 2032
- Figure 44: Middle East & Africa POM Market Revenue (Million), by Export Market Analysis (Value & Volume) 2024 & 2032
- Figure 45: Middle East & Africa POM Market Revenue Share (%), by Export Market Analysis (Value & Volume) 2024 & 2032
- Figure 46: Middle East & Africa POM Market Revenue (Million), by Price Trend Analysis 2024 & 2032
- Figure 47: Middle East & Africa POM Market Revenue Share (%), by Price Trend Analysis 2024 & 2032
- Figure 48: Middle East & Africa POM Market Revenue (Million), by Country 2024 & 2032
- Figure 49: Middle East & Africa POM Market Revenue Share (%), by Country 2024 & 2032
- Figure 50: Asia Pacific POM Market Revenue (Million), by Production Analysis 2024 & 2032
- Figure 51: Asia Pacific POM Market Revenue Share (%), by Production Analysis 2024 & 2032
- Figure 52: Asia Pacific POM Market Revenue (Million), by Consumption Analysis 2024 & 2032
- Figure 53: Asia Pacific POM Market Revenue Share (%), by Consumption Analysis 2024 & 2032
- Figure 54: Asia Pacific POM Market Revenue (Million), by Import Market Analysis (Value & Volume) 2024 & 2032
- Figure 55: Asia Pacific POM Market Revenue Share (%), by Import Market Analysis (Value & Volume) 2024 & 2032
- Figure 56: Asia Pacific POM Market Revenue (Million), by Export Market Analysis (Value & Volume) 2024 & 2032
- Figure 57: Asia Pacific POM Market Revenue Share (%), by Export Market Analysis (Value & Volume) 2024 & 2032
- Figure 58: Asia Pacific POM Market Revenue (Million), by Price Trend Analysis 2024 & 2032
- Figure 59: Asia Pacific POM Market Revenue Share (%), by Price Trend Analysis 2024 & 2032
- Figure 60: Asia Pacific POM Market Revenue (Million), by Country 2024 & 2032
- Figure 61: Asia Pacific POM Market Revenue Share (%), by Country 2024 & 2032
List of Tables
- Table 1: Global POM Market Revenue Million Forecast, by Region 2019 & 2032
- Table 2: Global POM Market Revenue Million Forecast, by Production Analysis 2019 & 2032
- Table 3: Global POM Market Revenue Million Forecast, by Consumption Analysis 2019 & 2032
- Table 4: Global POM Market Revenue Million Forecast, by Import Market Analysis (Value & Volume) 2019 & 2032
- Table 5: Global POM Market Revenue Million Forecast, by Export Market Analysis (Value & Volume) 2019 & 2032
- Table 6: Global POM Market Revenue Million Forecast, by Price Trend Analysis 2019 & 2032
- Table 7: Global POM Market Revenue Million Forecast, by Region 2019 & 2032
- Table 8: Global POM Market Revenue Million Forecast, by Production Analysis 2019 & 2032
- Table 9: Global POM Market Revenue Million Forecast, by Consumption Analysis 2019 & 2032
- Table 10: Global POM Market Revenue Million Forecast, by Import Market Analysis (Value & Volume) 2019 & 2032
- Table 11: Global POM Market Revenue Million Forecast, by Export Market Analysis (Value & Volume) 2019 & 2032
- Table 12: Global POM Market Revenue Million Forecast, by Price Trend Analysis 2019 & 2032
- Table 13: Global POM Market Revenue Million Forecast, by Country 2019 & 2032
- Table 14: United States POM Market Revenue (Million) Forecast, by Application 2019 & 2032
- Table 15: Canada POM Market Revenue (Million) Forecast, by Application 2019 & 2032
- Table 16: Mexico POM Market Revenue (Million) Forecast, by Application 2019 & 2032
- Table 17: Global POM Market Revenue Million Forecast, by Production Analysis 2019 & 2032
- Table 18: Global POM Market Revenue Million Forecast, by Consumption Analysis 2019 & 2032
- Table 19: Global POM Market Revenue Million Forecast, by Import Market Analysis (Value & Volume) 2019 & 2032
- Table 20: Global POM Market Revenue Million Forecast, by Export Market Analysis (Value & Volume) 2019 & 2032
- Table 21: Global POM Market Revenue Million Forecast, by Price Trend Analysis 2019 & 2032
- Table 22: Global POM Market Revenue Million Forecast, by Country 2019 & 2032
- Table 23: Brazil POM Market Revenue (Million) Forecast, by Application 2019 & 2032
- Table 24: Argentina POM Market Revenue (Million) Forecast, by Application 2019 & 2032
- Table 25: Rest of South America POM Market Revenue (Million) Forecast, by Application 2019 & 2032
- Table 26: Global POM Market Revenue Million Forecast, by Production Analysis 2019 & 2032
- Table 27: Global POM Market Revenue Million Forecast, by Consumption Analysis 2019 & 2032
- Table 28: Global POM Market Revenue Million Forecast, by Import Market Analysis (Value & Volume) 2019 & 2032
- Table 29: Global POM Market Revenue Million Forecast, by Export Market Analysis (Value & Volume) 2019 & 2032
- Table 30: Global POM Market Revenue Million Forecast, by Price Trend Analysis 2019 & 2032
- Table 31: Global POM Market Revenue Million Forecast, by Country 2019 & 2032
- Table 32: United Kingdom POM Market Revenue (Million) Forecast, by Application 2019 & 2032
- Table 33: Germany POM Market Revenue (Million) Forecast, by Application 2019 & 2032
- Table 34: France POM Market Revenue (Million) Forecast, by Application 2019 & 2032
- Table 35: Italy POM Market Revenue (Million) Forecast, by Application 2019 & 2032
- Table 36: Spain POM Market Revenue (Million) Forecast, by Application 2019 & 2032
- Table 37: Russia POM Market Revenue (Million) Forecast, by Application 2019 & 2032
- Table 38: Benelux POM Market Revenue (Million) Forecast, by Application 2019 & 2032
- Table 39: Nordics POM Market Revenue (Million) Forecast, by Application 2019 & 2032
- Table 40: Rest of Europe POM Market Revenue (Million) Forecast, by Application 2019 & 2032
- Table 41: Global POM Market Revenue Million Forecast, by Production Analysis 2019 & 2032
- Table 42: Global POM Market Revenue Million Forecast, by Consumption Analysis 2019 & 2032
- Table 43: Global POM Market Revenue Million Forecast, by Import Market Analysis (Value & Volume) 2019 & 2032
- Table 44: Global POM Market Revenue Million Forecast, by Export Market Analysis (Value & Volume) 2019 & 2032
- Table 45: Global POM Market Revenue Million Forecast, by Price Trend Analysis 2019 & 2032
- Table 46: Global POM Market Revenue Million Forecast, by Country 2019 & 2032
- Table 47: Turkey POM Market Revenue (Million) Forecast, by Application 2019 & 2032
- Table 48: Israel POM Market Revenue (Million) Forecast, by Application 2019 & 2032
- Table 49: GCC POM Market Revenue (Million) Forecast, by Application 2019 & 2032
- Table 50: North Africa POM Market Revenue (Million) Forecast, by Application 2019 & 2032
- Table 51: South Africa POM Market Revenue (Million) Forecast, by Application 2019 & 2032
- Table 52: Rest of Middle East & Africa POM Market Revenue (Million) Forecast, by Application 2019 & 2032
- Table 53: Global POM Market Revenue Million Forecast, by Production Analysis 2019 & 2032
- Table 54: Global POM Market Revenue Million Forecast, by Consumption Analysis 2019 & 2032
- Table 55: Global POM Market Revenue Million Forecast, by Import Market Analysis (Value & Volume) 2019 & 2032
- Table 56: Global POM Market Revenue Million Forecast, by Export Market Analysis (Value & Volume) 2019 & 2032
- Table 57: Global POM Market Revenue Million Forecast, by Price Trend Analysis 2019 & 2032
- Table 58: Global POM Market Revenue Million Forecast, by Country 2019 & 2032
- Table 59: China POM Market Revenue (Million) Forecast, by Application 2019 & 2032
- Table 60: India POM Market Revenue (Million) Forecast, by Application 2019 & 2032
- Table 61: Japan POM Market Revenue (Million) Forecast, by Application 2019 & 2032
- Table 62: South Korea POM Market Revenue (Million) Forecast, by Application 2019 & 2032
- Table 63: ASEAN POM Market Revenue (Million) Forecast, by Application 2019 & 2032
- Table 64: Oceania POM Market Revenue (Million) Forecast, by Application 2019 & 2032
- Table 65: Rest of Asia Pacific POM Market Revenue (Million) Forecast, by Application 2019 & 2032
Frequently Asked Questions
1. What is the projected Compound Annual Growth Rate (CAGR) of the POM Market?
The projected CAGR is approximately > 4.00%.
2. Which companies are prominent players in the POM Market?
Key companies in the market include Henan Energy Group Co Ltd, Kolon BASF innoPOM Inc, Mitsubishi Chemical Corporation, Celanese Corporation, Yuntianhua Group Co Ltd, Korea Engineering Plastics Co Ltd, SABIC, DuPont, China BlueChemical Ltd, Daicel Corporation.
3. What are the main segments of the POM Market?
The market segments include Production Analysis, Consumption Analysis, Import Market Analysis (Value & Volume), Export Market Analysis (Value & Volume), Price Trend Analysis.
4. Can you provide details about the market size?
The market size is estimated to be USD XX Million as of 2022.
5. What are some drivers contributing to market growth?
Increasing Application of PFA Resin in the Semiconductor Industry; Increasing Demand for High- and Ultra High-purity PFA in Critical Fluid Transport Tubing Applications.
6. What are the notable trends driving market growth?
OTHER KEY INDUSTRY TRENDS COVERED IN THE REPORT.
7. Are there any restraints impacting market growth?
Environmental and Health Hazards Associated With PFA; Other Restraints.
8. Can you provide examples of recent developments in the market?
May 2022: MGC expanded its production facility for POM resin in China by acquiring a 30% equity stake in P Holdings Inc. through its Global Polyacetal Co. Ltd subsidiary.March 2022: Celanese Corporation announced the completion of the restructuring of Korea Engineering Plastics Co. (KEP), a joint venture owned 50% by Celanese and 50% by Mitsubishi Gas Chemical Company Inc. With the completion, Celanese had access to approximately 70KTA of POM production in Asia and corresponding global marketing rights.February 2022: DuPont announced definitive agreements with Celanese Corporation to divest a majority of its Mobility & Materials segment, excluding certain Advanced Solutions and Performance Resins businesses.
9. What pricing options are available for accessing the report?
Pricing options include single-user, multi-user, and enterprise licenses priced at USD 3800, USD 4500, and USD 5800 respectively.
10. Is the market size provided in terms of value or volume?
The market size is provided in terms of value, measured in Million.
11. Are there any specific market keywords associated with the report?
Yes, the market keyword associated with the report is "POM Market," which aids in identifying and referencing the specific market segment covered.
12. How do I determine which pricing option suits my needs best?
The pricing options vary based on user requirements and access needs. Individual users may opt for single-user licenses, while businesses requiring broader access may choose multi-user or enterprise licenses for cost-effective access to the report.
13. Are there any additional resources or data provided in the POM Market report?
While the report offers comprehensive insights, it's advisable to review the specific contents or supplementary materials provided to ascertain if additional resources or data are available.
14. How can I stay updated on further developments or reports in the POM Market?
To stay informed about further developments, trends, and reports in the POM Market, consider subscribing to industry newsletters, following relevant companies and organizations, or regularly checking reputable industry news sources and publications.
Methodology
Step 1 - Identification of Relevant Samples Size from Population Database


Step 2 - Approaches for Defining Global Market Size (Value, Volume* & Price*)

Note*: In applicable scenarios
Step 3 - Data Sources
Primary Research
- Web Analytics
- Survey Reports
- Research Institute
- Latest Research Reports
- Opinion Leaders
Secondary Research
- Annual Reports
- White Paper
- Latest Press Release
- Industry Association
- Paid Database
- Investor Presentations

Step 4 - Data Triangulation
Involves using different sources of information in order to increase the validity of a study
These sources are likely to be stakeholders in a program - participants, other researchers, program staff, other community members, and so on.
Then we put all data in single framework & apply various statistical tools to find out the dynamic on the market.
During the analysis stage, feedback from the stakeholder groups would be compared to determine areas of agreement as well as areas of divergence
