

Key Insights
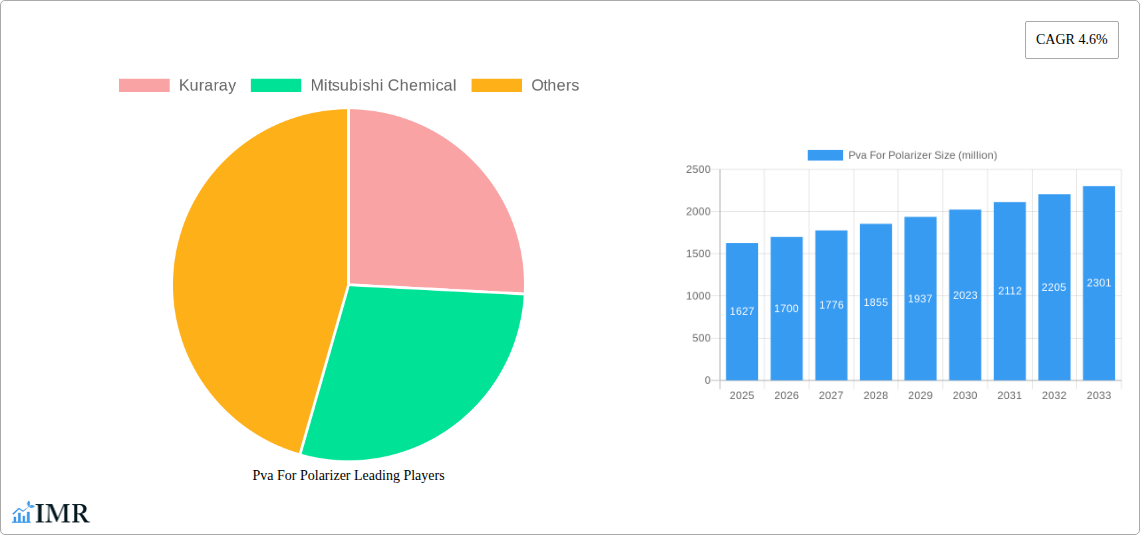
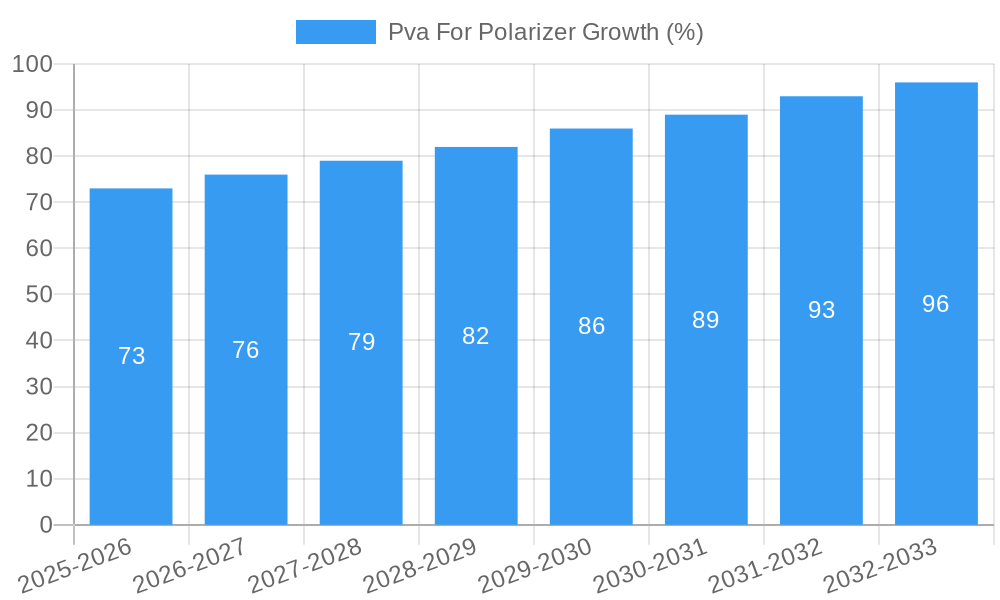
The PVA for Polarizer market, currently valued at $1627 million in 2025, is projected to experience steady growth, driven by the increasing demand for high-quality displays in consumer electronics and automotive applications. The compound annual growth rate (CAGR) of 4.6% from 2025 to 2033 indicates a consistent expansion, fueled by technological advancements leading to improved polarizer performance and efficiency. Key drivers include the rising adoption of LCD and OLED displays in smartphones, tablets, laptops, and televisions, as well as the growing penetration of advanced driver-assistance systems (ADAS) and infotainment systems in vehicles. Furthermore, the ongoing miniaturization of electronic devices and the trend towards larger, higher-resolution displays contribute to the market's upward trajectory. While potential restraints such as the emergence of alternative display technologies and fluctuations in raw material prices could impact growth, the overall market outlook remains positive, with key players like Kuraray and Mitsubishi Chemical actively contributing to innovation and expansion.
The market segmentation likely includes various PVA types based on their properties and applications, catering to different display resolutions and performance requirements. Regional variations in demand will be influenced by factors such as manufacturing hubs, consumer spending patterns, and government regulations. The forecast period of 2025-2033 suggests a continuous expansion of the market, driven by ongoing technological improvements, and increasing demand from various end-use industries. The historical period (2019-2024) provides a baseline for understanding past market performance, which would show a similar, though possibly slower, growth trajectory due to the nascent stage of adoption of these technologies during that time. Future market size projections will account for the sustained growth, though at a manageable pace due to the predicted market saturation in the latter half of the forecast period.
PVA for Polarizer Market Report: 2019-2033
This comprehensive report provides an in-depth analysis of the PVA for Polarizer market, encompassing market dynamics, growth trends, regional analysis, product landscape, key players, and future outlook. The study period covers 2019-2033, with a base year of 2025 and a forecast period of 2025-2033. The report is essential for industry professionals, investors, and strategic decision-makers seeking a clear understanding of this dynamic market.
Parent Market: Optical Films Market (xx million units in 2025) Child Market: Polarizing Film Market (xx million units in 2025)
PVA for Polarizer Market Dynamics & Structure
This section analyzes the market structure, identifying key dynamics influencing the PVA for Polarizer market. We explore market concentration, technological innovation drivers, regulatory frameworks, competitive product substitutes, end-user demographics, and M&A trends.
- Market Concentration: The market is moderately concentrated, with key players like Kuraray and Mitsubishi Chemical holding significant market share. In 2025, the top 3 players are estimated to hold approximately 60% of the market.
- Technological Innovation: Ongoing R&D focuses on enhancing PVA film properties like higher birefringence, improved transparency, and enhanced durability, driving market growth.
- Regulatory Framework: Stringent environmental regulations regarding volatile organic compound (VOC) emissions are influencing the manufacturing processes and material choices.
- Competitive Substitutes: Other polarizing film technologies, such as those based on polyvinyl alcohol (PVAc) and liquid crystal polymers (LCPs), pose a competitive challenge.
- End-User Demographics: The primary end-users are manufacturers of LCD displays, touchscreens, and other optical devices. Growth in these sectors directly impacts PVA for polarizer demand.
- M&A Trends: The past five years have seen xx M&A deals, primarily focused on consolidating production capacity and expanding geographical reach. This trend is expected to continue, although at a slower pace (xx deals projected for 2025-2033).
PVA for Polarizer Growth Trends & Insights
Analyzing historical data from 2019-2024 and leveraging proprietary market models, this section projects the market size evolution, adoption rates, and impact of technological disruptions and consumer behavior shifts.
The PVA for Polarizer market exhibited a CAGR of xx% during the historical period (2019-2024). Market size in 2024 is estimated at xx million units. We project a CAGR of xx% during the forecast period (2025-2033), reaching xx million units by 2033. This growth is primarily driven by increased demand for high-resolution displays in consumer electronics and automotive applications. The rising adoption of advanced display technologies, such as OLED and QLED, presents both opportunities and challenges for PVA for polarizers, impacting market penetration and the need for adaptation and innovation. The shift towards flexible and foldable displays is another major factor influencing market growth and necessitating the development of new PVA film formulations with enhanced flexibility and durability.
Dominant Regions, Countries, or Segments in PVA for Polarizer
This section identifies the leading regions and segments driving market growth.
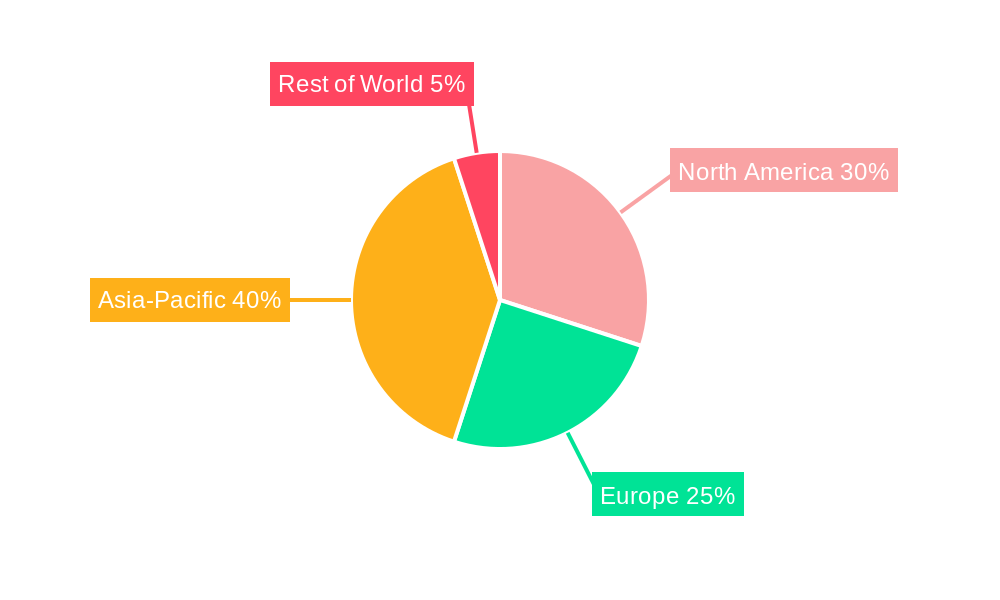
- Asia-Pacific: This region dominates the market, driven by the robust electronics manufacturing industry, particularly in China, South Korea, and Japan. Factors include lower manufacturing costs, established supply chains, and high consumer demand. Market share in 2025 is estimated at xx%.
- North America: Holds a significant share (xx% in 2025) due to high adoption of advanced display technologies and strong demand from the automotive sector. Government initiatives promoting domestic manufacturing also play a role.
- Europe: Exhibits slower growth compared to Asia-Pacific but remains a significant market (xx% in 2025), driven by advancements in display technology and automotive applications.
Key Drivers:
- Strong growth in consumer electronics, particularly smartphones and tablets.
- Rising demand for high-resolution displays in automotive applications.
- Government incentives and subsidies supporting the development of advanced display technologies.
PVA for Polarizer Product Landscape
PVA for polarizers are increasingly characterized by enhanced optical properties, improved durability, and thinner film designs. Recent innovations include films with reduced haze and improved light transmittance, resulting in better image quality and power efficiency. These advancements cater to the growing demand for higher-resolution displays in smartphones, tablets, and automotive applications. The trend towards flexible and foldable displays necessitates the development of PVA films with superior flexibility and durability. Specific performance metrics such as birefringence, retardation, and haze are critical factors influencing product selection.
Key Drivers, Barriers & Challenges in PVA for Polarizer
Key Drivers:
The growth of the flat-panel display market is the primary driver. Advancements in display technology, such as high-resolution displays and flexible screens, are creating additional demand. The increasing use of polarizers in automotive applications is also contributing to market growth.
Key Challenges:
The market faces challenges from alternative polarizing technologies, such as those using liquid crystal polymers. Supply chain disruptions and fluctuations in raw material prices pose significant challenges. Meeting stringent environmental regulations adds to manufacturing costs.
Emerging Opportunities in PVA for Polarizer
Emerging opportunities include the expansion into new markets, such as augmented reality (AR) and virtual reality (VR) devices. The development of PVA films for flexible displays and other advanced display applications presents significant growth potential. The increasing demand for energy-efficient displays is driving the development of PVA films with improved light transmittance.
Growth Accelerators in the Pva For Polarizer Industry
Technological advancements in PVA film manufacturing, leading to enhanced optical properties and cost reduction, are significant growth catalysts. Strategic partnerships between PVA manufacturers and display panel producers facilitate technology transfer and access to markets. Expansion into new applications, such as automotive displays and wearable technology, is another key growth driver.
Key Players Shaping the PVA for Polarizer Market
Notable Milestones in PVA for Polarizer Sector
- 2020: Kuraray launched a new PVA film with improved light transmittance.
- 2022: Mitsubishi Chemical announced a strategic partnership to expand its production capacity.
- 2023: Significant investments in R&D for flexible display applications were reported by several major players.
In-Depth PVA for Polarizer Market Outlook
The PVA for polarizer market is poised for continued growth, driven by technological advancements, increasing demand from consumer electronics and automotive sectors, and expansion into new applications. Strategic partnerships and investments in R&D will be crucial for maintaining a competitive edge. The market is expected to witness significant consolidation, with larger players acquiring smaller companies to expand their market share and production capabilities. The development of sustainable and environmentally friendly manufacturing processes will become increasingly important in the coming years.
Pva For Polarizer Segmentation
-
1. Application
- 1.1. LCD Display
- 1.2. OLED Display
- 1.3. Other
-
2. Type
- 2.1. PVA Film
- 2.2. PVA Adhesive
Pva For Polarizer Segmentation By Geography
-
1. North America
- 1.1. United States
- 1.2. Canada
- 1.3. Mexico
-
2. South America
- 2.1. Brazil
- 2.2. Argentina
- 2.3. Rest of South America
-
3. Europe
- 3.1. United Kingdom
- 3.2. Germany
- 3.3. France
- 3.4. Italy
- 3.5. Spain
- 3.6. Russia
- 3.7. Benelux
- 3.8. Nordics
- 3.9. Rest of Europe
-
4. Middle East & Africa
- 4.1. Turkey
- 4.2. Israel
- 4.3. GCC
- 4.4. North Africa
- 4.5. South Africa
- 4.6. Rest of Middle East & Africa
-
5. Asia Pacific
- 5.1. China
- 5.2. India
- 5.3. Japan
- 5.4. South Korea
- 5.5. ASEAN
- 5.6. Oceania
- 5.7. Rest of Asia Pacific
Pva For Polarizer REPORT HIGHLIGHTS
| Aspects | Details |
|---|---|
| Study Period | 2019-2033 |
| Base Year | 2024 |
| Estimated Year | 2025 |
| Forecast Period | 2025-2033 |
| Historical Period | 2019-2024 |
| Growth Rate | CAGR of 4.6% from 2019-2033 |
| Segmentation |
|
Table of Contents
- 1. Introduction
- 1.1. Research Scope
- 1.2. Market Segmentation
- 1.3. Research Methodology
- 1.4. Definitions and Assumptions
- 2. Executive Summary
- 2.1. Introduction
- 3. Market Dynamics
- 3.1. Introduction
- 3.2. Market Drivers
- 3.3. Market Restrains
- 3.4. Market Trends
- 4. Market Factor Analysis
- 4.1. Porters Five Forces
- 4.2. Supply/Value Chain
- 4.3. PESTEL analysis
- 4.4. Market Entropy
- 4.5. Patent/Trademark Analysis
- 5. Global Pva For Polarizer Analysis, Insights and Forecast, 2019-2031
- 5.1. Market Analysis, Insights and Forecast - by Application
- 5.1.1. LCD Display
- 5.1.2. OLED Display
- 5.1.3. Other
- 5.2. Market Analysis, Insights and Forecast - by Type
- 5.2.1. PVA Film
- 5.2.2. PVA Adhesive
- 5.3. Market Analysis, Insights and Forecast - by Region
- 5.3.1. North America
- 5.3.2. South America
- 5.3.3. Europe
- 5.3.4. Middle East & Africa
- 5.3.5. Asia Pacific
- 5.1. Market Analysis, Insights and Forecast - by Application
- 6. North America Pva For Polarizer Analysis, Insights and Forecast, 2019-2031
- 6.1. Market Analysis, Insights and Forecast - by Application
- 6.1.1. LCD Display
- 6.1.2. OLED Display
- 6.1.3. Other
- 6.2. Market Analysis, Insights and Forecast - by Type
- 6.2.1. PVA Film
- 6.2.2. PVA Adhesive
- 6.1. Market Analysis, Insights and Forecast - by Application
- 7. South America Pva For Polarizer Analysis, Insights and Forecast, 2019-2031
- 7.1. Market Analysis, Insights and Forecast - by Application
- 7.1.1. LCD Display
- 7.1.2. OLED Display
- 7.1.3. Other
- 7.2. Market Analysis, Insights and Forecast - by Type
- 7.2.1. PVA Film
- 7.2.2. PVA Adhesive
- 7.1. Market Analysis, Insights and Forecast - by Application
- 8. Europe Pva For Polarizer Analysis, Insights and Forecast, 2019-2031
- 8.1. Market Analysis, Insights and Forecast - by Application
- 8.1.1. LCD Display
- 8.1.2. OLED Display
- 8.1.3. Other
- 8.2. Market Analysis, Insights and Forecast - by Type
- 8.2.1. PVA Film
- 8.2.2. PVA Adhesive
- 8.1. Market Analysis, Insights and Forecast - by Application
- 9. Middle East & Africa Pva For Polarizer Analysis, Insights and Forecast, 2019-2031
- 9.1. Market Analysis, Insights and Forecast - by Application
- 9.1.1. LCD Display
- 9.1.2. OLED Display
- 9.1.3. Other
- 9.2. Market Analysis, Insights and Forecast - by Type
- 9.2.1. PVA Film
- 9.2.2. PVA Adhesive
- 9.1. Market Analysis, Insights and Forecast - by Application
- 10. Asia Pacific Pva For Polarizer Analysis, Insights and Forecast, 2019-2031
- 10.1. Market Analysis, Insights and Forecast - by Application
- 10.1.1. LCD Display
- 10.1.2. OLED Display
- 10.1.3. Other
- 10.2. Market Analysis, Insights and Forecast - by Type
- 10.2.1. PVA Film
- 10.2.2. PVA Adhesive
- 10.1. Market Analysis, Insights and Forecast - by Application
- 11. Competitive Analysis
- 11.1. Global Market Share Analysis 2024
- 11.2. Company Profiles
- 11.2.1 Kuraray
- 11.2.1.1. Overview
- 11.2.1.2. Products
- 11.2.1.3. SWOT Analysis
- 11.2.1.4. Recent Developments
- 11.2.1.5. Financials (Based on Availability)
- 11.2.2 Mitsubishi Chemical
- 11.2.2.1. Overview
- 11.2.2.2. Products
- 11.2.2.3. SWOT Analysis
- 11.2.2.4. Recent Developments
- 11.2.2.5. Financials (Based on Availability)
- 11.2.1 Kuraray
List of Figures
- Figure 1: Global Pva For Polarizer Revenue Breakdown (million, %) by Region 2024 & 2032
- Figure 2: North America Pva For Polarizer Revenue (million), by Application 2024 & 2032
- Figure 3: North America Pva For Polarizer Revenue Share (%), by Application 2024 & 2032
- Figure 4: North America Pva For Polarizer Revenue (million), by Type 2024 & 2032
- Figure 5: North America Pva For Polarizer Revenue Share (%), by Type 2024 & 2032
- Figure 6: North America Pva For Polarizer Revenue (million), by Country 2024 & 2032
- Figure 7: North America Pva For Polarizer Revenue Share (%), by Country 2024 & 2032
- Figure 8: South America Pva For Polarizer Revenue (million), by Application 2024 & 2032
- Figure 9: South America Pva For Polarizer Revenue Share (%), by Application 2024 & 2032
- Figure 10: South America Pva For Polarizer Revenue (million), by Type 2024 & 2032
- Figure 11: South America Pva For Polarizer Revenue Share (%), by Type 2024 & 2032
- Figure 12: South America Pva For Polarizer Revenue (million), by Country 2024 & 2032
- Figure 13: South America Pva For Polarizer Revenue Share (%), by Country 2024 & 2032
- Figure 14: Europe Pva For Polarizer Revenue (million), by Application 2024 & 2032
- Figure 15: Europe Pva For Polarizer Revenue Share (%), by Application 2024 & 2032
- Figure 16: Europe Pva For Polarizer Revenue (million), by Type 2024 & 2032
- Figure 17: Europe Pva For Polarizer Revenue Share (%), by Type 2024 & 2032
- Figure 18: Europe Pva For Polarizer Revenue (million), by Country 2024 & 2032
- Figure 19: Europe Pva For Polarizer Revenue Share (%), by Country 2024 & 2032
- Figure 20: Middle East & Africa Pva For Polarizer Revenue (million), by Application 2024 & 2032
- Figure 21: Middle East & Africa Pva For Polarizer Revenue Share (%), by Application 2024 & 2032
- Figure 22: Middle East & Africa Pva For Polarizer Revenue (million), by Type 2024 & 2032
- Figure 23: Middle East & Africa Pva For Polarizer Revenue Share (%), by Type 2024 & 2032
- Figure 24: Middle East & Africa Pva For Polarizer Revenue (million), by Country 2024 & 2032
- Figure 25: Middle East & Africa Pva For Polarizer Revenue Share (%), by Country 2024 & 2032
- Figure 26: Asia Pacific Pva For Polarizer Revenue (million), by Application 2024 & 2032
- Figure 27: Asia Pacific Pva For Polarizer Revenue Share (%), by Application 2024 & 2032
- Figure 28: Asia Pacific Pva For Polarizer Revenue (million), by Type 2024 & 2032
- Figure 29: Asia Pacific Pva For Polarizer Revenue Share (%), by Type 2024 & 2032
- Figure 30: Asia Pacific Pva For Polarizer Revenue (million), by Country 2024 & 2032
- Figure 31: Asia Pacific Pva For Polarizer Revenue Share (%), by Country 2024 & 2032
List of Tables
- Table 1: Global Pva For Polarizer Revenue million Forecast, by Region 2019 & 2032
- Table 2: Global Pva For Polarizer Revenue million Forecast, by Application 2019 & 2032
- Table 3: Global Pva For Polarizer Revenue million Forecast, by Type 2019 & 2032
- Table 4: Global Pva For Polarizer Revenue million Forecast, by Region 2019 & 2032
- Table 5: Global Pva For Polarizer Revenue million Forecast, by Application 2019 & 2032
- Table 6: Global Pva For Polarizer Revenue million Forecast, by Type 2019 & 2032
- Table 7: Global Pva For Polarizer Revenue million Forecast, by Country 2019 & 2032
- Table 8: United States Pva For Polarizer Revenue (million) Forecast, by Application 2019 & 2032
- Table 9: Canada Pva For Polarizer Revenue (million) Forecast, by Application 2019 & 2032
- Table 10: Mexico Pva For Polarizer Revenue (million) Forecast, by Application 2019 & 2032
- Table 11: Global Pva For Polarizer Revenue million Forecast, by Application 2019 & 2032
- Table 12: Global Pva For Polarizer Revenue million Forecast, by Type 2019 & 2032
- Table 13: Global Pva For Polarizer Revenue million Forecast, by Country 2019 & 2032
- Table 14: Brazil Pva For Polarizer Revenue (million) Forecast, by Application 2019 & 2032
- Table 15: Argentina Pva For Polarizer Revenue (million) Forecast, by Application 2019 & 2032
- Table 16: Rest of South America Pva For Polarizer Revenue (million) Forecast, by Application 2019 & 2032
- Table 17: Global Pva For Polarizer Revenue million Forecast, by Application 2019 & 2032
- Table 18: Global Pva For Polarizer Revenue million Forecast, by Type 2019 & 2032
- Table 19: Global Pva For Polarizer Revenue million Forecast, by Country 2019 & 2032
- Table 20: United Kingdom Pva For Polarizer Revenue (million) Forecast, by Application 2019 & 2032
- Table 21: Germany Pva For Polarizer Revenue (million) Forecast, by Application 2019 & 2032
- Table 22: France Pva For Polarizer Revenue (million) Forecast, by Application 2019 & 2032
- Table 23: Italy Pva For Polarizer Revenue (million) Forecast, by Application 2019 & 2032
- Table 24: Spain Pva For Polarizer Revenue (million) Forecast, by Application 2019 & 2032
- Table 25: Russia Pva For Polarizer Revenue (million) Forecast, by Application 2019 & 2032
- Table 26: Benelux Pva For Polarizer Revenue (million) Forecast, by Application 2019 & 2032
- Table 27: Nordics Pva For Polarizer Revenue (million) Forecast, by Application 2019 & 2032
- Table 28: Rest of Europe Pva For Polarizer Revenue (million) Forecast, by Application 2019 & 2032
- Table 29: Global Pva For Polarizer Revenue million Forecast, by Application 2019 & 2032
- Table 30: Global Pva For Polarizer Revenue million Forecast, by Type 2019 & 2032
- Table 31: Global Pva For Polarizer Revenue million Forecast, by Country 2019 & 2032
- Table 32: Turkey Pva For Polarizer Revenue (million) Forecast, by Application 2019 & 2032
- Table 33: Israel Pva For Polarizer Revenue (million) Forecast, by Application 2019 & 2032
- Table 34: GCC Pva For Polarizer Revenue (million) Forecast, by Application 2019 & 2032
- Table 35: North Africa Pva For Polarizer Revenue (million) Forecast, by Application 2019 & 2032
- Table 36: South Africa Pva For Polarizer Revenue (million) Forecast, by Application 2019 & 2032
- Table 37: Rest of Middle East & Africa Pva For Polarizer Revenue (million) Forecast, by Application 2019 & 2032
- Table 38: Global Pva For Polarizer Revenue million Forecast, by Application 2019 & 2032
- Table 39: Global Pva For Polarizer Revenue million Forecast, by Type 2019 & 2032
- Table 40: Global Pva For Polarizer Revenue million Forecast, by Country 2019 & 2032
- Table 41: China Pva For Polarizer Revenue (million) Forecast, by Application 2019 & 2032
- Table 42: India Pva For Polarizer Revenue (million) Forecast, by Application 2019 & 2032
- Table 43: Japan Pva For Polarizer Revenue (million) Forecast, by Application 2019 & 2032
- Table 44: South Korea Pva For Polarizer Revenue (million) Forecast, by Application 2019 & 2032
- Table 45: ASEAN Pva For Polarizer Revenue (million) Forecast, by Application 2019 & 2032
- Table 46: Oceania Pva For Polarizer Revenue (million) Forecast, by Application 2019 & 2032
- Table 47: Rest of Asia Pacific Pva For Polarizer Revenue (million) Forecast, by Application 2019 & 2032
Frequently Asked Questions
1. What is the projected Compound Annual Growth Rate (CAGR) of the Pva For Polarizer?
The projected CAGR is approximately 4.6%.
2. Which companies are prominent players in the Pva For Polarizer?
Key companies in the market include Kuraray, Mitsubishi Chemical.
3. What are the main segments of the Pva For Polarizer?
The market segments include Application, Type.
4. Can you provide details about the market size?
The market size is estimated to be USD 1627 million as of 2022.
5. What are some drivers contributing to market growth?
N/A
6. What are the notable trends driving market growth?
N/A
7. Are there any restraints impacting market growth?
N/A
8. Can you provide examples of recent developments in the market?
N/A
9. What pricing options are available for accessing the report?
Pricing options include single-user, multi-user, and enterprise licenses priced at USD 4250.00, USD 6375.00, and USD 8500.00 respectively.
10. Is the market size provided in terms of value or volume?
The market size is provided in terms of value, measured in million.
11. Are there any specific market keywords associated with the report?
Yes, the market keyword associated with the report is "Pva For Polarizer," which aids in identifying and referencing the specific market segment covered.
12. How do I determine which pricing option suits my needs best?
The pricing options vary based on user requirements and access needs. Individual users may opt for single-user licenses, while businesses requiring broader access may choose multi-user or enterprise licenses for cost-effective access to the report.
13. Are there any additional resources or data provided in the Pva For Polarizer report?
While the report offers comprehensive insights, it's advisable to review the specific contents or supplementary materials provided to ascertain if additional resources or data are available.
14. How can I stay updated on further developments or reports in the Pva For Polarizer?
To stay informed about further developments, trends, and reports in the Pva For Polarizer, consider subscribing to industry newsletters, following relevant companies and organizations, or regularly checking reputable industry news sources and publications.
Methodology
Step 1 - Identification of Relevant Samples Size from Population Database


Step 2 - Approaches for Defining Global Market Size (Value, Volume* & Price*)

Note*: In applicable scenarios
Step 3 - Data Sources
Primary Research
- Web Analytics
- Survey Reports
- Research Institute
- Latest Research Reports
- Opinion Leaders
Secondary Research
- Annual Reports
- White Paper
- Latest Press Release
- Industry Association
- Paid Database
- Investor Presentations

Step 4 - Data Triangulation
Involves using different sources of information in order to increase the validity of a study
These sources are likely to be stakeholders in a program - participants, other researchers, program staff, other community members, and so on.
Then we put all data in single framework & apply various statistical tools to find out the dynamic on the market.
During the analysis stage, feedback from the stakeholder groups would be compared to determine areas of agreement as well as areas of divergence
