

Key Insights
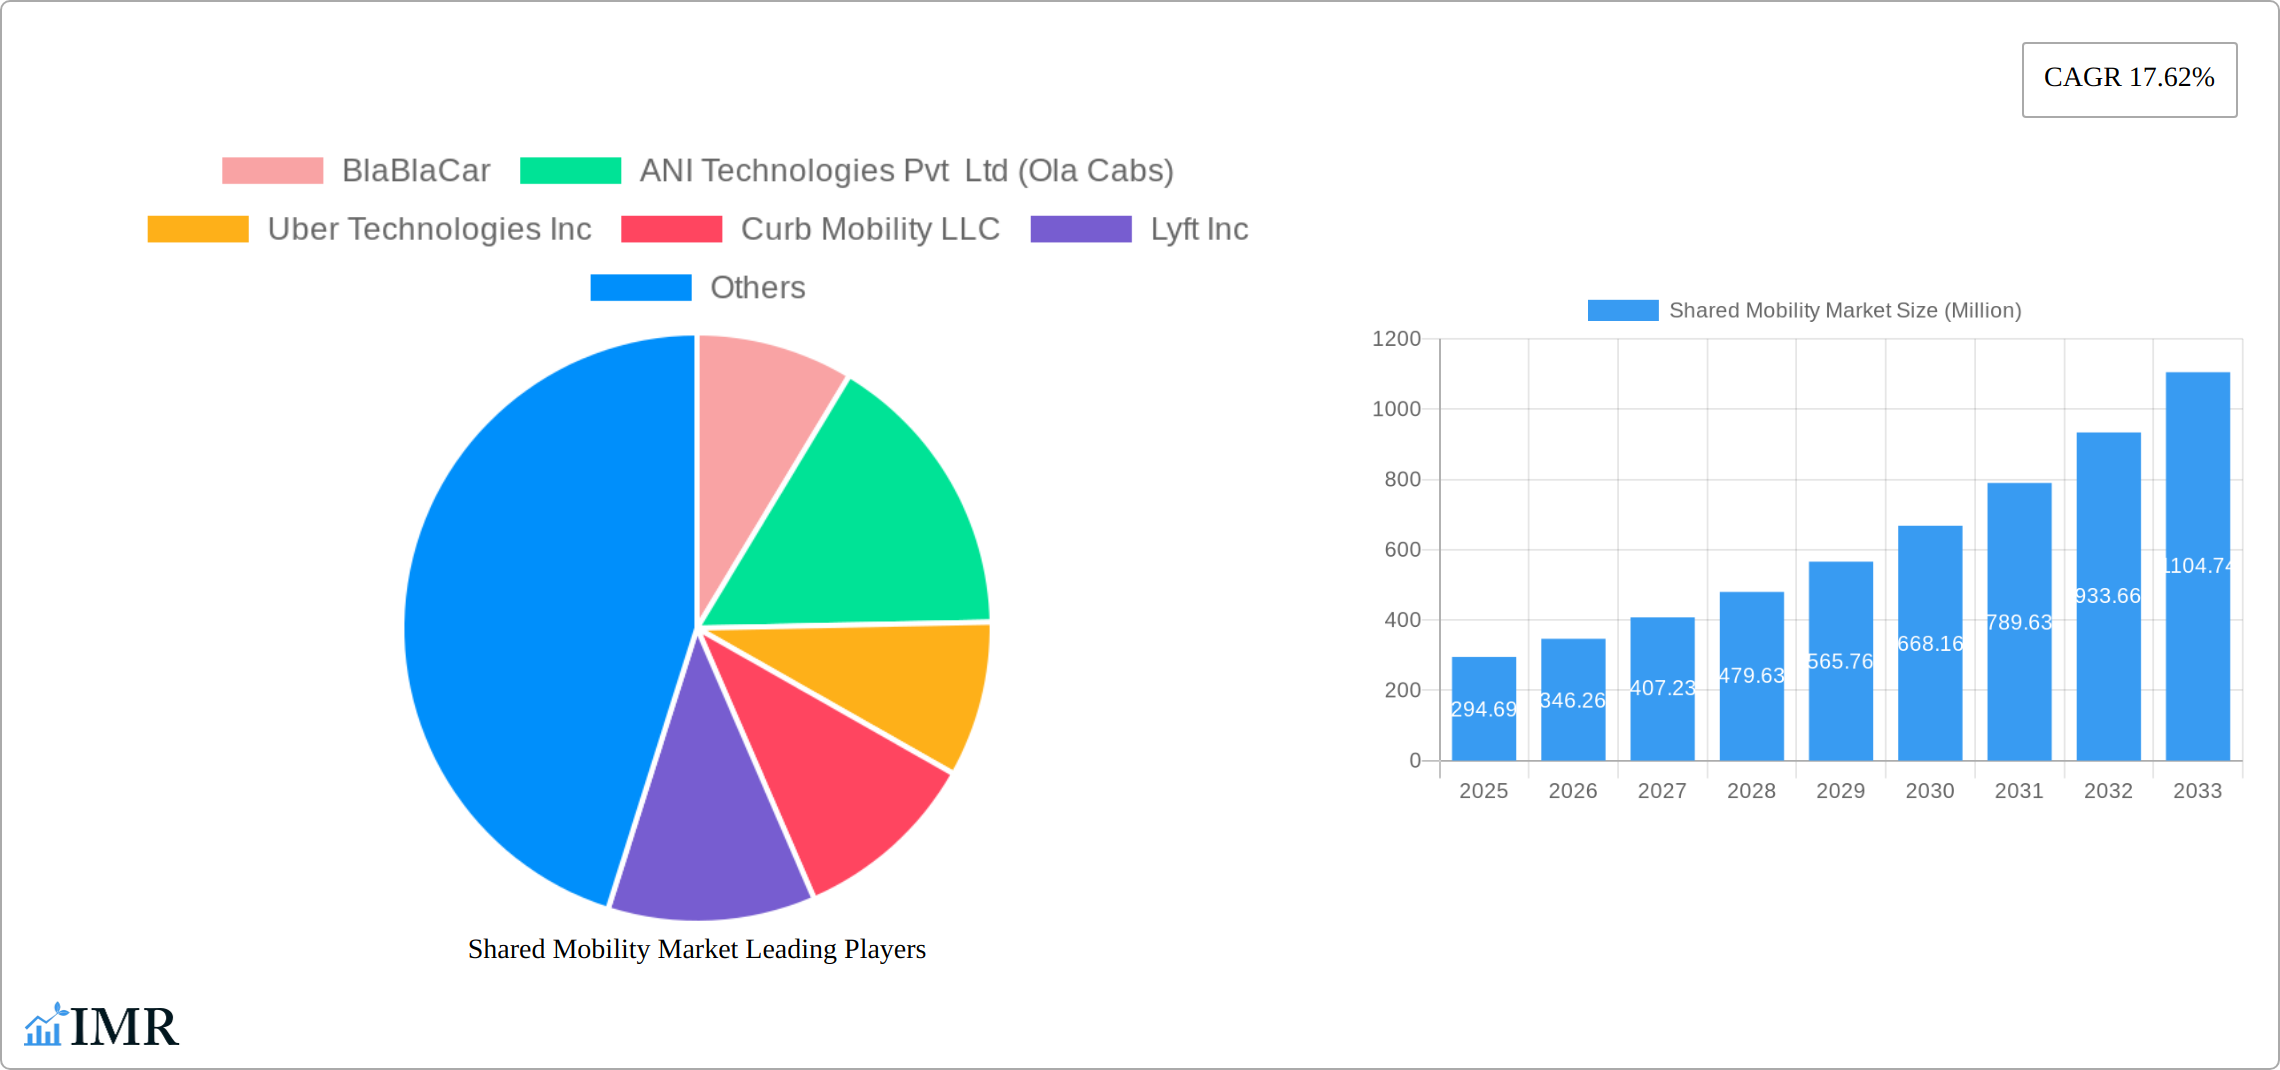
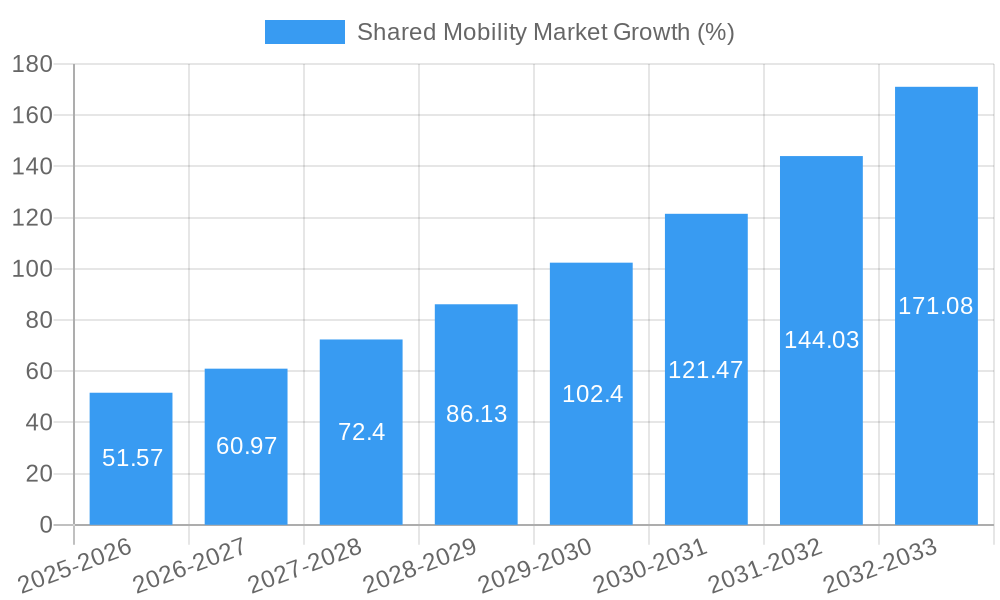
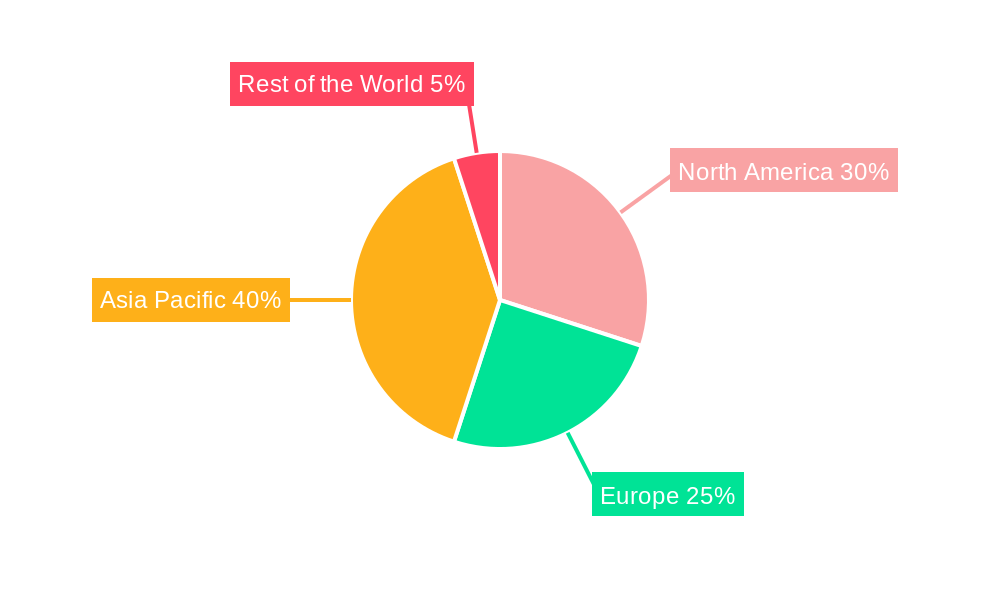
The global shared mobility market, valued at $294.69 million in 2025, is projected to experience robust growth, driven by increasing urbanization, rising environmental concerns, and the growing preference for convenient and cost-effective transportation solutions. The market's Compound Annual Growth Rate (CAGR) of 17.62% from 2025 to 2033 indicates significant expansion across various segments. Key drivers include the rising adoption of ride-hailing services, the expanding electric vehicle (EV) infrastructure supporting shared micromobility options like e-bikes and e-scooters, and the increasing popularity of car-sharing platforms. Furthermore, the shift towards sustainable transportation choices, coupled with technological advancements like improved app-based booking systems and autonomous driving technologies, are expected to further fuel market growth. While regulatory hurdles and concerns about data privacy present some restraints, the overall market outlook remains positive. The market is segmented by type (ride-hailing, car-sharing, micromobility, rental/leasing, others), vehicle type (passenger cars, light commercial vehicles, buses, two-wheelers), business model (P2P, B2B, B2C), and propulsion type (ICE, electric). The Asia-Pacific region, particularly China and India, is anticipated to dominate the market due to rapid urbanization and increasing smartphone penetration. North America and Europe are also expected to contribute significantly to market growth, driven by the adoption of innovative shared mobility solutions and supportive government policies. Competition is fierce, with established players like Uber, Ola, Didi, and Lyft vying for market share alongside emerging players focusing on specific niches or geographic areas. The market's future trajectory hinges on continued technological innovation, evolving consumer preferences, and effective regulatory frameworks.
The success of individual companies will depend on factors such as their ability to adapt to changing consumer demands, invest in technological advancements, and effectively manage operational costs. The market is ripe for further consolidation, with strategic partnerships and acquisitions likely to shape the competitive landscape. Companies are focusing on expanding their service offerings, improving user experience through personalized recommendations and loyalty programs, and exploring new business models such as subscription-based services. The integration of artificial intelligence and machine learning will further enhance efficiency, optimize pricing strategies, and improve safety features. Ultimately, the shared mobility market is poised for substantial growth, presenting significant opportunities for existing players and new entrants alike, with technological advancements and changing urban landscapes acting as key catalysts for further expansion.
Shared Mobility Market Report: 2019-2033
This comprehensive report provides a detailed analysis of the Shared Mobility Market, encompassing its current state, future projections, and key players. With a study period spanning 2019-2033, a base year of 2025, and a forecast period of 2025-2033, this report offers invaluable insights for investors, industry professionals, and strategic decision-makers. The market is segmented by type, vehicle type, business model, and propulsion type, offering a granular view of this rapidly evolving sector. The report analyzes the parent market of transportation and logistics and the child market of on-demand transportation services, providing a complete understanding of market dynamics and opportunities. The total market size in 2025 is estimated at xx Million units.
Shared Mobility Market Dynamics & Structure
The shared mobility market is characterized by intense competition, rapid technological advancements, and evolving regulatory landscapes. Market concentration is moderate, with a few dominant players like Uber and Didi controlling significant market share, while numerous regional and niche players compete for smaller segments. The market exhibits a dynamic interplay between established players and disruptive startups, leading to frequent mergers and acquisitions (M&A). In 2024, the M&A activity in this space reached xx deals, totaling xx Million units in value.
- Technological Innovation: Autonomous driving, connected vehicle technologies, and the integration of shared mobility platforms with other transportation modes are key innovation drivers. However, challenges such as ensuring data security and the cost of developing and deploying autonomous vehicles present barriers to entry.
- Regulatory Frameworks: Differing regulations across jurisdictions significantly impact market access and operating costs. Consistent and predictable regulations are crucial for encouraging investment and innovation.
- Competitive Product Substitutes: Private car ownership, public transportation, and ride-sharing services act as primary substitutes, impacting the market share of shared mobility services.
- End-User Demographics: Millennials and Gen Z are the primary adopters of shared mobility services, favoring convenience and cost-effectiveness. However, expanding adoption among older demographics is crucial for long-term growth.
- M&A Trends: Strategic acquisitions and mergers, like the CarDekho-Revv deal, are reshaping the market landscape, driving consolidation and enhancing technological capabilities.
Shared Mobility Market Growth Trends & Insights
The shared mobility market has witnessed significant growth over the past few years, driven by urbanization, rising disposable incomes, and increasing awareness of environmental concerns. The market size experienced a CAGR of xx% between 2019 and 2024, reaching xx Million units in 2024. The adoption rate of shared mobility services has increased significantly, particularly in urban areas, with an estimated xx% penetration rate in major cities by 2025. This growth is primarily driven by the convenience and cost-effectiveness of shared mobility solutions. Technological disruptions, such as the introduction of electric vehicles and autonomous driving technology, are further accelerating market expansion. Consumer behavior shifts, including a growing preference for sustainable and on-demand transportation solutions, significantly contribute to this trend. It is anticipated that the market will reach xx Million units by 2033, with a projected CAGR of xx% during the forecast period.
Dominant Regions, Countries, or Segments in Shared Mobility Market
The shared mobility market shows diverse growth across regions and segments. Ride-hailing currently holds the largest market share (xx%), followed by car sharing (xx%) and shared micromobility (xx%).
- By Type: Ride-hailing dominates, driven by high demand in urban centers. Car sharing is experiencing steady growth, particularly in densely populated areas with limited parking space. Shared micromobility is expanding rapidly, fueled by the popularity of e-scooters and e-bikes. Rental and leasing services cater to a different segment, providing long-term solutions.
- By Vehicle Type: Passenger cars represent the largest segment (xx%), followed by two-wheelers (xx%). Light commercial vehicles are gaining traction due to the growth of delivery services. Buses and coaches are less dominant, primarily serving specific transit needs.
- By Business Model: B2C dominates (xx%), catering to individual users. B2B is growing steadily, with corporates opting for fleet solutions. P2P services remain a niche segment, yet potentially impactful in specific contexts.
- By Propulsion Type: ICE vehicles currently dominate (xx%), but electric vehicles are witnessing substantial growth, driven by environmental regulations and technological advancements. The shift towards electric vehicles is expected to accelerate in the coming years.
- Dominant Regions: North America and Asia-Pacific are currently leading the market, driven by high adoption rates and technological innovation. Europe is also a significant market, with a focus on sustainable mobility solutions.
Shared Mobility Market Product Landscape
The shared mobility market encompasses a wide range of products and services, including ride-hailing apps, car-sharing platforms, e-scooter and e-bike rental services, and other shared transportation options. Key product innovations focus on user experience, such as improved booking systems, real-time tracking, and personalized recommendations. Technological advancements such as in-app payment systems and integrated mapping services enhance user convenience. Unique selling propositions vary, with some focusing on cost-effectiveness, while others emphasize convenience or sustainability.
Key Drivers, Barriers & Challenges in Shared Mobility Market
Key Drivers:
- Increasing urbanization and population density: Driving the demand for efficient transportation solutions.
- Rising disposable incomes: Enabling greater affordability of shared mobility services.
- Technological advancements: Such as autonomous driving and electric vehicles, enhancing efficiency and sustainability.
- Government initiatives promoting sustainable transportation: Including subsidies and tax incentives for shared mobility operators.
Key Challenges:
- Regulatory hurdles: Varying regulations across different regions create operational complexities.
- Competition: The market is highly competitive, with many players vying for market share.
- Safety concerns: Related to accidents involving shared mobility vehicles and data privacy issues.
- Infrastructure limitations: Inadequate charging infrastructure for electric vehicles remains a significant challenge. The estimated impact on market growth is predicted to be a reduction of xx% by 2030.
Emerging Opportunities in Shared Mobility Market
- Expansion into underserved markets: Including rural areas and developing countries with limited public transportation options.
- Integration with other modes of transportation: Creating seamless multimodal journeys.
- Development of innovative business models: Such as subscription services and dynamic pricing.
- Focus on sustainability: By incorporating electric vehicles and promoting environmentally friendly practices.
Growth Accelerators in the Shared Mobility Market Industry
The shared mobility market's long-term growth is driven by continuous technological innovation, strategic partnerships, and market expansion strategies. The development of autonomous vehicles has the potential to revolutionize the industry, improving efficiency and reducing costs. Strategic alliances between shared mobility providers and other companies, such as automotive manufacturers and technology firms, create synergy and expand market reach. Expanding into new geographic markets, particularly in developing countries, presents significant growth opportunities.
Key Players Shaping the Shared Mobility Market Market
- BlaBlaCar
- ANI Technologies Pvt Ltd (Ola Cabs)
- Uber Technologies Inc
- Curb Mobility LLC
- Lyft Inc
- Beijing Didi Chuxing Technology Co Ltd
- Cabify
- Zoomcar Holdings
- Revv
- Drive Now (BMW AG)
- Wingz Inc
- Europcar Mobility Group
- Hertz Global Holdings
- Avis Budget Group Inc
- Grab Holdings Inc
Notable Milestones in Shared Mobility Market Sector
- December 2023: CarDekho's merger with Revv signifies a major shift in India's shared car rental market.
- July 2023: Bolt's impressive growth in the UK and globally demonstrates the expanding reach of ride-hailing platforms.
- July 2023: inDrive's expansion into the US and Nigeria highlights the increasing global demand for shared mobility services.
In-Depth Shared Mobility Market Market Outlook
The shared mobility market exhibits immense future potential, driven by technological advancements, evolving consumer preferences, and supportive government policies. Strategic opportunities lie in expanding into new markets, developing innovative service offerings, and strengthening partnerships. The integration of artificial intelligence, big data analytics, and blockchain technology will enhance operational efficiency, personalization, and security. Sustainable mobility solutions will play a crucial role, driving the adoption of electric vehicles and promoting environmentally friendly practices. The market's future growth trajectory is expected to be robust, fueled by these key factors.
Shared Mobility Market Segmentation
-
1. Type
- 1.1. Ride-Hailing
- 1.2. Car Sharing
- 1.3. Shared Micromobility (E-Bikes, E-Scooters, etc.)
- 1.4. Rental and Leasing
- 1.5. Others (Shuttle Services, Bus Services, etc.)
-
2. Vehicle Type
- 2.1. Passenger Cars
- 2.2. Light Commercial Vehicles (Pickup Vans, etc.)
- 2.3. Buses and Coaches
- 2.4. Two-Wheelers
-
3. Business Model
- 3.1. Peer-to-Peer (P2P)
- 3.2. Business-to-Business (B2B)
- 3.3. Business-to-Consumer (B2C)
-
4. Propulsion Type
- 4.1. Internal Combustion Engine (ICE)
- 4.2. Electric
Shared Mobility Market Segmentation By Geography
-
1. North America
- 1.1. United States
- 1.2. Canada
- 1.3. Rest of North America
-
2. Europe
- 2.1. Germany
- 2.2. United Kingdom
- 2.3. France
- 2.4. Italy
- 2.5. Rest of Europe
-
3. Asia Pacific
- 3.1. China
- 3.2. India
- 3.3. Japan
- 3.4. South Korea
- 3.5. Rest of Asia Pacific
-
4. Rest of the World
- 4.1. South America
- 4.2. Middle East and Africa
Shared Mobility Market REPORT HIGHLIGHTS
| Aspects | Details |
|---|---|
| Study Period | 2019-2033 |
| Base Year | 2024 |
| Estimated Year | 2025 |
| Forecast Period | 2025-2033 |
| Historical Period | 2019-2024 |
| Growth Rate | CAGR of 17.62% from 2019-2033 |
| Segmentation |
|
Table of Contents
- 1. Introduction
- 1.1. Research Scope
- 1.2. Market Segmentation
- 1.3. Research Methodology
- 1.4. Definitions and Assumptions
- 2. Executive Summary
- 2.1. Introduction
- 3. Market Dynamics
- 3.1. Introduction
- 3.2. Market Drivers
- 3.2.1. Increasing Preference of Consumers toward Ride-Hailing Services is Expected to Foster the Growth of the Market
- 3.3. Market Restrains
- 3.3.1. Strict Government Regulations to Govern the Shared Mobility Industry Hampers the Growth of the Market
- 3.4. Market Trends
- 3.4.1. The Passengers Cars Segment is Expected to Gain Traction Between 2024 and 2029
- 4. Market Factor Analysis
- 4.1. Porters Five Forces
- 4.2. Supply/Value Chain
- 4.3. PESTEL analysis
- 4.4. Market Entropy
- 4.5. Patent/Trademark Analysis
- 5. Global Shared Mobility Market Analysis, Insights and Forecast, 2019-2031
- 5.1. Market Analysis, Insights and Forecast - by Type
- 5.1.1. Ride-Hailing
- 5.1.2. Car Sharing
- 5.1.3. Shared Micromobility (E-Bikes, E-Scooters, etc.)
- 5.1.4. Rental and Leasing
- 5.1.5. Others (Shuttle Services, Bus Services, etc.)
- 5.2. Market Analysis, Insights and Forecast - by Vehicle Type
- 5.2.1. Passenger Cars
- 5.2.2. Light Commercial Vehicles (Pickup Vans, etc.)
- 5.2.3. Buses and Coaches
- 5.2.4. Two-Wheelers
- 5.3. Market Analysis, Insights and Forecast - by Business Model
- 5.3.1. Peer-to-Peer (P2P)
- 5.3.2. Business-to-Business (B2B)
- 5.3.3. Business-to-Consumer (B2C)
- 5.4. Market Analysis, Insights and Forecast - by Propulsion Type
- 5.4.1. Internal Combustion Engine (ICE)
- 5.4.2. Electric
- 5.5. Market Analysis, Insights and Forecast - by Region
- 5.5.1. North America
- 5.5.2. Europe
- 5.5.3. Asia Pacific
- 5.5.4. Rest of the World
- 5.1. Market Analysis, Insights and Forecast - by Type
- 6. North America Shared Mobility Market Analysis, Insights and Forecast, 2019-2031
- 6.1. Market Analysis, Insights and Forecast - by Type
- 6.1.1. Ride-Hailing
- 6.1.2. Car Sharing
- 6.1.3. Shared Micromobility (E-Bikes, E-Scooters, etc.)
- 6.1.4. Rental and Leasing
- 6.1.5. Others (Shuttle Services, Bus Services, etc.)
- 6.2. Market Analysis, Insights and Forecast - by Vehicle Type
- 6.2.1. Passenger Cars
- 6.2.2. Light Commercial Vehicles (Pickup Vans, etc.)
- 6.2.3. Buses and Coaches
- 6.2.4. Two-Wheelers
- 6.3. Market Analysis, Insights and Forecast - by Business Model
- 6.3.1. Peer-to-Peer (P2P)
- 6.3.2. Business-to-Business (B2B)
- 6.3.3. Business-to-Consumer (B2C)
- 6.4. Market Analysis, Insights and Forecast - by Propulsion Type
- 6.4.1. Internal Combustion Engine (ICE)
- 6.4.2. Electric
- 6.1. Market Analysis, Insights and Forecast - by Type
- 7. Europe Shared Mobility Market Analysis, Insights and Forecast, 2019-2031
- 7.1. Market Analysis, Insights and Forecast - by Type
- 7.1.1. Ride-Hailing
- 7.1.2. Car Sharing
- 7.1.3. Shared Micromobility (E-Bikes, E-Scooters, etc.)
- 7.1.4. Rental and Leasing
- 7.1.5. Others (Shuttle Services, Bus Services, etc.)
- 7.2. Market Analysis, Insights and Forecast - by Vehicle Type
- 7.2.1. Passenger Cars
- 7.2.2. Light Commercial Vehicles (Pickup Vans, etc.)
- 7.2.3. Buses and Coaches
- 7.2.4. Two-Wheelers
- 7.3. Market Analysis, Insights and Forecast - by Business Model
- 7.3.1. Peer-to-Peer (P2P)
- 7.3.2. Business-to-Business (B2B)
- 7.3.3. Business-to-Consumer (B2C)
- 7.4. Market Analysis, Insights and Forecast - by Propulsion Type
- 7.4.1. Internal Combustion Engine (ICE)
- 7.4.2. Electric
- 7.1. Market Analysis, Insights and Forecast - by Type
- 8. Asia Pacific Shared Mobility Market Analysis, Insights and Forecast, 2019-2031
- 8.1. Market Analysis, Insights and Forecast - by Type
- 8.1.1. Ride-Hailing
- 8.1.2. Car Sharing
- 8.1.3. Shared Micromobility (E-Bikes, E-Scooters, etc.)
- 8.1.4. Rental and Leasing
- 8.1.5. Others (Shuttle Services, Bus Services, etc.)
- 8.2. Market Analysis, Insights and Forecast - by Vehicle Type
- 8.2.1. Passenger Cars
- 8.2.2. Light Commercial Vehicles (Pickup Vans, etc.)
- 8.2.3. Buses and Coaches
- 8.2.4. Two-Wheelers
- 8.3. Market Analysis, Insights and Forecast - by Business Model
- 8.3.1. Peer-to-Peer (P2P)
- 8.3.2. Business-to-Business (B2B)
- 8.3.3. Business-to-Consumer (B2C)
- 8.4. Market Analysis, Insights and Forecast - by Propulsion Type
- 8.4.1. Internal Combustion Engine (ICE)
- 8.4.2. Electric
- 8.1. Market Analysis, Insights and Forecast - by Type
- 9. Rest of the World Shared Mobility Market Analysis, Insights and Forecast, 2019-2031
- 9.1. Market Analysis, Insights and Forecast - by Type
- 9.1.1. Ride-Hailing
- 9.1.2. Car Sharing
- 9.1.3. Shared Micromobility (E-Bikes, E-Scooters, etc.)
- 9.1.4. Rental and Leasing
- 9.1.5. Others (Shuttle Services, Bus Services, etc.)
- 9.2. Market Analysis, Insights and Forecast - by Vehicle Type
- 9.2.1. Passenger Cars
- 9.2.2. Light Commercial Vehicles (Pickup Vans, etc.)
- 9.2.3. Buses and Coaches
- 9.2.4. Two-Wheelers
- 9.3. Market Analysis, Insights and Forecast - by Business Model
- 9.3.1. Peer-to-Peer (P2P)
- 9.3.2. Business-to-Business (B2B)
- 9.3.3. Business-to-Consumer (B2C)
- 9.4. Market Analysis, Insights and Forecast - by Propulsion Type
- 9.4.1. Internal Combustion Engine (ICE)
- 9.4.2. Electric
- 9.1. Market Analysis, Insights and Forecast - by Type
- 10. North America Shared Mobility Market Analysis, Insights and Forecast, 2019-2031
- 10.1. Market Analysis, Insights and Forecast - By Country/Sub-region
- 10.1.1 United States
- 10.1.2 Canada
- 10.1.3 Rest of North America
- 11. Europe Shared Mobility Market Analysis, Insights and Forecast, 2019-2031
- 11.1. Market Analysis, Insights and Forecast - By Country/Sub-region
- 11.1.1 Germany
- 11.1.2 United Kingdom
- 11.1.3 France
- 11.1.4 Italy
- 11.1.5 Rest of Europe
- 12. Asia Pacific Shared Mobility Market Analysis, Insights and Forecast, 2019-2031
- 12.1. Market Analysis, Insights and Forecast - By Country/Sub-region
- 12.1.1 China
- 12.1.2 India
- 12.1.3 Japan
- 12.1.4 South Korea
- 12.1.5 Rest of Asia Pacific
- 13. Rest of the World Shared Mobility Market Analysis, Insights and Forecast, 2019-2031
- 13.1. Market Analysis, Insights and Forecast - By Country/Sub-region
- 13.1.1 South America
- 13.1.2 Middle East and Africa
- 14. Competitive Analysis
- 14.1. Global Market Share Analysis 2024
- 14.2. Company Profiles
- 14.2.1 BlaBlaCar
- 14.2.1.1. Overview
- 14.2.1.2. Products
- 14.2.1.3. SWOT Analysis
- 14.2.1.4. Recent Developments
- 14.2.1.5. Financials (Based on Availability)
- 14.2.2 ANI Technologies Pvt Ltd (Ola Cabs)
- 14.2.2.1. Overview
- 14.2.2.2. Products
- 14.2.2.3. SWOT Analysis
- 14.2.2.4. Recent Developments
- 14.2.2.5. Financials (Based on Availability)
- 14.2.3 Uber Technologies Inc
- 14.2.3.1. Overview
- 14.2.3.2. Products
- 14.2.3.3. SWOT Analysis
- 14.2.3.4. Recent Developments
- 14.2.3.5. Financials (Based on Availability)
- 14.2.4 Curb Mobility LLC
- 14.2.4.1. Overview
- 14.2.4.2. Products
- 14.2.4.3. SWOT Analysis
- 14.2.4.4. Recent Developments
- 14.2.4.5. Financials (Based on Availability)
- 14.2.5 Lyft Inc
- 14.2.5.1. Overview
- 14.2.5.2. Products
- 14.2.5.3. SWOT Analysis
- 14.2.5.4. Recent Developments
- 14.2.5.5. Financials (Based on Availability)
- 14.2.6 Beijing Didi Chuxing Technology Co Ltd
- 14.2.6.1. Overview
- 14.2.6.2. Products
- 14.2.6.3. SWOT Analysis
- 14.2.6.4. Recent Developments
- 14.2.6.5. Financials (Based on Availability)
- 14.2.7 Cabify
- 14.2.7.1. Overview
- 14.2.7.2. Products
- 14.2.7.3. SWOT Analysis
- 14.2.7.4. Recent Developments
- 14.2.7.5. Financials (Based on Availability)
- 14.2.8 Zoomcar Holdings
- 14.2.8.1. Overview
- 14.2.8.2. Products
- 14.2.8.3. SWOT Analysis
- 14.2.8.4. Recent Developments
- 14.2.8.5. Financials (Based on Availability)
- 14.2.9 Revv
- 14.2.9.1. Overview
- 14.2.9.2. Products
- 14.2.9.3. SWOT Analysis
- 14.2.9.4. Recent Developments
- 14.2.9.5. Financials (Based on Availability)
- 14.2.10 Drive Now (BMW AG)
- 14.2.10.1. Overview
- 14.2.10.2. Products
- 14.2.10.3. SWOT Analysis
- 14.2.10.4. Recent Developments
- 14.2.10.5. Financials (Based on Availability)
- 14.2.11 Wingz Inc
- 14.2.11.1. Overview
- 14.2.11.2. Products
- 14.2.11.3. SWOT Analysis
- 14.2.11.4. Recent Developments
- 14.2.11.5. Financials (Based on Availability)
- 14.2.12 Europcar Mobility Group
- 14.2.12.1. Overview
- 14.2.12.2. Products
- 14.2.12.3. SWOT Analysis
- 14.2.12.4. Recent Developments
- 14.2.12.5. Financials (Based on Availability)
- 14.2.13 Hertz Global Holdings
- 14.2.13.1. Overview
- 14.2.13.2. Products
- 14.2.13.3. SWOT Analysis
- 14.2.13.4. Recent Developments
- 14.2.13.5. Financials (Based on Availability)
- 14.2.14 Avis Budget Group Inc
- 14.2.14.1. Overview
- 14.2.14.2. Products
- 14.2.14.3. SWOT Analysis
- 14.2.14.4. Recent Developments
- 14.2.14.5. Financials (Based on Availability)
- 14.2.15 Grab Holdings Inc
- 14.2.15.1. Overview
- 14.2.15.2. Products
- 14.2.15.3. SWOT Analysis
- 14.2.15.4. Recent Developments
- 14.2.15.5. Financials (Based on Availability)
- 14.2.1 BlaBlaCar
List of Figures
- Figure 1: Global Shared Mobility Market Revenue Breakdown (Million, %) by Region 2024 & 2032
- Figure 2: North America Shared Mobility Market Revenue (Million), by Country 2024 & 2032
- Figure 3: North America Shared Mobility Market Revenue Share (%), by Country 2024 & 2032
- Figure 4: Europe Shared Mobility Market Revenue (Million), by Country 2024 & 2032
- Figure 5: Europe Shared Mobility Market Revenue Share (%), by Country 2024 & 2032
- Figure 6: Asia Pacific Shared Mobility Market Revenue (Million), by Country 2024 & 2032
- Figure 7: Asia Pacific Shared Mobility Market Revenue Share (%), by Country 2024 & 2032
- Figure 8: Rest of the World Shared Mobility Market Revenue (Million), by Country 2024 & 2032
- Figure 9: Rest of the World Shared Mobility Market Revenue Share (%), by Country 2024 & 2032
- Figure 10: North America Shared Mobility Market Revenue (Million), by Type 2024 & 2032
- Figure 11: North America Shared Mobility Market Revenue Share (%), by Type 2024 & 2032
- Figure 12: North America Shared Mobility Market Revenue (Million), by Vehicle Type 2024 & 2032
- Figure 13: North America Shared Mobility Market Revenue Share (%), by Vehicle Type 2024 & 2032
- Figure 14: North America Shared Mobility Market Revenue (Million), by Business Model 2024 & 2032
- Figure 15: North America Shared Mobility Market Revenue Share (%), by Business Model 2024 & 2032
- Figure 16: North America Shared Mobility Market Revenue (Million), by Propulsion Type 2024 & 2032
- Figure 17: North America Shared Mobility Market Revenue Share (%), by Propulsion Type 2024 & 2032
- Figure 18: North America Shared Mobility Market Revenue (Million), by Country 2024 & 2032
- Figure 19: North America Shared Mobility Market Revenue Share (%), by Country 2024 & 2032
- Figure 20: Europe Shared Mobility Market Revenue (Million), by Type 2024 & 2032
- Figure 21: Europe Shared Mobility Market Revenue Share (%), by Type 2024 & 2032
- Figure 22: Europe Shared Mobility Market Revenue (Million), by Vehicle Type 2024 & 2032
- Figure 23: Europe Shared Mobility Market Revenue Share (%), by Vehicle Type 2024 & 2032
- Figure 24: Europe Shared Mobility Market Revenue (Million), by Business Model 2024 & 2032
- Figure 25: Europe Shared Mobility Market Revenue Share (%), by Business Model 2024 & 2032
- Figure 26: Europe Shared Mobility Market Revenue (Million), by Propulsion Type 2024 & 2032
- Figure 27: Europe Shared Mobility Market Revenue Share (%), by Propulsion Type 2024 & 2032
- Figure 28: Europe Shared Mobility Market Revenue (Million), by Country 2024 & 2032
- Figure 29: Europe Shared Mobility Market Revenue Share (%), by Country 2024 & 2032
- Figure 30: Asia Pacific Shared Mobility Market Revenue (Million), by Type 2024 & 2032
- Figure 31: Asia Pacific Shared Mobility Market Revenue Share (%), by Type 2024 & 2032
- Figure 32: Asia Pacific Shared Mobility Market Revenue (Million), by Vehicle Type 2024 & 2032
- Figure 33: Asia Pacific Shared Mobility Market Revenue Share (%), by Vehicle Type 2024 & 2032
- Figure 34: Asia Pacific Shared Mobility Market Revenue (Million), by Business Model 2024 & 2032
- Figure 35: Asia Pacific Shared Mobility Market Revenue Share (%), by Business Model 2024 & 2032
- Figure 36: Asia Pacific Shared Mobility Market Revenue (Million), by Propulsion Type 2024 & 2032
- Figure 37: Asia Pacific Shared Mobility Market Revenue Share (%), by Propulsion Type 2024 & 2032
- Figure 38: Asia Pacific Shared Mobility Market Revenue (Million), by Country 2024 & 2032
- Figure 39: Asia Pacific Shared Mobility Market Revenue Share (%), by Country 2024 & 2032
- Figure 40: Rest of the World Shared Mobility Market Revenue (Million), by Type 2024 & 2032
- Figure 41: Rest of the World Shared Mobility Market Revenue Share (%), by Type 2024 & 2032
- Figure 42: Rest of the World Shared Mobility Market Revenue (Million), by Vehicle Type 2024 & 2032
- Figure 43: Rest of the World Shared Mobility Market Revenue Share (%), by Vehicle Type 2024 & 2032
- Figure 44: Rest of the World Shared Mobility Market Revenue (Million), by Business Model 2024 & 2032
- Figure 45: Rest of the World Shared Mobility Market Revenue Share (%), by Business Model 2024 & 2032
- Figure 46: Rest of the World Shared Mobility Market Revenue (Million), by Propulsion Type 2024 & 2032
- Figure 47: Rest of the World Shared Mobility Market Revenue Share (%), by Propulsion Type 2024 & 2032
- Figure 48: Rest of the World Shared Mobility Market Revenue (Million), by Country 2024 & 2032
- Figure 49: Rest of the World Shared Mobility Market Revenue Share (%), by Country 2024 & 2032
List of Tables
- Table 1: Global Shared Mobility Market Revenue Million Forecast, by Region 2019 & 2032
- Table 2: Global Shared Mobility Market Revenue Million Forecast, by Type 2019 & 2032
- Table 3: Global Shared Mobility Market Revenue Million Forecast, by Vehicle Type 2019 & 2032
- Table 4: Global Shared Mobility Market Revenue Million Forecast, by Business Model 2019 & 2032
- Table 5: Global Shared Mobility Market Revenue Million Forecast, by Propulsion Type 2019 & 2032
- Table 6: Global Shared Mobility Market Revenue Million Forecast, by Region 2019 & 2032
- Table 7: Global Shared Mobility Market Revenue Million Forecast, by Country 2019 & 2032
- Table 8: United States Shared Mobility Market Revenue (Million) Forecast, by Application 2019 & 2032
- Table 9: Canada Shared Mobility Market Revenue (Million) Forecast, by Application 2019 & 2032
- Table 10: Rest of North America Shared Mobility Market Revenue (Million) Forecast, by Application 2019 & 2032
- Table 11: Global Shared Mobility Market Revenue Million Forecast, by Country 2019 & 2032
- Table 12: Germany Shared Mobility Market Revenue (Million) Forecast, by Application 2019 & 2032
- Table 13: United Kingdom Shared Mobility Market Revenue (Million) Forecast, by Application 2019 & 2032
- Table 14: France Shared Mobility Market Revenue (Million) Forecast, by Application 2019 & 2032
- Table 15: Italy Shared Mobility Market Revenue (Million) Forecast, by Application 2019 & 2032
- Table 16: Rest of Europe Shared Mobility Market Revenue (Million) Forecast, by Application 2019 & 2032
- Table 17: Global Shared Mobility Market Revenue Million Forecast, by Country 2019 & 2032
- Table 18: China Shared Mobility Market Revenue (Million) Forecast, by Application 2019 & 2032
- Table 19: India Shared Mobility Market Revenue (Million) Forecast, by Application 2019 & 2032
- Table 20: Japan Shared Mobility Market Revenue (Million) Forecast, by Application 2019 & 2032
- Table 21: South Korea Shared Mobility Market Revenue (Million) Forecast, by Application 2019 & 2032
- Table 22: Rest of Asia Pacific Shared Mobility Market Revenue (Million) Forecast, by Application 2019 & 2032
- Table 23: Global Shared Mobility Market Revenue Million Forecast, by Country 2019 & 2032
- Table 24: South America Shared Mobility Market Revenue (Million) Forecast, by Application 2019 & 2032
- Table 25: Middle East and Africa Shared Mobility Market Revenue (Million) Forecast, by Application 2019 & 2032
- Table 26: Global Shared Mobility Market Revenue Million Forecast, by Type 2019 & 2032
- Table 27: Global Shared Mobility Market Revenue Million Forecast, by Vehicle Type 2019 & 2032
- Table 28: Global Shared Mobility Market Revenue Million Forecast, by Business Model 2019 & 2032
- Table 29: Global Shared Mobility Market Revenue Million Forecast, by Propulsion Type 2019 & 2032
- Table 30: Global Shared Mobility Market Revenue Million Forecast, by Country 2019 & 2032
- Table 31: United States Shared Mobility Market Revenue (Million) Forecast, by Application 2019 & 2032
- Table 32: Canada Shared Mobility Market Revenue (Million) Forecast, by Application 2019 & 2032
- Table 33: Rest of North America Shared Mobility Market Revenue (Million) Forecast, by Application 2019 & 2032
- Table 34: Global Shared Mobility Market Revenue Million Forecast, by Type 2019 & 2032
- Table 35: Global Shared Mobility Market Revenue Million Forecast, by Vehicle Type 2019 & 2032
- Table 36: Global Shared Mobility Market Revenue Million Forecast, by Business Model 2019 & 2032
- Table 37: Global Shared Mobility Market Revenue Million Forecast, by Propulsion Type 2019 & 2032
- Table 38: Global Shared Mobility Market Revenue Million Forecast, by Country 2019 & 2032
- Table 39: Germany Shared Mobility Market Revenue (Million) Forecast, by Application 2019 & 2032
- Table 40: United Kingdom Shared Mobility Market Revenue (Million) Forecast, by Application 2019 & 2032
- Table 41: France Shared Mobility Market Revenue (Million) Forecast, by Application 2019 & 2032
- Table 42: Italy Shared Mobility Market Revenue (Million) Forecast, by Application 2019 & 2032
- Table 43: Rest of Europe Shared Mobility Market Revenue (Million) Forecast, by Application 2019 & 2032
- Table 44: Global Shared Mobility Market Revenue Million Forecast, by Type 2019 & 2032
- Table 45: Global Shared Mobility Market Revenue Million Forecast, by Vehicle Type 2019 & 2032
- Table 46: Global Shared Mobility Market Revenue Million Forecast, by Business Model 2019 & 2032
- Table 47: Global Shared Mobility Market Revenue Million Forecast, by Propulsion Type 2019 & 2032
- Table 48: Global Shared Mobility Market Revenue Million Forecast, by Country 2019 & 2032
- Table 49: China Shared Mobility Market Revenue (Million) Forecast, by Application 2019 & 2032
- Table 50: India Shared Mobility Market Revenue (Million) Forecast, by Application 2019 & 2032
- Table 51: Japan Shared Mobility Market Revenue (Million) Forecast, by Application 2019 & 2032
- Table 52: South Korea Shared Mobility Market Revenue (Million) Forecast, by Application 2019 & 2032
- Table 53: Rest of Asia Pacific Shared Mobility Market Revenue (Million) Forecast, by Application 2019 & 2032
- Table 54: Global Shared Mobility Market Revenue Million Forecast, by Type 2019 & 2032
- Table 55: Global Shared Mobility Market Revenue Million Forecast, by Vehicle Type 2019 & 2032
- Table 56: Global Shared Mobility Market Revenue Million Forecast, by Business Model 2019 & 2032
- Table 57: Global Shared Mobility Market Revenue Million Forecast, by Propulsion Type 2019 & 2032
- Table 58: Global Shared Mobility Market Revenue Million Forecast, by Country 2019 & 2032
- Table 59: South America Shared Mobility Market Revenue (Million) Forecast, by Application 2019 & 2032
- Table 60: Middle East and Africa Shared Mobility Market Revenue (Million) Forecast, by Application 2019 & 2032
Frequently Asked Questions
1. What is the projected Compound Annual Growth Rate (CAGR) of the Shared Mobility Market?
The projected CAGR is approximately 17.62%.
2. Which companies are prominent players in the Shared Mobility Market?
Key companies in the market include BlaBlaCar, ANI Technologies Pvt Ltd (Ola Cabs), Uber Technologies Inc, Curb Mobility LLC, Lyft Inc, Beijing Didi Chuxing Technology Co Ltd, Cabify, Zoomcar Holdings, Revv, Drive Now (BMW AG), Wingz Inc, Europcar Mobility Group, Hertz Global Holdings, Avis Budget Group Inc, Grab Holdings Inc.
3. What are the main segments of the Shared Mobility Market?
The market segments include Type, Vehicle Type, Business Model, Propulsion Type.
4. Can you provide details about the market size?
The market size is estimated to be USD 294.69 Million as of 2022.
5. What are some drivers contributing to market growth?
Increasing Preference of Consumers toward Ride-Hailing Services is Expected to Foster the Growth of the Market.
6. What are the notable trends driving market growth?
The Passengers Cars Segment is Expected to Gain Traction Between 2024 and 2029.
7. Are there any restraints impacting market growth?
Strict Government Regulations to Govern the Shared Mobility Industry Hampers the Growth of the Market.
8. Can you provide examples of recent developments in the market?
December 2023: CarDekho announced its merger with Revv, an Indian-based mobility service provider, to venture into India's shared car rental services business by combining the expertise of Car Dekho in technological integration and market understanding of Revv. These two companies aim to disrupt the car rental space in India by facilitating a tech-enabled mobility solution to enhance customers' convenience.
9. What pricing options are available for accessing the report?
Pricing options include single-user, multi-user, and enterprise licenses priced at USD 4750, USD 5250, and USD 8750 respectively.
10. Is the market size provided in terms of value or volume?
The market size is provided in terms of value, measured in Million.
11. Are there any specific market keywords associated with the report?
Yes, the market keyword associated with the report is "Shared Mobility Market," which aids in identifying and referencing the specific market segment covered.
12. How do I determine which pricing option suits my needs best?
The pricing options vary based on user requirements and access needs. Individual users may opt for single-user licenses, while businesses requiring broader access may choose multi-user or enterprise licenses for cost-effective access to the report.
13. Are there any additional resources or data provided in the Shared Mobility Market report?
While the report offers comprehensive insights, it's advisable to review the specific contents or supplementary materials provided to ascertain if additional resources or data are available.
14. How can I stay updated on further developments or reports in the Shared Mobility Market?
To stay informed about further developments, trends, and reports in the Shared Mobility Market, consider subscribing to industry newsletters, following relevant companies and organizations, or regularly checking reputable industry news sources and publications.
Methodology
Step 1 - Identification of Relevant Samples Size from Population Database


Step 2 - Approaches for Defining Global Market Size (Value, Volume* & Price*)

Note*: In applicable scenarios
Step 3 - Data Sources
Primary Research
- Web Analytics
- Survey Reports
- Research Institute
- Latest Research Reports
- Opinion Leaders
Secondary Research
- Annual Reports
- White Paper
- Latest Press Release
- Industry Association
- Paid Database
- Investor Presentations

Step 4 - Data Triangulation
Involves using different sources of information in order to increase the validity of a study
These sources are likely to be stakeholders in a program - participants, other researchers, program staff, other community members, and so on.
Then we put all data in single framework & apply various statistical tools to find out the dynamic on the market.
During the analysis stage, feedback from the stakeholder groups would be compared to determine areas of agreement as well as areas of divergence
