

Key Insights
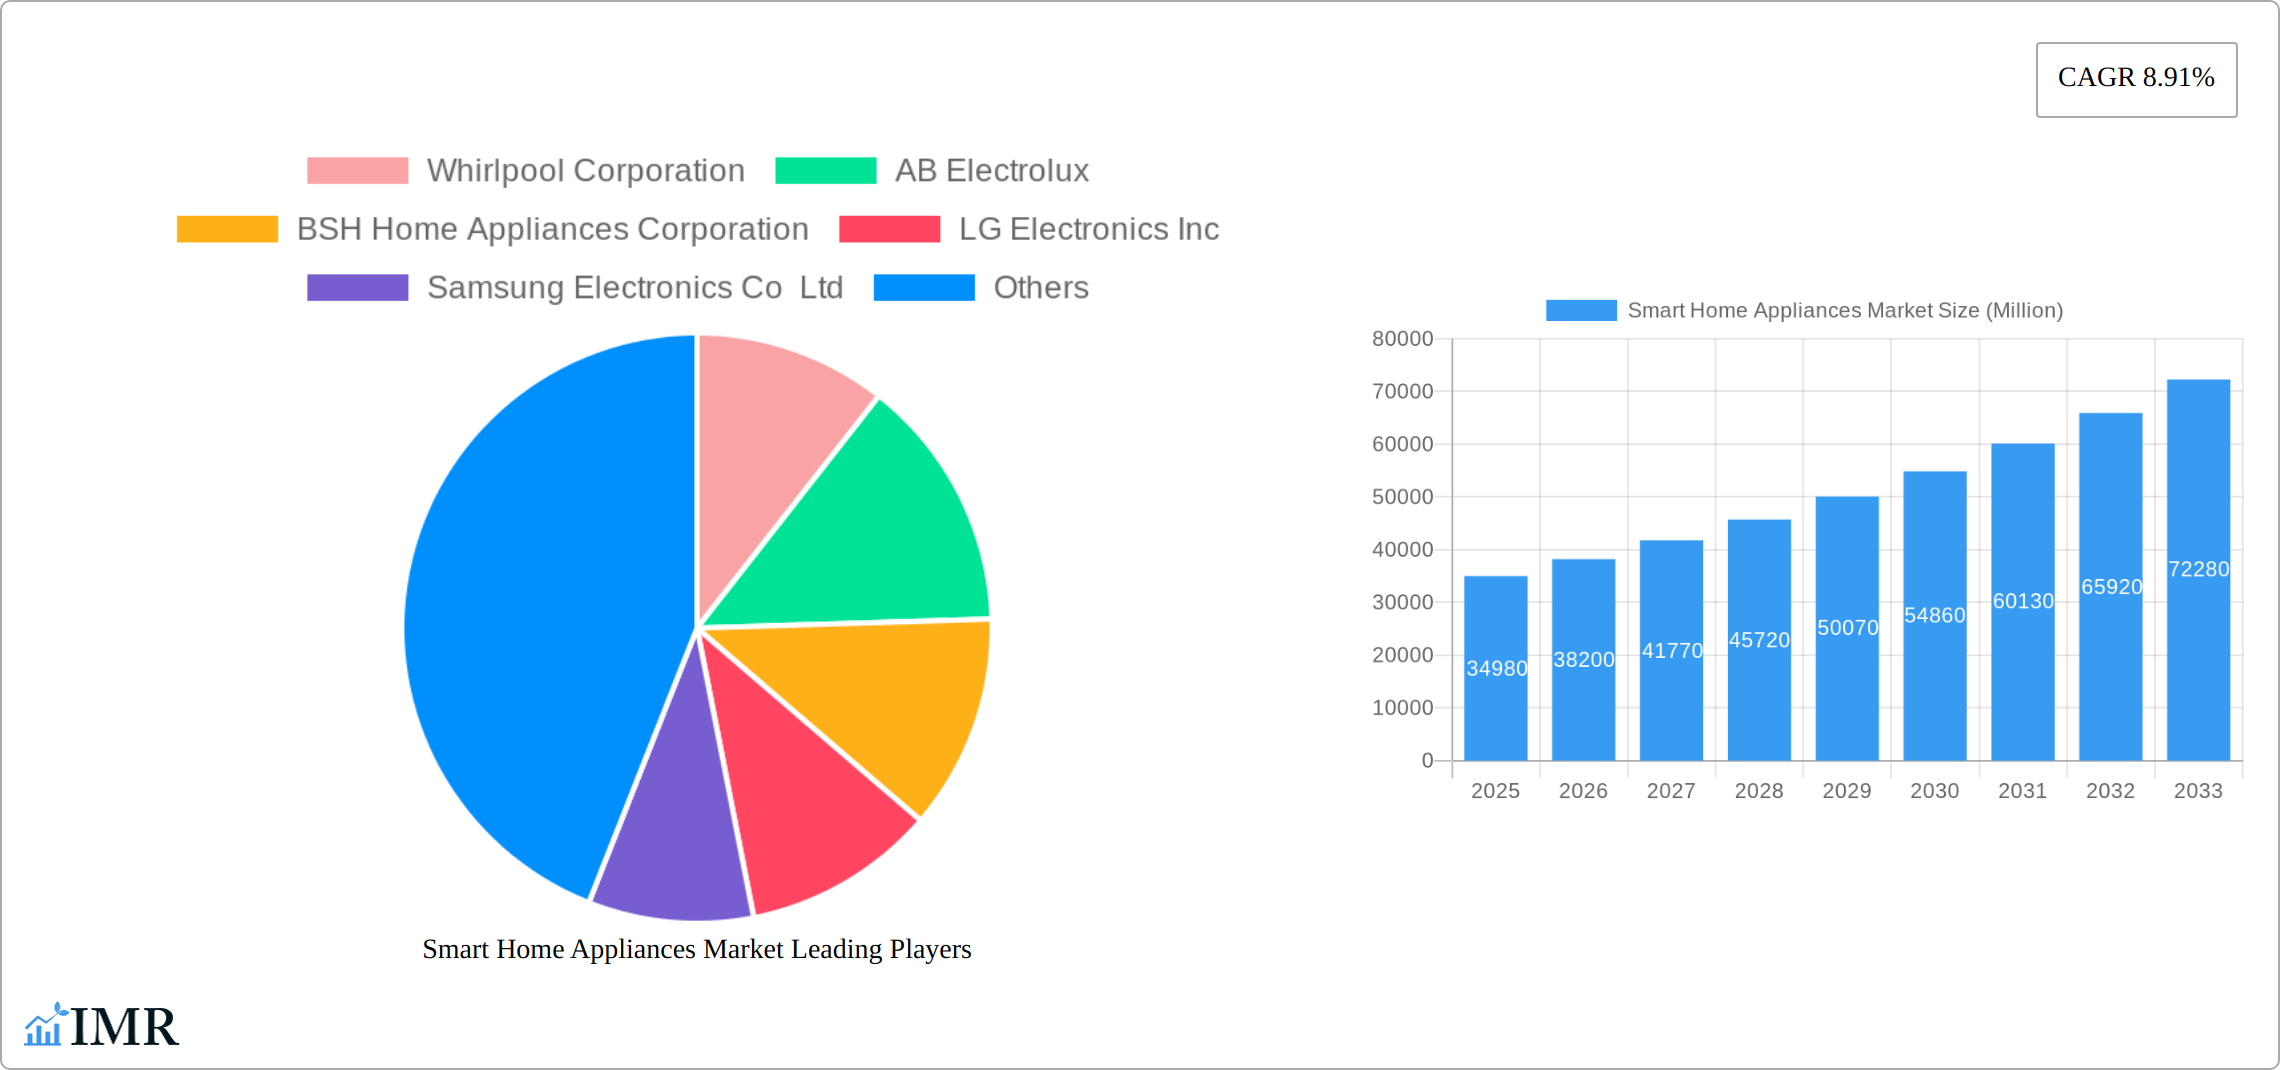
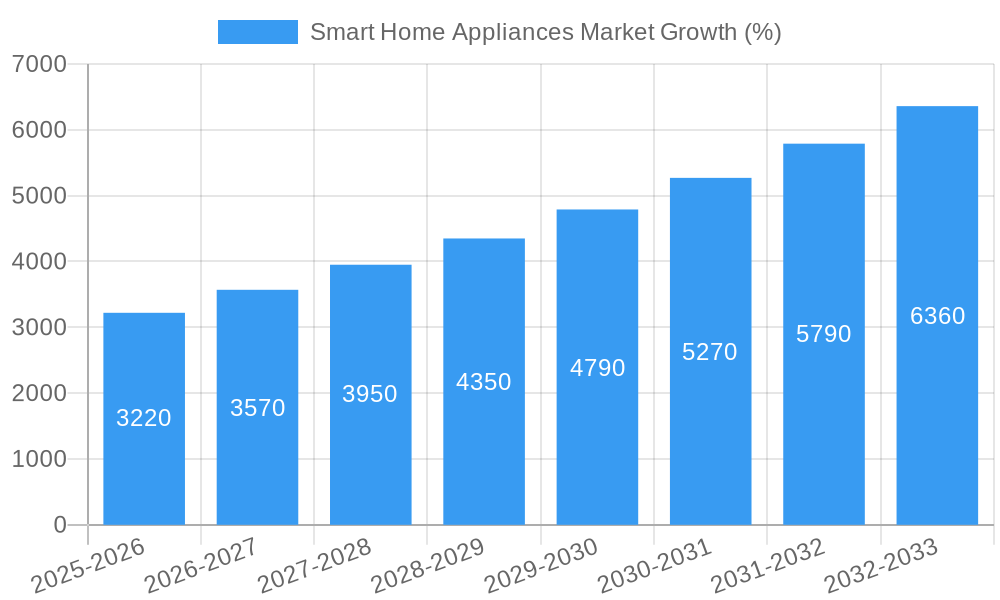
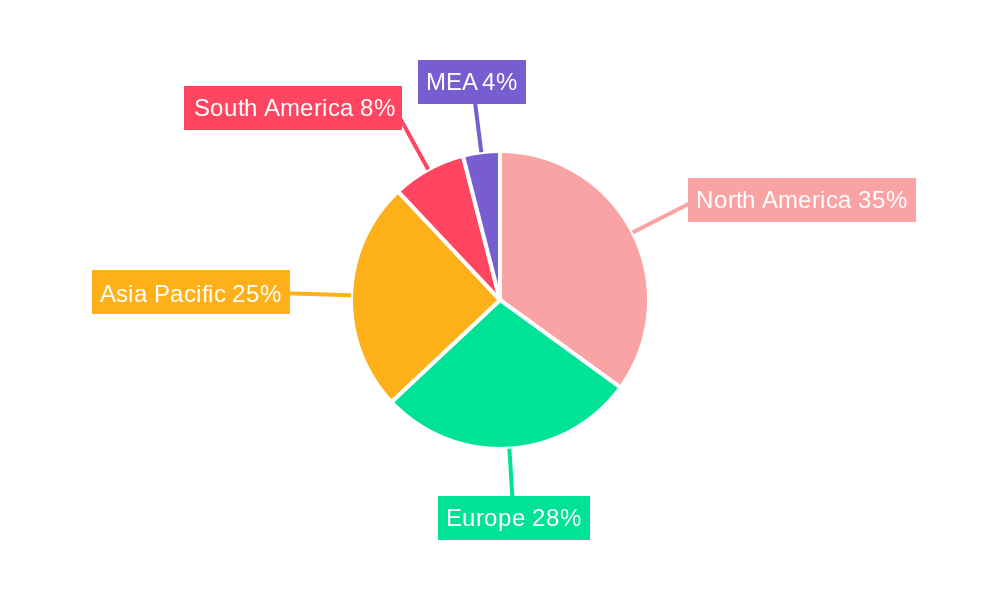
The global smart home appliances market is experiencing robust growth, projected to reach a substantial size, driven by increasing consumer demand for convenience, energy efficiency, and enhanced home management capabilities. The market's Compound Annual Growth Rate (CAGR) of 8.91% from 2019 to 2024 indicates a strong upward trajectory, expected to continue throughout the forecast period (2025-2033). Key drivers include rising disposable incomes in developing economies, increasing adoption of smart home technologies, and the proliferation of advanced features such as voice control and internet connectivity in appliances. The market is segmented by product type, with smart refrigerators, ovens, and dishwashers leading the charge, followed by smart cookware and cooktops. The increasing integration of these appliances into broader smart home ecosystems further fuels market expansion. Leading manufacturers such as Whirlpool, LG, Samsung, and Bosch are aggressively investing in research and development to improve product functionality and affordability, making them more accessible to a wider consumer base. Geographic segmentation reveals strong growth across North America and Asia Pacific, driven by high technological adoption rates and increasing urbanization. While Europe also shows substantial growth, the market penetration varies across different regions within the continent due to varying levels of consumer awareness and technological infrastructure.
The restraints to market growth include concerns regarding data privacy and security associated with connected appliances, high initial costs compared to traditional appliances, and the need for reliable internet connectivity for optimal functionality. However, ongoing technological advancements in areas such as cybersecurity and the decreasing cost of smart home appliances are mitigating these challenges. The market is poised for considerable expansion, fueled by the continued development of innovative features, improved user interfaces, and the increasing integration of smart appliances into comprehensive home automation systems. Future growth will likely be shaped by factors such as the development of energy-efficient appliances, enhanced integration with other smart home devices, and the increasing adoption of subscription-based services that provide remote monitoring and maintenance. The continued focus on user experience and affordability will be crucial for sustaining this growth trajectory.
Smart Home Appliances Market Report: 2019-2033
This comprehensive report provides a detailed analysis of the Smart Home Appliances market, encompassing market dynamics, growth trends, regional insights, product landscape, key players, and future outlook. The study period spans from 2019 to 2033, with 2025 serving as the base year and estimated year. The report offers valuable insights for industry professionals, investors, and strategic decision-makers seeking to navigate this rapidly evolving market. The market is segmented by product type, including smart ovens, dishwashers, refrigerators, cookware and cooktops, scales and thermometers, and other product types. Key players analyzed include Whirlpool Corporation, AB Electrolux, BSH Home Appliances Corporation, LG Electronics Inc, Samsung Electronics Co Ltd, Breville Group Limite, Haier Group, and Panasonic Corporation. The global market size is predicted to reach xx Million units by 2033.
Smart Home Appliances Market Market Dynamics & Structure
The Smart Home Appliances market is characterized by a moderately concentrated landscape, with a few major players holding significant market share. However, the entry of numerous innovative startups and the increasing adoption of smart home technologies are fostering competition. Technological innovation, particularly in areas like AI-powered functionalities, energy efficiency, and seamless integration with other smart home devices, is a key growth driver. Regulatory frameworks concerning data privacy and security are shaping market developments. The presence of traditional appliances acts as a competitive substitute, while emerging technologies, such as voice assistants and smart home ecosystems, are creating new opportunities. The end-user demographic is primarily composed of tech-savvy homeowners and renters seeking convenience, improved energy management, and enhanced home security. The past five years have witnessed a moderate number of M&A deals, primarily focused on consolidating market share and acquiring innovative technologies.
- Market Concentration: Moderately concentrated, with top 5 players holding approximately xx% market share in 2024.
- Technological Innovation: AI-powered features, energy efficiency improvements, seamless device integration are key drivers.
- Regulatory Frameworks: Data privacy and security regulations are influencing product development and market entry.
- Competitive Substitutes: Traditional home appliances remain a significant substitute.
- End-User Demographics: Tech-savvy homeowners and renters aged 25-55 are the primary target.
- M&A Trends: Moderate deal volume (xx deals) over 2019-2024, focused on technology acquisition and market consolidation.
Smart Home Appliances Market Growth Trends & Insights
The Smart Home Appliances market exhibits robust growth, driven by increasing disposable incomes, rising urbanization, and a growing preference for connected devices. The market size experienced significant expansion from xx Million units in 2019 to xx Million units in 2024, reflecting a CAGR of xx%. The adoption rate is accelerating, particularly in developed regions with high internet penetration. Technological advancements, such as the integration of IoT, AI, and cloud-based services, are significantly disrupting traditional appliance manufacturing. Consumer behavior is shifting toward smart, energy-efficient, and user-friendly devices. The predicted market penetration by 2033 is xx%, indicating significant untapped potential.
Dominant Regions, Countries, or Segments in Smart Home Appliances Market
North America and Europe currently dominate the Smart Home Appliances market, owing to high consumer spending, technological advancement, and established infrastructure. However, Asia-Pacific is expected to witness the fastest growth during the forecast period, fueled by rising disposable incomes, increasing urbanization, and expanding internet penetration. Among product types, Smart Refrigerators currently hold the largest market share, followed by Smart Dishwashers. However, Smart Cookware and Cooktops are expected to experience rapid growth, driven by innovations and increased consumer interest in smart kitchen solutions.
- Key Drivers: High disposable incomes (North America, Europe); Rising urbanization and internet penetration (Asia-Pacific); Government initiatives promoting energy efficiency.
- North America: High market share (xx%), driven by early adoption and advanced technology integration.
- Europe: Significant market share (xx%), driven by high consumer awareness and demand for smart home solutions.
- Asia-Pacific: Fastest-growing region (xx% CAGR), driven by rapid economic development and rising consumer spending.
- Product Type: Smart Refrigerators currently lead in market share (xx%), followed by Smart Dishwashers (xx%). Smart Cookware and Cooktops show high growth potential.
Smart Home Appliances Market Product Landscape
The Smart Home Appliances market is characterized by a wide range of innovative products offering advanced features like voice control, remote monitoring, energy-efficient operation, and seamless integration with other smart home devices. Products are increasingly incorporating AI and machine learning capabilities for personalized experiences, predictive maintenance, and enhanced convenience. Key performance metrics include energy consumption, operational efficiency, ease of use, and user satisfaction. Unique selling propositions are often focused on ease of use, integration capabilities, and energy savings.
Key Drivers, Barriers & Challenges in Smart Home Appliances Market
Key Drivers:
- Growing consumer demand for convenience and energy efficiency.
- Increasing affordability of smart home devices.
- Advancements in IoT and AI technologies.
- Government support and incentives for energy-efficient appliances.
Key Challenges & Restraints:
- High initial cost of smart home appliances compared to traditional models.
- Concerns over data security and privacy.
- Complexity of installation and integration with other smart home devices.
- Dependence on reliable internet connectivity.
- Supply chain disruptions impacting production and availability. (Quantifiable impact: xx% increase in production costs in 2022).
Emerging Opportunities in Smart Home Appliances Market
- Expansion into untapped markets in developing economies.
- Development of innovative applications for smart home appliances, including integration with health and wellness platforms.
- Customized appliance designs catering to diverse consumer needs and preferences.
- Integration with sustainable energy solutions, promoting environmentally friendly operations.
Growth Accelerators in the Smart Home Appliances Market Industry
Technological breakthroughs, strategic partnerships, and expansion into new markets are significant catalysts driving long-term growth. The integration of AI and machine learning offers enhanced functionalities, while collaborations between appliance manufacturers and technology providers unlock broader functionalities and improved user experiences. Expansion into emerging markets with rising disposable incomes and increased internet penetration presents significant opportunities for growth.
Key Players Shaping the Smart Home Appliances Market Market
- Whirlpool Corporation
- AB Electrolux
- BSH Home Appliances Corporation
- LG Electronics Inc
- Samsung Electronics Co Ltd
- Breville Group Limite
- Haier Group
- Panasonic Corporation
Notable Milestones in Smart Home Appliances Market Sector
- September 2022: LG Electronics launched its MoodUP refrigerator with color-changing LED door panels, targeting younger consumers.
- August 2022: Enphase Energy partnered with Home Connect to integrate its home energy systems, offering a smart solution for appliance energy management.
- February 2022: Godrej & Boyce launched a line of luxury air conditioners with IoT controls, UVCool technology, and Nano Coated Anti-Viral filtering.
In-Depth Smart Home Appliances Market Market Outlook
The Smart Home Appliances market is poised for sustained growth driven by continuous technological advancements, expanding product portfolios, and increasing consumer adoption. Strategic partnerships and investments in research and development will further accelerate market expansion. Untapped markets in developing economies represent significant growth opportunities. The focus on energy efficiency and sustainable solutions will further drive adoption. The market's future is bright, promising significant returns for innovative players.
Smart Home Appliances Market Segmentation
-
1. Product Type
- 1.1. Smart Ovens
- 1.2. Smart Dishwashers
- 1.3. Smart Refrigerators
- 1.4. Smart Cookware and Cooktops
- 1.5. Smart Scale and Thermometers
- 1.6. Other Product Types
Smart Home Appliances Market Segmentation By Geography
-
1. North America
- 1.1. United States
- 1.2. Canada
-
2. Europe
- 2.1. Germany
- 2.2. United Kingdom
- 2.3. France
- 2.4. Spain
-
3. Asia
- 3.1. China
- 3.2. Japan
- 4. Australia and New Zealand
- 5. Latin America
- 6. Middle East and Africa
Smart Home Appliances Market REPORT HIGHLIGHTS
| Aspects | Details |
|---|---|
| Study Period | 2019-2033 |
| Base Year | 2024 |
| Estimated Year | 2025 |
| Forecast Period | 2025-2033 |
| Historical Period | 2019-2024 |
| Growth Rate | CAGR of 8.91% from 2019-2033 |
| Segmentation |
|
Table of Contents
- 1. Introduction
- 1.1. Research Scope
- 1.2. Market Segmentation
- 1.3. Research Methodology
- 1.4. Definitions and Assumptions
- 2. Executive Summary
- 2.1. Introduction
- 3. Market Dynamics
- 3.1. Introduction
- 3.2. Market Drivers
- 3.2.1. Growing Household Income Combined with Increased Awareness among Consumers
- 3.3. Market Restrains
- 3.3.1. ; Easy Availability of Counterfeit Products
- 3.4. Market Trends
- 3.4.1. Smart Oven to Drive Significant Market Growth
- 4. Market Factor Analysis
- 4.1. Porters Five Forces
- 4.2. Supply/Value Chain
- 4.3. PESTEL analysis
- 4.4. Market Entropy
- 4.5. Patent/Trademark Analysis
- 5. Global Smart Home Appliances Market Analysis, Insights and Forecast, 2019-2031
- 5.1. Market Analysis, Insights and Forecast - by Product Type
- 5.1.1. Smart Ovens
- 5.1.2. Smart Dishwashers
- 5.1.3. Smart Refrigerators
- 5.1.4. Smart Cookware and Cooktops
- 5.1.5. Smart Scale and Thermometers
- 5.1.6. Other Product Types
- 5.2. Market Analysis, Insights and Forecast - by Region
- 5.2.1. North America
- 5.2.2. Europe
- 5.2.3. Asia
- 5.2.4. Australia and New Zealand
- 5.2.5. Latin America
- 5.2.6. Middle East and Africa
- 5.1. Market Analysis, Insights and Forecast - by Product Type
- 6. North America Smart Home Appliances Market Analysis, Insights and Forecast, 2019-2031
- 6.1. Market Analysis, Insights and Forecast - by Product Type
- 6.1.1. Smart Ovens
- 6.1.2. Smart Dishwashers
- 6.1.3. Smart Refrigerators
- 6.1.4. Smart Cookware and Cooktops
- 6.1.5. Smart Scale and Thermometers
- 6.1.6. Other Product Types
- 6.1. Market Analysis, Insights and Forecast - by Product Type
- 7. Europe Smart Home Appliances Market Analysis, Insights and Forecast, 2019-2031
- 7.1. Market Analysis, Insights and Forecast - by Product Type
- 7.1.1. Smart Ovens
- 7.1.2. Smart Dishwashers
- 7.1.3. Smart Refrigerators
- 7.1.4. Smart Cookware and Cooktops
- 7.1.5. Smart Scale and Thermometers
- 7.1.6. Other Product Types
- 7.1. Market Analysis, Insights and Forecast - by Product Type
- 8. Asia Smart Home Appliances Market Analysis, Insights and Forecast, 2019-2031
- 8.1. Market Analysis, Insights and Forecast - by Product Type
- 8.1.1. Smart Ovens
- 8.1.2. Smart Dishwashers
- 8.1.3. Smart Refrigerators
- 8.1.4. Smart Cookware and Cooktops
- 8.1.5. Smart Scale and Thermometers
- 8.1.6. Other Product Types
- 8.1. Market Analysis, Insights and Forecast - by Product Type
- 9. Australia and New Zealand Smart Home Appliances Market Analysis, Insights and Forecast, 2019-2031
- 9.1. Market Analysis, Insights and Forecast - by Product Type
- 9.1.1. Smart Ovens
- 9.1.2. Smart Dishwashers
- 9.1.3. Smart Refrigerators
- 9.1.4. Smart Cookware and Cooktops
- 9.1.5. Smart Scale and Thermometers
- 9.1.6. Other Product Types
- 9.1. Market Analysis, Insights and Forecast - by Product Type
- 10. Latin America Smart Home Appliances Market Analysis, Insights and Forecast, 2019-2031
- 10.1. Market Analysis, Insights and Forecast - by Product Type
- 10.1.1. Smart Ovens
- 10.1.2. Smart Dishwashers
- 10.1.3. Smart Refrigerators
- 10.1.4. Smart Cookware and Cooktops
- 10.1.5. Smart Scale and Thermometers
- 10.1.6. Other Product Types
- 10.1. Market Analysis, Insights and Forecast - by Product Type
- 11. Middle East and Africa Smart Home Appliances Market Analysis, Insights and Forecast, 2019-2031
- 11.1. Market Analysis, Insights and Forecast - by Product Type
- 11.1.1. Smart Ovens
- 11.1.2. Smart Dishwashers
- 11.1.3. Smart Refrigerators
- 11.1.4. Smart Cookware and Cooktops
- 11.1.5. Smart Scale and Thermometers
- 11.1.6. Other Product Types
- 11.1. Market Analysis, Insights and Forecast - by Product Type
- 12. North America Smart Home Appliances Market Analysis, Insights and Forecast, 2019-2031
- 12.1. Market Analysis, Insights and Forecast - By Country/Sub-region
- 12.1.1 United States
- 12.1.2 Canada
- 12.1.3 Mexico
- 13. Europe Smart Home Appliances Market Analysis, Insights and Forecast, 2019-2031
- 13.1. Market Analysis, Insights and Forecast - By Country/Sub-region
- 13.1.1 Germany
- 13.1.2 United Kingdom
- 13.1.3 France
- 13.1.4 Spain
- 13.1.5 Italy
- 13.1.6 Spain
- 13.1.7 Belgium
- 13.1.8 Netherland
- 13.1.9 Nordics
- 13.1.10 Rest of Europe
- 14. Asia Pacific Smart Home Appliances Market Analysis, Insights and Forecast, 2019-2031
- 14.1. Market Analysis, Insights and Forecast - By Country/Sub-region
- 14.1.1 China
- 14.1.2 Japan
- 14.1.3 India
- 14.1.4 South Korea
- 14.1.5 Southeast Asia
- 14.1.6 Australia
- 14.1.7 Indonesia
- 14.1.8 Phillipes
- 14.1.9 Singapore
- 14.1.10 Thailandc
- 14.1.11 Rest of Asia Pacific
- 15. South America Smart Home Appliances Market Analysis, Insights and Forecast, 2019-2031
- 15.1. Market Analysis, Insights and Forecast - By Country/Sub-region
- 15.1.1 Brazil
- 15.1.2 Argentina
- 15.1.3 Peru
- 15.1.4 Chile
- 15.1.5 Colombia
- 15.1.6 Ecuador
- 15.1.7 Venezuela
- 15.1.8 Rest of South America
- 16. North America Smart Home Appliances Market Analysis, Insights and Forecast, 2019-2031
- 16.1. Market Analysis, Insights and Forecast - By Country/Sub-region
- 16.1.1 United States
- 16.1.2 Canada
- 16.1.3 Mexico
- 17. MEA Smart Home Appliances Market Analysis, Insights and Forecast, 2019-2031
- 17.1. Market Analysis, Insights and Forecast - By Country/Sub-region
- 17.1.1 United Arab Emirates
- 17.1.2 Saudi Arabia
- 17.1.3 South Africa
- 17.1.4 Rest of Middle East and Africa
- 18. Competitive Analysis
- 18.1. Global Market Share Analysis 2024
- 18.2. Company Profiles
- 18.2.1 Whirlpool Corporation
- 18.2.1.1. Overview
- 18.2.1.2. Products
- 18.2.1.3. SWOT Analysis
- 18.2.1.4. Recent Developments
- 18.2.1.5. Financials (Based on Availability)
- 18.2.2 AB Electrolux
- 18.2.2.1. Overview
- 18.2.2.2. Products
- 18.2.2.3. SWOT Analysis
- 18.2.2.4. Recent Developments
- 18.2.2.5. Financials (Based on Availability)
- 18.2.3 BSH Home Appliances Corporation
- 18.2.3.1. Overview
- 18.2.3.2. Products
- 18.2.3.3. SWOT Analysis
- 18.2.3.4. Recent Developments
- 18.2.3.5. Financials (Based on Availability)
- 18.2.4 LG Electronics Inc
- 18.2.4.1. Overview
- 18.2.4.2. Products
- 18.2.4.3. SWOT Analysis
- 18.2.4.4. Recent Developments
- 18.2.4.5. Financials (Based on Availability)
- 18.2.5 Samsung Electronics Co Ltd
- 18.2.5.1. Overview
- 18.2.5.2. Products
- 18.2.5.3. SWOT Analysis
- 18.2.5.4. Recent Developments
- 18.2.5.5. Financials (Based on Availability)
- 18.2.6 Breville Group Limite
- 18.2.6.1. Overview
- 18.2.6.2. Products
- 18.2.6.3. SWOT Analysis
- 18.2.6.4. Recent Developments
- 18.2.6.5. Financials (Based on Availability)
- 18.2.7 Haier Group
- 18.2.7.1. Overview
- 18.2.7.2. Products
- 18.2.7.3. SWOT Analysis
- 18.2.7.4. Recent Developments
- 18.2.7.5. Financials (Based on Availability)
- 18.2.8 Panasonic Corporation
- 18.2.8.1. Overview
- 18.2.8.2. Products
- 18.2.8.3. SWOT Analysis
- 18.2.8.4. Recent Developments
- 18.2.8.5. Financials (Based on Availability)
- 18.2.1 Whirlpool Corporation
List of Figures
- Figure 1: Global Smart Home Appliances Market Revenue Breakdown (Million, %) by Region 2024 & 2032
- Figure 2: Global Smart Home Appliances Market Volume Breakdown (K Unit, %) by Region 2024 & 2032
- Figure 3: North America Smart Home Appliances Market Revenue (Million), by Country 2024 & 2032
- Figure 4: North America Smart Home Appliances Market Volume (K Unit), by Country 2024 & 2032
- Figure 5: North America Smart Home Appliances Market Revenue Share (%), by Country 2024 & 2032
- Figure 6: North America Smart Home Appliances Market Volume Share (%), by Country 2024 & 2032
- Figure 7: Europe Smart Home Appliances Market Revenue (Million), by Country 2024 & 2032
- Figure 8: Europe Smart Home Appliances Market Volume (K Unit), by Country 2024 & 2032
- Figure 9: Europe Smart Home Appliances Market Revenue Share (%), by Country 2024 & 2032
- Figure 10: Europe Smart Home Appliances Market Volume Share (%), by Country 2024 & 2032
- Figure 11: Asia Pacific Smart Home Appliances Market Revenue (Million), by Country 2024 & 2032
- Figure 12: Asia Pacific Smart Home Appliances Market Volume (K Unit), by Country 2024 & 2032
- Figure 13: Asia Pacific Smart Home Appliances Market Revenue Share (%), by Country 2024 & 2032
- Figure 14: Asia Pacific Smart Home Appliances Market Volume Share (%), by Country 2024 & 2032
- Figure 15: South America Smart Home Appliances Market Revenue (Million), by Country 2024 & 2032
- Figure 16: South America Smart Home Appliances Market Volume (K Unit), by Country 2024 & 2032
- Figure 17: South America Smart Home Appliances Market Revenue Share (%), by Country 2024 & 2032
- Figure 18: South America Smart Home Appliances Market Volume Share (%), by Country 2024 & 2032
- Figure 19: North America Smart Home Appliances Market Revenue (Million), by Country 2024 & 2032
- Figure 20: North America Smart Home Appliances Market Volume (K Unit), by Country 2024 & 2032
- Figure 21: North America Smart Home Appliances Market Revenue Share (%), by Country 2024 & 2032
- Figure 22: North America Smart Home Appliances Market Volume Share (%), by Country 2024 & 2032
- Figure 23: MEA Smart Home Appliances Market Revenue (Million), by Country 2024 & 2032
- Figure 24: MEA Smart Home Appliances Market Volume (K Unit), by Country 2024 & 2032
- Figure 25: MEA Smart Home Appliances Market Revenue Share (%), by Country 2024 & 2032
- Figure 26: MEA Smart Home Appliances Market Volume Share (%), by Country 2024 & 2032
- Figure 27: North America Smart Home Appliances Market Revenue (Million), by Product Type 2024 & 2032
- Figure 28: North America Smart Home Appliances Market Volume (K Unit), by Product Type 2024 & 2032
- Figure 29: North America Smart Home Appliances Market Revenue Share (%), by Product Type 2024 & 2032
- Figure 30: North America Smart Home Appliances Market Volume Share (%), by Product Type 2024 & 2032
- Figure 31: North America Smart Home Appliances Market Revenue (Million), by Country 2024 & 2032
- Figure 32: North America Smart Home Appliances Market Volume (K Unit), by Country 2024 & 2032
- Figure 33: North America Smart Home Appliances Market Revenue Share (%), by Country 2024 & 2032
- Figure 34: North America Smart Home Appliances Market Volume Share (%), by Country 2024 & 2032
- Figure 35: Europe Smart Home Appliances Market Revenue (Million), by Product Type 2024 & 2032
- Figure 36: Europe Smart Home Appliances Market Volume (K Unit), by Product Type 2024 & 2032
- Figure 37: Europe Smart Home Appliances Market Revenue Share (%), by Product Type 2024 & 2032
- Figure 38: Europe Smart Home Appliances Market Volume Share (%), by Product Type 2024 & 2032
- Figure 39: Europe Smart Home Appliances Market Revenue (Million), by Country 2024 & 2032
- Figure 40: Europe Smart Home Appliances Market Volume (K Unit), by Country 2024 & 2032
- Figure 41: Europe Smart Home Appliances Market Revenue Share (%), by Country 2024 & 2032
- Figure 42: Europe Smart Home Appliances Market Volume Share (%), by Country 2024 & 2032
- Figure 43: Asia Smart Home Appliances Market Revenue (Million), by Product Type 2024 & 2032
- Figure 44: Asia Smart Home Appliances Market Volume (K Unit), by Product Type 2024 & 2032
- Figure 45: Asia Smart Home Appliances Market Revenue Share (%), by Product Type 2024 & 2032
- Figure 46: Asia Smart Home Appliances Market Volume Share (%), by Product Type 2024 & 2032
- Figure 47: Asia Smart Home Appliances Market Revenue (Million), by Country 2024 & 2032
- Figure 48: Asia Smart Home Appliances Market Volume (K Unit), by Country 2024 & 2032
- Figure 49: Asia Smart Home Appliances Market Revenue Share (%), by Country 2024 & 2032
- Figure 50: Asia Smart Home Appliances Market Volume Share (%), by Country 2024 & 2032
- Figure 51: Australia and New Zealand Smart Home Appliances Market Revenue (Million), by Product Type 2024 & 2032
- Figure 52: Australia and New Zealand Smart Home Appliances Market Volume (K Unit), by Product Type 2024 & 2032
- Figure 53: Australia and New Zealand Smart Home Appliances Market Revenue Share (%), by Product Type 2024 & 2032
- Figure 54: Australia and New Zealand Smart Home Appliances Market Volume Share (%), by Product Type 2024 & 2032
- Figure 55: Australia and New Zealand Smart Home Appliances Market Revenue (Million), by Country 2024 & 2032
- Figure 56: Australia and New Zealand Smart Home Appliances Market Volume (K Unit), by Country 2024 & 2032
- Figure 57: Australia and New Zealand Smart Home Appliances Market Revenue Share (%), by Country 2024 & 2032
- Figure 58: Australia and New Zealand Smart Home Appliances Market Volume Share (%), by Country 2024 & 2032
- Figure 59: Latin America Smart Home Appliances Market Revenue (Million), by Product Type 2024 & 2032
- Figure 60: Latin America Smart Home Appliances Market Volume (K Unit), by Product Type 2024 & 2032
- Figure 61: Latin America Smart Home Appliances Market Revenue Share (%), by Product Type 2024 & 2032
- Figure 62: Latin America Smart Home Appliances Market Volume Share (%), by Product Type 2024 & 2032
- Figure 63: Latin America Smart Home Appliances Market Revenue (Million), by Country 2024 & 2032
- Figure 64: Latin America Smart Home Appliances Market Volume (K Unit), by Country 2024 & 2032
- Figure 65: Latin America Smart Home Appliances Market Revenue Share (%), by Country 2024 & 2032
- Figure 66: Latin America Smart Home Appliances Market Volume Share (%), by Country 2024 & 2032
- Figure 67: Middle East and Africa Smart Home Appliances Market Revenue (Million), by Product Type 2024 & 2032
- Figure 68: Middle East and Africa Smart Home Appliances Market Volume (K Unit), by Product Type 2024 & 2032
- Figure 69: Middle East and Africa Smart Home Appliances Market Revenue Share (%), by Product Type 2024 & 2032
- Figure 70: Middle East and Africa Smart Home Appliances Market Volume Share (%), by Product Type 2024 & 2032
- Figure 71: Middle East and Africa Smart Home Appliances Market Revenue (Million), by Country 2024 & 2032
- Figure 72: Middle East and Africa Smart Home Appliances Market Volume (K Unit), by Country 2024 & 2032
- Figure 73: Middle East and Africa Smart Home Appliances Market Revenue Share (%), by Country 2024 & 2032
- Figure 74: Middle East and Africa Smart Home Appliances Market Volume Share (%), by Country 2024 & 2032
List of Tables
- Table 1: Global Smart Home Appliances Market Revenue Million Forecast, by Region 2019 & 2032
- Table 2: Global Smart Home Appliances Market Volume K Unit Forecast, by Region 2019 & 2032
- Table 3: Global Smart Home Appliances Market Revenue Million Forecast, by Product Type 2019 & 2032
- Table 4: Global Smart Home Appliances Market Volume K Unit Forecast, by Product Type 2019 & 2032
- Table 5: Global Smart Home Appliances Market Revenue Million Forecast, by Region 2019 & 2032
- Table 6: Global Smart Home Appliances Market Volume K Unit Forecast, by Region 2019 & 2032
- Table 7: Global Smart Home Appliances Market Revenue Million Forecast, by Country 2019 & 2032
- Table 8: Global Smart Home Appliances Market Volume K Unit Forecast, by Country 2019 & 2032
- Table 9: United States Smart Home Appliances Market Revenue (Million) Forecast, by Application 2019 & 2032
- Table 10: United States Smart Home Appliances Market Volume (K Unit) Forecast, by Application 2019 & 2032
- Table 11: Canada Smart Home Appliances Market Revenue (Million) Forecast, by Application 2019 & 2032
- Table 12: Canada Smart Home Appliances Market Volume (K Unit) Forecast, by Application 2019 & 2032
- Table 13: Mexico Smart Home Appliances Market Revenue (Million) Forecast, by Application 2019 & 2032
- Table 14: Mexico Smart Home Appliances Market Volume (K Unit) Forecast, by Application 2019 & 2032
- Table 15: Global Smart Home Appliances Market Revenue Million Forecast, by Country 2019 & 2032
- Table 16: Global Smart Home Appliances Market Volume K Unit Forecast, by Country 2019 & 2032
- Table 17: Germany Smart Home Appliances Market Revenue (Million) Forecast, by Application 2019 & 2032
- Table 18: Germany Smart Home Appliances Market Volume (K Unit) Forecast, by Application 2019 & 2032
- Table 19: United Kingdom Smart Home Appliances Market Revenue (Million) Forecast, by Application 2019 & 2032
- Table 20: United Kingdom Smart Home Appliances Market Volume (K Unit) Forecast, by Application 2019 & 2032
- Table 21: France Smart Home Appliances Market Revenue (Million) Forecast, by Application 2019 & 2032
- Table 22: France Smart Home Appliances Market Volume (K Unit) Forecast, by Application 2019 & 2032
- Table 23: Spain Smart Home Appliances Market Revenue (Million) Forecast, by Application 2019 & 2032
- Table 24: Spain Smart Home Appliances Market Volume (K Unit) Forecast, by Application 2019 & 2032
- Table 25: Italy Smart Home Appliances Market Revenue (Million) Forecast, by Application 2019 & 2032
- Table 26: Italy Smart Home Appliances Market Volume (K Unit) Forecast, by Application 2019 & 2032
- Table 27: Spain Smart Home Appliances Market Revenue (Million) Forecast, by Application 2019 & 2032
- Table 28: Spain Smart Home Appliances Market Volume (K Unit) Forecast, by Application 2019 & 2032
- Table 29: Belgium Smart Home Appliances Market Revenue (Million) Forecast, by Application 2019 & 2032
- Table 30: Belgium Smart Home Appliances Market Volume (K Unit) Forecast, by Application 2019 & 2032
- Table 31: Netherland Smart Home Appliances Market Revenue (Million) Forecast, by Application 2019 & 2032
- Table 32: Netherland Smart Home Appliances Market Volume (K Unit) Forecast, by Application 2019 & 2032
- Table 33: Nordics Smart Home Appliances Market Revenue (Million) Forecast, by Application 2019 & 2032
- Table 34: Nordics Smart Home Appliances Market Volume (K Unit) Forecast, by Application 2019 & 2032
- Table 35: Rest of Europe Smart Home Appliances Market Revenue (Million) Forecast, by Application 2019 & 2032
- Table 36: Rest of Europe Smart Home Appliances Market Volume (K Unit) Forecast, by Application 2019 & 2032
- Table 37: Global Smart Home Appliances Market Revenue Million Forecast, by Country 2019 & 2032
- Table 38: Global Smart Home Appliances Market Volume K Unit Forecast, by Country 2019 & 2032
- Table 39: China Smart Home Appliances Market Revenue (Million) Forecast, by Application 2019 & 2032
- Table 40: China Smart Home Appliances Market Volume (K Unit) Forecast, by Application 2019 & 2032
- Table 41: Japan Smart Home Appliances Market Revenue (Million) Forecast, by Application 2019 & 2032
- Table 42: Japan Smart Home Appliances Market Volume (K Unit) Forecast, by Application 2019 & 2032
- Table 43: India Smart Home Appliances Market Revenue (Million) Forecast, by Application 2019 & 2032
- Table 44: India Smart Home Appliances Market Volume (K Unit) Forecast, by Application 2019 & 2032
- Table 45: South Korea Smart Home Appliances Market Revenue (Million) Forecast, by Application 2019 & 2032
- Table 46: South Korea Smart Home Appliances Market Volume (K Unit) Forecast, by Application 2019 & 2032
- Table 47: Southeast Asia Smart Home Appliances Market Revenue (Million) Forecast, by Application 2019 & 2032
- Table 48: Southeast Asia Smart Home Appliances Market Volume (K Unit) Forecast, by Application 2019 & 2032
- Table 49: Australia Smart Home Appliances Market Revenue (Million) Forecast, by Application 2019 & 2032
- Table 50: Australia Smart Home Appliances Market Volume (K Unit) Forecast, by Application 2019 & 2032
- Table 51: Indonesia Smart Home Appliances Market Revenue (Million) Forecast, by Application 2019 & 2032
- Table 52: Indonesia Smart Home Appliances Market Volume (K Unit) Forecast, by Application 2019 & 2032
- Table 53: Phillipes Smart Home Appliances Market Revenue (Million) Forecast, by Application 2019 & 2032
- Table 54: Phillipes Smart Home Appliances Market Volume (K Unit) Forecast, by Application 2019 & 2032
- Table 55: Singapore Smart Home Appliances Market Revenue (Million) Forecast, by Application 2019 & 2032
- Table 56: Singapore Smart Home Appliances Market Volume (K Unit) Forecast, by Application 2019 & 2032
- Table 57: Thailandc Smart Home Appliances Market Revenue (Million) Forecast, by Application 2019 & 2032
- Table 58: Thailandc Smart Home Appliances Market Volume (K Unit) Forecast, by Application 2019 & 2032
- Table 59: Rest of Asia Pacific Smart Home Appliances Market Revenue (Million) Forecast, by Application 2019 & 2032
- Table 60: Rest of Asia Pacific Smart Home Appliances Market Volume (K Unit) Forecast, by Application 2019 & 2032
- Table 61: Global Smart Home Appliances Market Revenue Million Forecast, by Country 2019 & 2032
- Table 62: Global Smart Home Appliances Market Volume K Unit Forecast, by Country 2019 & 2032
- Table 63: Brazil Smart Home Appliances Market Revenue (Million) Forecast, by Application 2019 & 2032
- Table 64: Brazil Smart Home Appliances Market Volume (K Unit) Forecast, by Application 2019 & 2032
- Table 65: Argentina Smart Home Appliances Market Revenue (Million) Forecast, by Application 2019 & 2032
- Table 66: Argentina Smart Home Appliances Market Volume (K Unit) Forecast, by Application 2019 & 2032
- Table 67: Peru Smart Home Appliances Market Revenue (Million) Forecast, by Application 2019 & 2032
- Table 68: Peru Smart Home Appliances Market Volume (K Unit) Forecast, by Application 2019 & 2032
- Table 69: Chile Smart Home Appliances Market Revenue (Million) Forecast, by Application 2019 & 2032
- Table 70: Chile Smart Home Appliances Market Volume (K Unit) Forecast, by Application 2019 & 2032
- Table 71: Colombia Smart Home Appliances Market Revenue (Million) Forecast, by Application 2019 & 2032
- Table 72: Colombia Smart Home Appliances Market Volume (K Unit) Forecast, by Application 2019 & 2032
- Table 73: Ecuador Smart Home Appliances Market Revenue (Million) Forecast, by Application 2019 & 2032
- Table 74: Ecuador Smart Home Appliances Market Volume (K Unit) Forecast, by Application 2019 & 2032
- Table 75: Venezuela Smart Home Appliances Market Revenue (Million) Forecast, by Application 2019 & 2032
- Table 76: Venezuela Smart Home Appliances Market Volume (K Unit) Forecast, by Application 2019 & 2032
- Table 77: Rest of South America Smart Home Appliances Market Revenue (Million) Forecast, by Application 2019 & 2032
- Table 78: Rest of South America Smart Home Appliances Market Volume (K Unit) Forecast, by Application 2019 & 2032
- Table 79: Global Smart Home Appliances Market Revenue Million Forecast, by Country 2019 & 2032
- Table 80: Global Smart Home Appliances Market Volume K Unit Forecast, by Country 2019 & 2032
- Table 81: United States Smart Home Appliances Market Revenue (Million) Forecast, by Application 2019 & 2032
- Table 82: United States Smart Home Appliances Market Volume (K Unit) Forecast, by Application 2019 & 2032
- Table 83: Canada Smart Home Appliances Market Revenue (Million) Forecast, by Application 2019 & 2032
- Table 84: Canada Smart Home Appliances Market Volume (K Unit) Forecast, by Application 2019 & 2032
- Table 85: Mexico Smart Home Appliances Market Revenue (Million) Forecast, by Application 2019 & 2032
- Table 86: Mexico Smart Home Appliances Market Volume (K Unit) Forecast, by Application 2019 & 2032
- Table 87: Global Smart Home Appliances Market Revenue Million Forecast, by Country 2019 & 2032
- Table 88: Global Smart Home Appliances Market Volume K Unit Forecast, by Country 2019 & 2032
- Table 89: United Arab Emirates Smart Home Appliances Market Revenue (Million) Forecast, by Application 2019 & 2032
- Table 90: United Arab Emirates Smart Home Appliances Market Volume (K Unit) Forecast, by Application 2019 & 2032
- Table 91: Saudi Arabia Smart Home Appliances Market Revenue (Million) Forecast, by Application 2019 & 2032
- Table 92: Saudi Arabia Smart Home Appliances Market Volume (K Unit) Forecast, by Application 2019 & 2032
- Table 93: South Africa Smart Home Appliances Market Revenue (Million) Forecast, by Application 2019 & 2032
- Table 94: South Africa Smart Home Appliances Market Volume (K Unit) Forecast, by Application 2019 & 2032
- Table 95: Rest of Middle East and Africa Smart Home Appliances Market Revenue (Million) Forecast, by Application 2019 & 2032
- Table 96: Rest of Middle East and Africa Smart Home Appliances Market Volume (K Unit) Forecast, by Application 2019 & 2032
- Table 97: Global Smart Home Appliances Market Revenue Million Forecast, by Product Type 2019 & 2032
- Table 98: Global Smart Home Appliances Market Volume K Unit Forecast, by Product Type 2019 & 2032
- Table 99: Global Smart Home Appliances Market Revenue Million Forecast, by Country 2019 & 2032
- Table 100: Global Smart Home Appliances Market Volume K Unit Forecast, by Country 2019 & 2032
- Table 101: United States Smart Home Appliances Market Revenue (Million) Forecast, by Application 2019 & 2032
- Table 102: United States Smart Home Appliances Market Volume (K Unit) Forecast, by Application 2019 & 2032
- Table 103: Canada Smart Home Appliances Market Revenue (Million) Forecast, by Application 2019 & 2032
- Table 104: Canada Smart Home Appliances Market Volume (K Unit) Forecast, by Application 2019 & 2032
- Table 105: Global Smart Home Appliances Market Revenue Million Forecast, by Product Type 2019 & 2032
- Table 106: Global Smart Home Appliances Market Volume K Unit Forecast, by Product Type 2019 & 2032
- Table 107: Global Smart Home Appliances Market Revenue Million Forecast, by Country 2019 & 2032
- Table 108: Global Smart Home Appliances Market Volume K Unit Forecast, by Country 2019 & 2032
- Table 109: Germany Smart Home Appliances Market Revenue (Million) Forecast, by Application 2019 & 2032
- Table 110: Germany Smart Home Appliances Market Volume (K Unit) Forecast, by Application 2019 & 2032
- Table 111: United Kingdom Smart Home Appliances Market Revenue (Million) Forecast, by Application 2019 & 2032
- Table 112: United Kingdom Smart Home Appliances Market Volume (K Unit) Forecast, by Application 2019 & 2032
- Table 113: France Smart Home Appliances Market Revenue (Million) Forecast, by Application 2019 & 2032
- Table 114: France Smart Home Appliances Market Volume (K Unit) Forecast, by Application 2019 & 2032
- Table 115: Spain Smart Home Appliances Market Revenue (Million) Forecast, by Application 2019 & 2032
- Table 116: Spain Smart Home Appliances Market Volume (K Unit) Forecast, by Application 2019 & 2032
- Table 117: Global Smart Home Appliances Market Revenue Million Forecast, by Product Type 2019 & 2032
- Table 118: Global Smart Home Appliances Market Volume K Unit Forecast, by Product Type 2019 & 2032
- Table 119: Global Smart Home Appliances Market Revenue Million Forecast, by Country 2019 & 2032
- Table 120: Global Smart Home Appliances Market Volume K Unit Forecast, by Country 2019 & 2032
- Table 121: China Smart Home Appliances Market Revenue (Million) Forecast, by Application 2019 & 2032
- Table 122: China Smart Home Appliances Market Volume (K Unit) Forecast, by Application 2019 & 2032
- Table 123: Japan Smart Home Appliances Market Revenue (Million) Forecast, by Application 2019 & 2032
- Table 124: Japan Smart Home Appliances Market Volume (K Unit) Forecast, by Application 2019 & 2032
- Table 125: Global Smart Home Appliances Market Revenue Million Forecast, by Product Type 2019 & 2032
- Table 126: Global Smart Home Appliances Market Volume K Unit Forecast, by Product Type 2019 & 2032
- Table 127: Global Smart Home Appliances Market Revenue Million Forecast, by Country 2019 & 2032
- Table 128: Global Smart Home Appliances Market Volume K Unit Forecast, by Country 2019 & 2032
- Table 129: Global Smart Home Appliances Market Revenue Million Forecast, by Product Type 2019 & 2032
- Table 130: Global Smart Home Appliances Market Volume K Unit Forecast, by Product Type 2019 & 2032
- Table 131: Global Smart Home Appliances Market Revenue Million Forecast, by Country 2019 & 2032
- Table 132: Global Smart Home Appliances Market Volume K Unit Forecast, by Country 2019 & 2032
- Table 133: Global Smart Home Appliances Market Revenue Million Forecast, by Product Type 2019 & 2032
- Table 134: Global Smart Home Appliances Market Volume K Unit Forecast, by Product Type 2019 & 2032
- Table 135: Global Smart Home Appliances Market Revenue Million Forecast, by Country 2019 & 2032
- Table 136: Global Smart Home Appliances Market Volume K Unit Forecast, by Country 2019 & 2032
Frequently Asked Questions
1. What is the projected Compound Annual Growth Rate (CAGR) of the Smart Home Appliances Market?
The projected CAGR is approximately 8.91%.
2. Which companies are prominent players in the Smart Home Appliances Market?
Key companies in the market include Whirlpool Corporation, AB Electrolux, BSH Home Appliances Corporation, LG Electronics Inc, Samsung Electronics Co Ltd, Breville Group Limite, Haier Group, Panasonic Corporation.
3. What are the main segments of the Smart Home Appliances Market?
The market segments include Product Type.
4. Can you provide details about the market size?
The market size is estimated to be USD 34.98 Million as of 2022.
5. What are some drivers contributing to market growth?
Growing Household Income Combined with Increased Awareness among Consumers.
6. What are the notable trends driving market growth?
Smart Oven to Drive Significant Market Growth.
7. Are there any restraints impacting market growth?
; Easy Availability of Counterfeit Products.
8. Can you provide examples of recent developments in the market?
September 2022 - At IFA 2022 in Berlin, Germany, LG Electronics (LG) plans to introduce its ground-breaking refrigerator with MoodUP technology, which includes color-changing LED door panels. The new refrigerator skillfully bridges the borders between design and technology to serve younger consumers' changing needs better. With the help of LG's MoodUP technology, customers can design a unique lighting system for the refrigerator using a variety of brilliant colors to match their mood or the surroundings. In addition, users may use the device's built-in Bluetooth speaker to play music to set the mood in the kitchen, whether they are hosting a party or cooking for themselves.
9. What pricing options are available for accessing the report?
Pricing options include single-user, multi-user, and enterprise licenses priced at USD 4750, USD 5250, and USD 8750 respectively.
10. Is the market size provided in terms of value or volume?
The market size is provided in terms of value, measured in Million and volume, measured in K Unit.
11. Are there any specific market keywords associated with the report?
Yes, the market keyword associated with the report is "Smart Home Appliances Market," which aids in identifying and referencing the specific market segment covered.
12. How do I determine which pricing option suits my needs best?
The pricing options vary based on user requirements and access needs. Individual users may opt for single-user licenses, while businesses requiring broader access may choose multi-user or enterprise licenses for cost-effective access to the report.
13. Are there any additional resources or data provided in the Smart Home Appliances Market report?
While the report offers comprehensive insights, it's advisable to review the specific contents or supplementary materials provided to ascertain if additional resources or data are available.
14. How can I stay updated on further developments or reports in the Smart Home Appliances Market?
To stay informed about further developments, trends, and reports in the Smart Home Appliances Market, consider subscribing to industry newsletters, following relevant companies and organizations, or regularly checking reputable industry news sources and publications.
Methodology
Step 1 - Identification of Relevant Samples Size from Population Database


Step 2 - Approaches for Defining Global Market Size (Value, Volume* & Price*)

Note*: In applicable scenarios
Step 3 - Data Sources
Primary Research
- Web Analytics
- Survey Reports
- Research Institute
- Latest Research Reports
- Opinion Leaders
Secondary Research
- Annual Reports
- White Paper
- Latest Press Release
- Industry Association
- Paid Database
- Investor Presentations

Step 4 - Data Triangulation
Involves using different sources of information in order to increase the validity of a study
These sources are likely to be stakeholders in a program - participants, other researchers, program staff, other community members, and so on.
Then we put all data in single framework & apply various statistical tools to find out the dynamic on the market.
During the analysis stage, feedback from the stakeholder groups would be compared to determine areas of agreement as well as areas of divergence
