

Key Insights
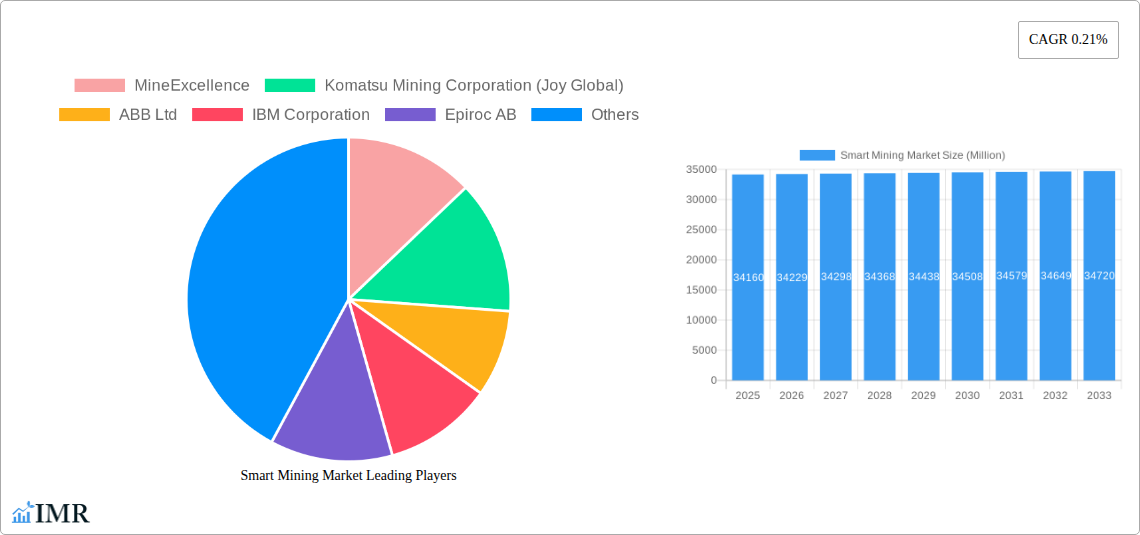
The global smart mining market, valued at $34.16 billion in 2025, is projected to experience steady growth, driven by increasing demand for enhanced efficiency, safety, and sustainability in mining operations. A Compound Annual Growth Rate (CAGR) of 0.21% from 2025 to 2033 indicates a relatively stable, albeit modest, expansion. This moderate growth reflects the inherent cyclical nature of the mining industry and the significant capital investment required for implementing smart mining technologies. Key drivers include the rising adoption of automation and data analytics to optimize resource extraction, improve productivity, and reduce operational costs. The increasing need for improved safety measures, particularly in underground mining, further fuels market expansion. Growth is also being propelled by the rising adoption of IoT sensors and advanced analytical tools to predict equipment failures and minimize downtime. However, high initial investment costs, the complexity of integrating new technologies into existing infrastructure, and the need for skilled workforce training remain significant restraints.
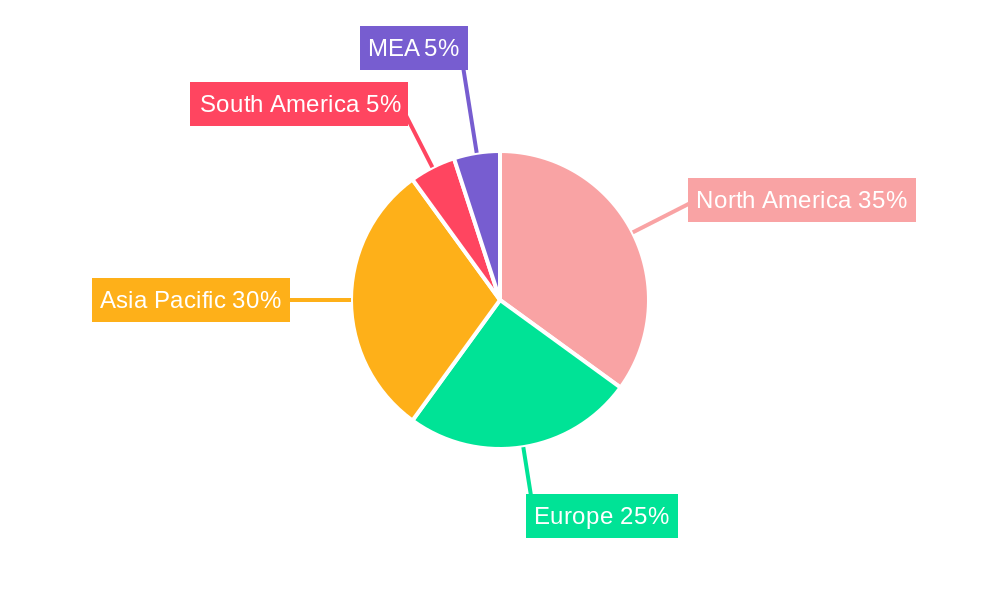
Segment-wise, smart control systems and data management and analytics software are anticipated to hold substantial market share due to their critical role in optimizing resource allocation and decision-making. The underground mining segment is projected to witness faster growth compared to surface mining due to the higher complexity and safety concerns associated with underground operations. Geographically, North America and Asia Pacific are expected to lead the market, driven by technological advancements, robust mining infrastructure, and substantial investments in smart mining initiatives. Europe is also expected to show considerable growth, owing to a strong focus on sustainable mining practices and regulatory compliance. The service type segment is expected to see strong growth in consulting and system integration services, as mining companies seek expert guidance for successful implementation and integration of smart mining solutions. The presence of established players like Komatsu, ABB, IBM, and Rockwell Automation, alongside innovative technology providers, indicates a competitive landscape characterized by both established vendors and agile startups.
Smart Mining Market: A Comprehensive Market Report (2019-2033)
This comprehensive report provides a detailed analysis of the Smart Mining Market, encompassing market dynamics, growth trends, regional insights, product landscape, key players, and future outlook. With a study period spanning 2019-2033, a base year of 2025, and a forecast period of 2025-2033, this report offers invaluable insights for industry professionals, investors, and strategic decision-makers. The total market size is projected to reach xx Million by 2033.
Smart Mining Market Dynamics & Structure
The Smart Mining market is experiencing significant growth driven by technological advancements, increasing demand for improved safety and efficiency, and stringent environmental regulations. Market concentration is moderate, with several key players holding substantial market share, but a number of smaller, specialized firms are also emerging. Technological innovation, particularly in areas such as AI, IoT, and cloud computing, is a major driver. Regulatory frameworks regarding data privacy, safety, and environmental compliance significantly influence market dynamics. Competitive product substitutes, such as traditional mining methods, face pressure from the increasing efficiency and cost-effectiveness of smart mining solutions. The market exhibits robust M&A activity, with larger firms acquiring smaller technology companies to expand their product portfolios and capabilities.
- Market Concentration: Moderate, with top 5 players holding approximately xx% market share (2024).
- Technological Innovation Drivers: AI, IoT, cloud computing, automation, data analytics.
- Regulatory Frameworks: Stringent safety and environmental regulations driving adoption.
- Competitive Substitutes: Traditional mining methods facing increasing competition.
- End-User Demographics: Primarily large-scale mining operations, expanding to smaller players.
- M&A Trends: Significant activity, with xx major deals recorded between 2019-2024.
Smart Mining Market Growth Trends & Insights
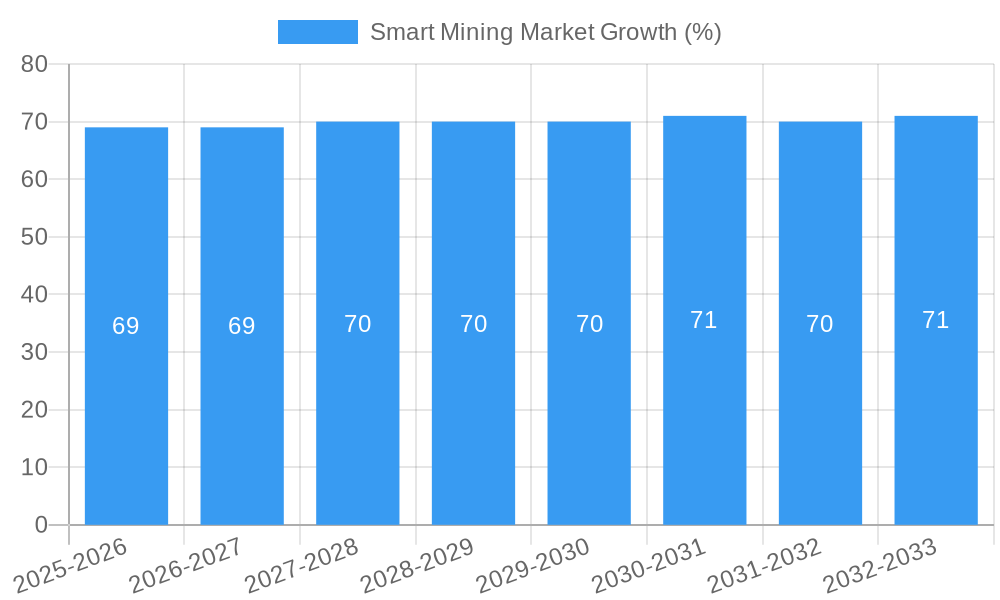
The Smart Mining market is characterized by robust growth, driven by a confluence of factors. Market size has shown a significant CAGR of xx% during the historical period (2019-2024), projected to reach xx Million by 2025 and xx Million by 2033. Adoption rates are increasing across various mining types and regions, particularly in developed economies with advanced infrastructure. Technological disruptions, such as the integration of AI and machine learning, are significantly enhancing operational efficiency and safety. Consumer behavior is shifting towards the adoption of data-driven decision-making and proactive maintenance strategies. The market penetration of smart mining solutions is expected to reach xx% by 2033.
Dominant Regions, Countries, or Segments in Smart Mining Market
North America currently holds the largest market share in the smart mining sector, driven by early adoption of advanced technologies and a strong focus on operational efficiency. Within the segments, Smart Control Systems and Data Management and Analytics Software are the fastest-growing areas, fueled by demand for enhanced productivity and decision-making capabilities. Underground mining presents a significant opportunity due to its inherent complexities and the potential for improved safety and efficiency gains through smart mining solutions.
- Leading Region: North America (xx% market share in 2024).
- Fastest-Growing Segment (By Solution): Data Management and Analytics Software.
- High-Growth Segment (By Service Type): System Integration.
- Key Driver (North America): Strong focus on operational efficiency and technological advancements.
- Key Driver (Underground Mining): Demand for improved safety and reduced operational risks.
Smart Mining Market Product Landscape
Smart mining solutions encompass a range of innovative products, including advanced sensors, real-time monitoring systems, predictive maintenance software, and autonomous vehicles. These solutions offer enhanced safety features, improved operational efficiency, optimized resource utilization, and reduced environmental impact. Unique selling propositions often involve improved precision, reduced downtime, and enhanced data-driven decision-making. Continuous technological advancements are driving the development of more sophisticated and integrated systems.
Key Drivers, Barriers & Challenges in Smart Mining Market
Key Drivers:
- Technological advancements (AI, IoT, cloud computing).
- Increasing demand for enhanced safety and efficiency.
- Stringent environmental regulations.
- Growing investment in automation and digitization.
Challenges & Restraints:
- High initial investment costs associated with implementing smart mining solutions.
- Lack of skilled workforce capable of operating and maintaining these systems.
- Concerns about data security and privacy.
- Integration challenges with existing legacy systems. This leads to approximately xx% of projects experiencing delays due to integration difficulties.
Emerging Opportunities in Smart Mining Market
Emerging opportunities lie in untapped markets, particularly in developing economies with growing mining sectors. Innovative applications of AI and machine learning for predictive maintenance and autonomous operations represent significant growth avenues. Evolving consumer preferences toward sustainable and environmentally responsible mining practices are driving the demand for smart mining solutions that minimize environmental impact.
Growth Accelerators in the Smart Mining Market Industry
Strategic partnerships between technology providers and mining companies are accelerating market growth. Technological breakthroughs in areas like AI and sensor technology are expanding the capabilities and applications of smart mining solutions. Market expansion strategies focusing on emerging economies and niche applications are further driving market expansion.
Key Players Shaping the Smart Mining Market Market
- MineExcellence
- Komatsu Mining Corporation (Joy Global)
- ABB Ltd
- IBM Corporation
- Epiroc AB
- Cisco Systems Inc
- Wenco International Mining Systems Ltd
- Metso Outotec OYJ
- Rockwell Automation Inc
- Trimble Inc
- Symboticware Inc
- SAP SE
Notable Milestones in Smart Mining Market Sector
- June 2022: Metso Outotec collaborated with Dynamox on a condition monitoring platform, enhancing its digital solutions offering.
- May 2022: Epiroc launched the Boomer S10 S, boosting mine development productivity by up to 25%.
In-Depth Smart Mining Market Market Outlook
The future of the smart mining market is bright, driven by continuous technological advancements and the increasing need for enhanced efficiency and sustainability. Strategic partnerships, targeted investments in R&D, and expansion into new markets will play a key role in shaping future growth. The market is poised for substantial expansion, offering significant opportunities for both established players and emerging companies.
Smart Mining Market Segmentation
-
1. Solution
- 1.1. Smart Control System
- 1.2. Smart Asset Management
- 1.3. Safety and Security System
- 1.4. Data Management and Analytics Software
- 1.5. Monitoring System
- 1.6. Other Solutions
-
2. Service Type
- 2.1. System Integration
- 2.2. Consulting Service
- 2.3. Engineering and Maintenance
-
3. Mining Type
- 3.1. Underground Mining
- 3.2. Surface Mining
Smart Mining Market Segmentation By Geography
- 1. North America
- 2. Europe
- 3. Asia Pacific
- 4. Latin America
- 5. Middle East and Africa
Smart Mining Market REPORT HIGHLIGHTS
| Aspects | Details |
|---|---|
| Study Period | 2019-2033 |
| Base Year | 2024 |
| Estimated Year | 2025 |
| Forecast Period | 2025-2033 |
| Historical Period | 2019-2024 |
| Growth Rate | CAGR of 0.21% from 2019-2033 |
| Segmentation |
|
Table of Contents
- 1. Introduction
- 1.1. Research Scope
- 1.2. Market Segmentation
- 1.3. Research Methodology
- 1.4. Definitions and Assumptions
- 2. Executive Summary
- 2.1. Introduction
- 3. Market Dynamics
- 3.1. Introduction
- 3.2. Market Drivers
- 3.2.1. Rising Adoption of Wireless Monitoring and Centralized Solutions among Several Large Mining Installations; Technological Advancements and Convergence of Various Digital Transformation Practices
- 3.3. Market Restrains
- 3.3.1. Operational and Cost Challenges Remain a Concern in Emerging Regions; Workers Safety and Health
- 3.4. Market Trends
- 3.4.1. Data Management and Analytics Software is Expected to Show Highest Growth
- 4. Market Factor Analysis
- 4.1. Porters Five Forces
- 4.2. Supply/Value Chain
- 4.3. PESTEL analysis
- 4.4. Market Entropy
- 4.5. Patent/Trademark Analysis
- 5. Global Smart Mining Market Analysis, Insights and Forecast, 2019-2031
- 5.1. Market Analysis, Insights and Forecast - by Solution
- 5.1.1. Smart Control System
- 5.1.2. Smart Asset Management
- 5.1.3. Safety and Security System
- 5.1.4. Data Management and Analytics Software
- 5.1.5. Monitoring System
- 5.1.6. Other Solutions
- 5.2. Market Analysis, Insights and Forecast - by Service Type
- 5.2.1. System Integration
- 5.2.2. Consulting Service
- 5.2.3. Engineering and Maintenance
- 5.3. Market Analysis, Insights and Forecast - by Mining Type
- 5.3.1. Underground Mining
- 5.3.2. Surface Mining
- 5.4. Market Analysis, Insights and Forecast - by Region
- 5.4.1. North America
- 5.4.2. Europe
- 5.4.3. Asia Pacific
- 5.4.4. Latin America
- 5.4.5. Middle East and Africa
- 5.1. Market Analysis, Insights and Forecast - by Solution
- 6. North America Smart Mining Market Analysis, Insights and Forecast, 2019-2031
- 6.1. Market Analysis, Insights and Forecast - by Solution
- 6.1.1. Smart Control System
- 6.1.2. Smart Asset Management
- 6.1.3. Safety and Security System
- 6.1.4. Data Management and Analytics Software
- 6.1.5. Monitoring System
- 6.1.6. Other Solutions
- 6.2. Market Analysis, Insights and Forecast - by Service Type
- 6.2.1. System Integration
- 6.2.2. Consulting Service
- 6.2.3. Engineering and Maintenance
- 6.3. Market Analysis, Insights and Forecast - by Mining Type
- 6.3.1. Underground Mining
- 6.3.2. Surface Mining
- 6.1. Market Analysis, Insights and Forecast - by Solution
- 7. Europe Smart Mining Market Analysis, Insights and Forecast, 2019-2031
- 7.1. Market Analysis, Insights and Forecast - by Solution
- 7.1.1. Smart Control System
- 7.1.2. Smart Asset Management
- 7.1.3. Safety and Security System
- 7.1.4. Data Management and Analytics Software
- 7.1.5. Monitoring System
- 7.1.6. Other Solutions
- 7.2. Market Analysis, Insights and Forecast - by Service Type
- 7.2.1. System Integration
- 7.2.2. Consulting Service
- 7.2.3. Engineering and Maintenance
- 7.3. Market Analysis, Insights and Forecast - by Mining Type
- 7.3.1. Underground Mining
- 7.3.2. Surface Mining
- 7.1. Market Analysis, Insights and Forecast - by Solution
- 8. Asia Pacific Smart Mining Market Analysis, Insights and Forecast, 2019-2031
- 8.1. Market Analysis, Insights and Forecast - by Solution
- 8.1.1. Smart Control System
- 8.1.2. Smart Asset Management
- 8.1.3. Safety and Security System
- 8.1.4. Data Management and Analytics Software
- 8.1.5. Monitoring System
- 8.1.6. Other Solutions
- 8.2. Market Analysis, Insights and Forecast - by Service Type
- 8.2.1. System Integration
- 8.2.2. Consulting Service
- 8.2.3. Engineering and Maintenance
- 8.3. Market Analysis, Insights and Forecast - by Mining Type
- 8.3.1. Underground Mining
- 8.3.2. Surface Mining
- 8.1. Market Analysis, Insights and Forecast - by Solution
- 9. Latin America Smart Mining Market Analysis, Insights and Forecast, 2019-2031
- 9.1. Market Analysis, Insights and Forecast - by Solution
- 9.1.1. Smart Control System
- 9.1.2. Smart Asset Management
- 9.1.3. Safety and Security System
- 9.1.4. Data Management and Analytics Software
- 9.1.5. Monitoring System
- 9.1.6. Other Solutions
- 9.2. Market Analysis, Insights and Forecast - by Service Type
- 9.2.1. System Integration
- 9.2.2. Consulting Service
- 9.2.3. Engineering and Maintenance
- 9.3. Market Analysis, Insights and Forecast - by Mining Type
- 9.3.1. Underground Mining
- 9.3.2. Surface Mining
- 9.1. Market Analysis, Insights and Forecast - by Solution
- 10. Middle East and Africa Smart Mining Market Analysis, Insights and Forecast, 2019-2031
- 10.1. Market Analysis, Insights and Forecast - by Solution
- 10.1.1. Smart Control System
- 10.1.2. Smart Asset Management
- 10.1.3. Safety and Security System
- 10.1.4. Data Management and Analytics Software
- 10.1.5. Monitoring System
- 10.1.6. Other Solutions
- 10.2. Market Analysis, Insights and Forecast - by Service Type
- 10.2.1. System Integration
- 10.2.2. Consulting Service
- 10.2.3. Engineering and Maintenance
- 10.3. Market Analysis, Insights and Forecast - by Mining Type
- 10.3.1. Underground Mining
- 10.3.2. Surface Mining
- 10.1. Market Analysis, Insights and Forecast - by Solution
- 11. North America Smart Mining Market Analysis, Insights and Forecast, 2019-2031
- 11.1. Market Analysis, Insights and Forecast - By Country/Sub-region
- 11.1.1 United States
- 11.1.2 Canada
- 11.1.3 Mexico
- 12. Europe Smart Mining Market Analysis, Insights and Forecast, 2019-2031
- 12.1. Market Analysis, Insights and Forecast - By Country/Sub-region
- 12.1.1 Germany
- 12.1.2 United Kingdom
- 12.1.3 France
- 12.1.4 Spain
- 12.1.5 Italy
- 12.1.6 Spain
- 12.1.7 Belgium
- 12.1.8 Netherland
- 12.1.9 Nordics
- 12.1.10 Rest of Europe
- 13. Asia Pacific Smart Mining Market Analysis, Insights and Forecast, 2019-2031
- 13.1. Market Analysis, Insights and Forecast - By Country/Sub-region
- 13.1.1 China
- 13.1.2 Japan
- 13.1.3 India
- 13.1.4 South Korea
- 13.1.5 Southeast Asia
- 13.1.6 Australia
- 13.1.7 Indonesia
- 13.1.8 Phillipes
- 13.1.9 Singapore
- 13.1.10 Thailandc
- 13.1.11 Rest of Asia Pacific
- 14. South America Smart Mining Market Analysis, Insights and Forecast, 2019-2031
- 14.1. Market Analysis, Insights and Forecast - By Country/Sub-region
- 14.1.1 Brazil
- 14.1.2 Argentina
- 14.1.3 Peru
- 14.1.4 Chile
- 14.1.5 Colombia
- 14.1.6 Ecuador
- 14.1.7 Venezuela
- 14.1.8 Rest of South America
- 15. North America Smart Mining Market Analysis, Insights and Forecast, 2019-2031
- 15.1. Market Analysis, Insights and Forecast - By Country/Sub-region
- 15.1.1 United States
- 15.1.2 Canada
- 15.1.3 Mexico
- 16. MEA Smart Mining Market Analysis, Insights and Forecast, 2019-2031
- 16.1. Market Analysis, Insights and Forecast - By Country/Sub-region
- 16.1.1 United Arab Emirates
- 16.1.2 Saudi Arabia
- 16.1.3 South Africa
- 16.1.4 Rest of Middle East and Africa
- 17. Competitive Analysis
- 17.1. Global Market Share Analysis 2024
- 17.2. Company Profiles
- 17.2.1 MineExcellence
- 17.2.1.1. Overview
- 17.2.1.2. Products
- 17.2.1.3. SWOT Analysis
- 17.2.1.4. Recent Developments
- 17.2.1.5. Financials (Based on Availability)
- 17.2.2 Komatsu Mining Corporation (Joy Global)
- 17.2.2.1. Overview
- 17.2.2.2. Products
- 17.2.2.3. SWOT Analysis
- 17.2.2.4. Recent Developments
- 17.2.2.5. Financials (Based on Availability)
- 17.2.3 ABB Ltd
- 17.2.3.1. Overview
- 17.2.3.2. Products
- 17.2.3.3. SWOT Analysis
- 17.2.3.4. Recent Developments
- 17.2.3.5. Financials (Based on Availability)
- 17.2.4 IBM Corporation
- 17.2.4.1. Overview
- 17.2.4.2. Products
- 17.2.4.3. SWOT Analysis
- 17.2.4.4. Recent Developments
- 17.2.4.5. Financials (Based on Availability)
- 17.2.5 Epiroc AB
- 17.2.5.1. Overview
- 17.2.5.2. Products
- 17.2.5.3. SWOT Analysis
- 17.2.5.4. Recent Developments
- 17.2.5.5. Financials (Based on Availability)
- 17.2.6 Cisco Systems Inc
- 17.2.6.1. Overview
- 17.2.6.2. Products
- 17.2.6.3. SWOT Analysis
- 17.2.6.4. Recent Developments
- 17.2.6.5. Financials (Based on Availability)
- 17.2.7 Wenco International Mining Systems Ltd
- 17.2.7.1. Overview
- 17.2.7.2. Products
- 17.2.7.3. SWOT Analysis
- 17.2.7.4. Recent Developments
- 17.2.7.5. Financials (Based on Availability)
- 17.2.8 Metso Outotec OYJ
- 17.2.8.1. Overview
- 17.2.8.2. Products
- 17.2.8.3. SWOT Analysis
- 17.2.8.4. Recent Developments
- 17.2.8.5. Financials (Based on Availability)
- 17.2.9 Rockwell Automation Inc
- 17.2.9.1. Overview
- 17.2.9.2. Products
- 17.2.9.3. SWOT Analysis
- 17.2.9.4. Recent Developments
- 17.2.9.5. Financials (Based on Availability)
- 17.2.10 Trimble Inc
- 17.2.10.1. Overview
- 17.2.10.2. Products
- 17.2.10.3. SWOT Analysis
- 17.2.10.4. Recent Developments
- 17.2.10.5. Financials (Based on Availability)
- 17.2.11 Symboticware Inc
- 17.2.11.1. Overview
- 17.2.11.2. Products
- 17.2.11.3. SWOT Analysis
- 17.2.11.4. Recent Developments
- 17.2.11.5. Financials (Based on Availability)
- 17.2.12 SAP SE
- 17.2.12.1. Overview
- 17.2.12.2. Products
- 17.2.12.3. SWOT Analysis
- 17.2.12.4. Recent Developments
- 17.2.12.5. Financials (Based on Availability)
- 17.2.1 MineExcellence
List of Figures
- Figure 1: Global Smart Mining Market Revenue Breakdown (Million, %) by Region 2024 & 2032
- Figure 2: North America Smart Mining Market Revenue (Million), by Country 2024 & 2032
- Figure 3: North America Smart Mining Market Revenue Share (%), by Country 2024 & 2032
- Figure 4: Europe Smart Mining Market Revenue (Million), by Country 2024 & 2032
- Figure 5: Europe Smart Mining Market Revenue Share (%), by Country 2024 & 2032
- Figure 6: Asia Pacific Smart Mining Market Revenue (Million), by Country 2024 & 2032
- Figure 7: Asia Pacific Smart Mining Market Revenue Share (%), by Country 2024 & 2032
- Figure 8: South America Smart Mining Market Revenue (Million), by Country 2024 & 2032
- Figure 9: South America Smart Mining Market Revenue Share (%), by Country 2024 & 2032
- Figure 10: North America Smart Mining Market Revenue (Million), by Country 2024 & 2032
- Figure 11: North America Smart Mining Market Revenue Share (%), by Country 2024 & 2032
- Figure 12: MEA Smart Mining Market Revenue (Million), by Country 2024 & 2032
- Figure 13: MEA Smart Mining Market Revenue Share (%), by Country 2024 & 2032
- Figure 14: North America Smart Mining Market Revenue (Million), by Solution 2024 & 2032
- Figure 15: North America Smart Mining Market Revenue Share (%), by Solution 2024 & 2032
- Figure 16: North America Smart Mining Market Revenue (Million), by Service Type 2024 & 2032
- Figure 17: North America Smart Mining Market Revenue Share (%), by Service Type 2024 & 2032
- Figure 18: North America Smart Mining Market Revenue (Million), by Mining Type 2024 & 2032
- Figure 19: North America Smart Mining Market Revenue Share (%), by Mining Type 2024 & 2032
- Figure 20: North America Smart Mining Market Revenue (Million), by Country 2024 & 2032
- Figure 21: North America Smart Mining Market Revenue Share (%), by Country 2024 & 2032
- Figure 22: Europe Smart Mining Market Revenue (Million), by Solution 2024 & 2032
- Figure 23: Europe Smart Mining Market Revenue Share (%), by Solution 2024 & 2032
- Figure 24: Europe Smart Mining Market Revenue (Million), by Service Type 2024 & 2032
- Figure 25: Europe Smart Mining Market Revenue Share (%), by Service Type 2024 & 2032
- Figure 26: Europe Smart Mining Market Revenue (Million), by Mining Type 2024 & 2032
- Figure 27: Europe Smart Mining Market Revenue Share (%), by Mining Type 2024 & 2032
- Figure 28: Europe Smart Mining Market Revenue (Million), by Country 2024 & 2032
- Figure 29: Europe Smart Mining Market Revenue Share (%), by Country 2024 & 2032
- Figure 30: Asia Pacific Smart Mining Market Revenue (Million), by Solution 2024 & 2032
- Figure 31: Asia Pacific Smart Mining Market Revenue Share (%), by Solution 2024 & 2032
- Figure 32: Asia Pacific Smart Mining Market Revenue (Million), by Service Type 2024 & 2032
- Figure 33: Asia Pacific Smart Mining Market Revenue Share (%), by Service Type 2024 & 2032
- Figure 34: Asia Pacific Smart Mining Market Revenue (Million), by Mining Type 2024 & 2032
- Figure 35: Asia Pacific Smart Mining Market Revenue Share (%), by Mining Type 2024 & 2032
- Figure 36: Asia Pacific Smart Mining Market Revenue (Million), by Country 2024 & 2032
- Figure 37: Asia Pacific Smart Mining Market Revenue Share (%), by Country 2024 & 2032
- Figure 38: Latin America Smart Mining Market Revenue (Million), by Solution 2024 & 2032
- Figure 39: Latin America Smart Mining Market Revenue Share (%), by Solution 2024 & 2032
- Figure 40: Latin America Smart Mining Market Revenue (Million), by Service Type 2024 & 2032
- Figure 41: Latin America Smart Mining Market Revenue Share (%), by Service Type 2024 & 2032
- Figure 42: Latin America Smart Mining Market Revenue (Million), by Mining Type 2024 & 2032
- Figure 43: Latin America Smart Mining Market Revenue Share (%), by Mining Type 2024 & 2032
- Figure 44: Latin America Smart Mining Market Revenue (Million), by Country 2024 & 2032
- Figure 45: Latin America Smart Mining Market Revenue Share (%), by Country 2024 & 2032
- Figure 46: Middle East and Africa Smart Mining Market Revenue (Million), by Solution 2024 & 2032
- Figure 47: Middle East and Africa Smart Mining Market Revenue Share (%), by Solution 2024 & 2032
- Figure 48: Middle East and Africa Smart Mining Market Revenue (Million), by Service Type 2024 & 2032
- Figure 49: Middle East and Africa Smart Mining Market Revenue Share (%), by Service Type 2024 & 2032
- Figure 50: Middle East and Africa Smart Mining Market Revenue (Million), by Mining Type 2024 & 2032
- Figure 51: Middle East and Africa Smart Mining Market Revenue Share (%), by Mining Type 2024 & 2032
- Figure 52: Middle East and Africa Smart Mining Market Revenue (Million), by Country 2024 & 2032
- Figure 53: Middle East and Africa Smart Mining Market Revenue Share (%), by Country 2024 & 2032
List of Tables
- Table 1: Global Smart Mining Market Revenue Million Forecast, by Region 2019 & 2032
- Table 2: Global Smart Mining Market Revenue Million Forecast, by Solution 2019 & 2032
- Table 3: Global Smart Mining Market Revenue Million Forecast, by Service Type 2019 & 2032
- Table 4: Global Smart Mining Market Revenue Million Forecast, by Mining Type 2019 & 2032
- Table 5: Global Smart Mining Market Revenue Million Forecast, by Region 2019 & 2032
- Table 6: Global Smart Mining Market Revenue Million Forecast, by Country 2019 & 2032
- Table 7: United States Smart Mining Market Revenue (Million) Forecast, by Application 2019 & 2032
- Table 8: Canada Smart Mining Market Revenue (Million) Forecast, by Application 2019 & 2032
- Table 9: Mexico Smart Mining Market Revenue (Million) Forecast, by Application 2019 & 2032
- Table 10: Global Smart Mining Market Revenue Million Forecast, by Country 2019 & 2032
- Table 11: Germany Smart Mining Market Revenue (Million) Forecast, by Application 2019 & 2032
- Table 12: United Kingdom Smart Mining Market Revenue (Million) Forecast, by Application 2019 & 2032
- Table 13: France Smart Mining Market Revenue (Million) Forecast, by Application 2019 & 2032
- Table 14: Spain Smart Mining Market Revenue (Million) Forecast, by Application 2019 & 2032
- Table 15: Italy Smart Mining Market Revenue (Million) Forecast, by Application 2019 & 2032
- Table 16: Spain Smart Mining Market Revenue (Million) Forecast, by Application 2019 & 2032
- Table 17: Belgium Smart Mining Market Revenue (Million) Forecast, by Application 2019 & 2032
- Table 18: Netherland Smart Mining Market Revenue (Million) Forecast, by Application 2019 & 2032
- Table 19: Nordics Smart Mining Market Revenue (Million) Forecast, by Application 2019 & 2032
- Table 20: Rest of Europe Smart Mining Market Revenue (Million) Forecast, by Application 2019 & 2032
- Table 21: Global Smart Mining Market Revenue Million Forecast, by Country 2019 & 2032
- Table 22: China Smart Mining Market Revenue (Million) Forecast, by Application 2019 & 2032
- Table 23: Japan Smart Mining Market Revenue (Million) Forecast, by Application 2019 & 2032
- Table 24: India Smart Mining Market Revenue (Million) Forecast, by Application 2019 & 2032
- Table 25: South Korea Smart Mining Market Revenue (Million) Forecast, by Application 2019 & 2032
- Table 26: Southeast Asia Smart Mining Market Revenue (Million) Forecast, by Application 2019 & 2032
- Table 27: Australia Smart Mining Market Revenue (Million) Forecast, by Application 2019 & 2032
- Table 28: Indonesia Smart Mining Market Revenue (Million) Forecast, by Application 2019 & 2032
- Table 29: Phillipes Smart Mining Market Revenue (Million) Forecast, by Application 2019 & 2032
- Table 30: Singapore Smart Mining Market Revenue (Million) Forecast, by Application 2019 & 2032
- Table 31: Thailandc Smart Mining Market Revenue (Million) Forecast, by Application 2019 & 2032
- Table 32: Rest of Asia Pacific Smart Mining Market Revenue (Million) Forecast, by Application 2019 & 2032
- Table 33: Global Smart Mining Market Revenue Million Forecast, by Country 2019 & 2032
- Table 34: Brazil Smart Mining Market Revenue (Million) Forecast, by Application 2019 & 2032
- Table 35: Argentina Smart Mining Market Revenue (Million) Forecast, by Application 2019 & 2032
- Table 36: Peru Smart Mining Market Revenue (Million) Forecast, by Application 2019 & 2032
- Table 37: Chile Smart Mining Market Revenue (Million) Forecast, by Application 2019 & 2032
- Table 38: Colombia Smart Mining Market Revenue (Million) Forecast, by Application 2019 & 2032
- Table 39: Ecuador Smart Mining Market Revenue (Million) Forecast, by Application 2019 & 2032
- Table 40: Venezuela Smart Mining Market Revenue (Million) Forecast, by Application 2019 & 2032
- Table 41: Rest of South America Smart Mining Market Revenue (Million) Forecast, by Application 2019 & 2032
- Table 42: Global Smart Mining Market Revenue Million Forecast, by Country 2019 & 2032
- Table 43: United States Smart Mining Market Revenue (Million) Forecast, by Application 2019 & 2032
- Table 44: Canada Smart Mining Market Revenue (Million) Forecast, by Application 2019 & 2032
- Table 45: Mexico Smart Mining Market Revenue (Million) Forecast, by Application 2019 & 2032
- Table 46: Global Smart Mining Market Revenue Million Forecast, by Country 2019 & 2032
- Table 47: United Arab Emirates Smart Mining Market Revenue (Million) Forecast, by Application 2019 & 2032
- Table 48: Saudi Arabia Smart Mining Market Revenue (Million) Forecast, by Application 2019 & 2032
- Table 49: South Africa Smart Mining Market Revenue (Million) Forecast, by Application 2019 & 2032
- Table 50: Rest of Middle East and Africa Smart Mining Market Revenue (Million) Forecast, by Application 2019 & 2032
- Table 51: Global Smart Mining Market Revenue Million Forecast, by Solution 2019 & 2032
- Table 52: Global Smart Mining Market Revenue Million Forecast, by Service Type 2019 & 2032
- Table 53: Global Smart Mining Market Revenue Million Forecast, by Mining Type 2019 & 2032
- Table 54: Global Smart Mining Market Revenue Million Forecast, by Country 2019 & 2032
- Table 55: Global Smart Mining Market Revenue Million Forecast, by Solution 2019 & 2032
- Table 56: Global Smart Mining Market Revenue Million Forecast, by Service Type 2019 & 2032
- Table 57: Global Smart Mining Market Revenue Million Forecast, by Mining Type 2019 & 2032
- Table 58: Global Smart Mining Market Revenue Million Forecast, by Country 2019 & 2032
- Table 59: Global Smart Mining Market Revenue Million Forecast, by Solution 2019 & 2032
- Table 60: Global Smart Mining Market Revenue Million Forecast, by Service Type 2019 & 2032
- Table 61: Global Smart Mining Market Revenue Million Forecast, by Mining Type 2019 & 2032
- Table 62: Global Smart Mining Market Revenue Million Forecast, by Country 2019 & 2032
- Table 63: Global Smart Mining Market Revenue Million Forecast, by Solution 2019 & 2032
- Table 64: Global Smart Mining Market Revenue Million Forecast, by Service Type 2019 & 2032
- Table 65: Global Smart Mining Market Revenue Million Forecast, by Mining Type 2019 & 2032
- Table 66: Global Smart Mining Market Revenue Million Forecast, by Country 2019 & 2032
- Table 67: Global Smart Mining Market Revenue Million Forecast, by Solution 2019 & 2032
- Table 68: Global Smart Mining Market Revenue Million Forecast, by Service Type 2019 & 2032
- Table 69: Global Smart Mining Market Revenue Million Forecast, by Mining Type 2019 & 2032
- Table 70: Global Smart Mining Market Revenue Million Forecast, by Country 2019 & 2032
Frequently Asked Questions
1. What is the projected Compound Annual Growth Rate (CAGR) of the Smart Mining Market?
The projected CAGR is approximately 0.21%.
2. Which companies are prominent players in the Smart Mining Market?
Key companies in the market include MineExcellence, Komatsu Mining Corporation (Joy Global), ABB Ltd, IBM Corporation, Epiroc AB, Cisco Systems Inc, Wenco International Mining Systems Ltd, Metso Outotec OYJ, Rockwell Automation Inc, Trimble Inc, Symboticware Inc, SAP SE.
3. What are the main segments of the Smart Mining Market?
The market segments include Solution, Service Type, Mining Type.
4. Can you provide details about the market size?
The market size is estimated to be USD 34.16 Million as of 2022.
5. What are some drivers contributing to market growth?
Rising Adoption of Wireless Monitoring and Centralized Solutions among Several Large Mining Installations; Technological Advancements and Convergence of Various Digital Transformation Practices.
6. What are the notable trends driving market growth?
Data Management and Analytics Software is Expected to Show Highest Growth.
7. Are there any restraints impacting market growth?
Operational and Cost Challenges Remain a Concern in Emerging Regions; Workers Safety and Health.
8. Can you provide examples of recent developments in the market?
June 2022 - Metso Outotec collaborated with Dynamox on using Dynamox's condition monitoring platform in mining and aggregating processes. Metso Outotec is offering the solution to the company's installed equipment base. Dynamox is an addition to Metso Outotec's partner ecosystem and helps develop and provide easy-to-use and sustainable digital solutions to customers. The company is further upgrading in mining using AI and analytics solutions.
9. What pricing options are available for accessing the report?
Pricing options include single-user, multi-user, and enterprise licenses priced at USD 4750, USD 5250, and USD 8750 respectively.
10. Is the market size provided in terms of value or volume?
The market size is provided in terms of value, measured in Million.
11. Are there any specific market keywords associated with the report?
Yes, the market keyword associated with the report is "Smart Mining Market," which aids in identifying and referencing the specific market segment covered.
12. How do I determine which pricing option suits my needs best?
The pricing options vary based on user requirements and access needs. Individual users may opt for single-user licenses, while businesses requiring broader access may choose multi-user or enterprise licenses for cost-effective access to the report.
13. Are there any additional resources or data provided in the Smart Mining Market report?
While the report offers comprehensive insights, it's advisable to review the specific contents or supplementary materials provided to ascertain if additional resources or data are available.
14. How can I stay updated on further developments or reports in the Smart Mining Market?
To stay informed about further developments, trends, and reports in the Smart Mining Market, consider subscribing to industry newsletters, following relevant companies and organizations, or regularly checking reputable industry news sources and publications.
Methodology
Step 1 - Identification of Relevant Samples Size from Population Database


Step 2 - Approaches for Defining Global Market Size (Value, Volume* & Price*)

Note*: In applicable scenarios
Step 3 - Data Sources
Primary Research
- Web Analytics
- Survey Reports
- Research Institute
- Latest Research Reports
- Opinion Leaders
Secondary Research
- Annual Reports
- White Paper
- Latest Press Release
- Industry Association
- Paid Database
- Investor Presentations

Step 4 - Data Triangulation
Involves using different sources of information in order to increase the validity of a study
These sources are likely to be stakeholders in a program - participants, other researchers, program staff, other community members, and so on.
Then we put all data in single framework & apply various statistical tools to find out the dynamic on the market.
During the analysis stage, feedback from the stakeholder groups would be compared to determine areas of agreement as well as areas of divergence
