

Key Insights
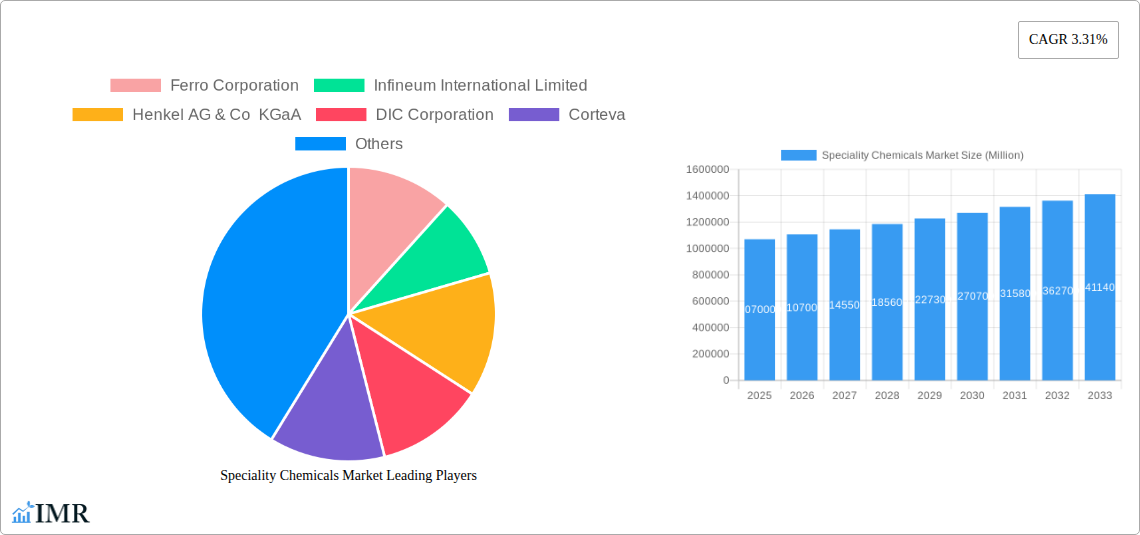
The global specialty chemicals market, valued at $1.07 trillion in 2025, is projected to experience robust growth, driven by increasing demand across diverse end-use industries. A compound annual growth rate (CAGR) of 3.31% from 2025 to 2033 indicates a significant expansion in market size. This growth is fueled by several key factors. Firstly, the burgeoning construction sector, particularly in developing economies, significantly boosts demand for construction chemicals, adhesives, and sealants. Secondly, advancements in technology across various sectors, including electronics and automotive, necessitate specialized chemicals with enhanced performance characteristics. The rising global population and the consequent increase in demand for food, agriculture, and personal care products also contribute to the market's expansion. Finally, stringent environmental regulations are driving the adoption of eco-friendly specialty chemicals, creating new opportunities for innovation and growth. The market is segmented across numerous applications, each presenting unique growth trajectories. Water treatment chemicals, for example, are witnessing increased demand due to growing concerns over water scarcity and pollution. Similarly, the automotive sector's growth fuels demand for lubricant additives and plastic additives. The leading players in this market are strategically investing in research and development, pursuing mergers and acquisitions, and expanding their geographical reach to maintain a competitive edge. Competitive landscape analysis reveals a mix of established multinational corporations and regional players.
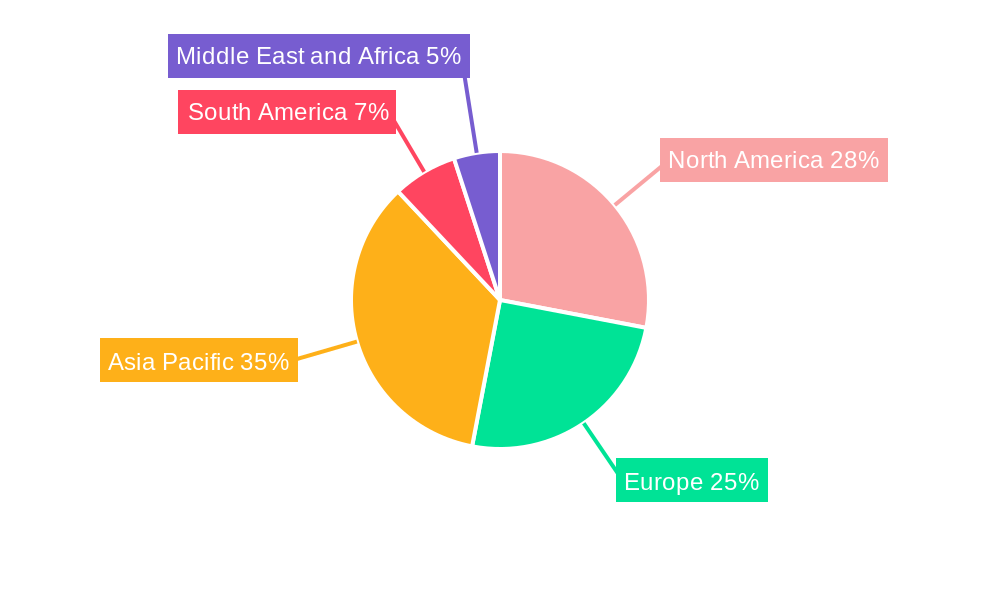
Despite the positive outlook, the specialty chemicals market faces certain challenges. Fluctuations in raw material prices and supply chain disruptions can impact profitability. Furthermore, the industry is subject to stringent environmental regulations, demanding compliance with increasingly strict standards and impacting production costs. However, the industry's continuous innovation in developing sustainable and high-performance chemicals offsets these restraints. The Asia-Pacific region, particularly China and India, is expected to lead market growth due to rapid industrialization and rising disposable incomes. North America and Europe also remain significant markets, driven by technological advancements and robust demand from various industries. Overall, the specialty chemicals market is poised for considerable expansion, fueled by strong growth drivers and favorable long-term market dynamics. Ongoing innovation and strategic adaptation will be crucial for market players to capitalize on these opportunities and navigate the challenges ahead.
Speciality Chemicals Market Report: 2019-2033
This comprehensive report provides a detailed analysis of the Speciality Chemicals market, encompassing market dynamics, growth trends, regional dominance, product landscape, key players, and future outlook. The study period covers 2019-2033, with a base year of 2025 and a forecast period of 2025-2033. The report segments the market by various applications including Water Treatment, Lubricant Additives, Adhesives & Sealants, Plastic Additives, Construction Chemicals, Electronic Chemicals, Dyes, Inks & Pigments, Specialty Polymers, Oilfield Chemicals, Rubber Processing Chemicals, Textile Chemicals, Catalysts, Agrochemicals, Food Additives, Industrial & Institutional Cleaners, Mining Chemicals, Paints & Coatings, and Cosmetic Chemicals. This in-depth analysis is crucial for businesses seeking to understand this lucrative and dynamic market, allowing for strategic decision-making and capitalizing on emerging opportunities.
Speciality Chemicals Market Dynamics & Structure
The global speciality chemicals market is characterized by moderate concentration, with a handful of multinational corporations commanding significant market share. However, the market also features numerous smaller, specialized players catering to niche applications. Technological innovation is a key driver, with continuous advancements in material science and process chemistry leading to the development of high-performance speciality chemicals. Stringent environmental regulations, particularly concerning the use of hazardous substances, present both challenges and opportunities, encouraging the development of eco-friendly alternatives. Competitive product substitutes, such as bio-based chemicals, are also gaining traction. The end-user demographics are diverse, encompassing a wide range of industries, including automotive, construction, electronics, and healthcare. Mergers and acquisitions (M&A) activity is relatively frequent, with larger players seeking to expand their product portfolios and geographical reach.
- Market Concentration: Moderately concentrated, with top 10 players holding approximately xx% market share in 2024.
- Technological Innovation: Significant driver, with a focus on sustainability and enhanced performance.
- Regulatory Framework: Stringent environmental regulations impacting product development and adoption.
- Competitive Substitutes: Bio-based chemicals and other alternatives posing competitive pressure.
- End-User Demographics: Diverse, spanning various industries with varying growth rates.
- M&A Activity: Moderate level of consolidation, with xx major deals recorded in the last five years (2019-2024).
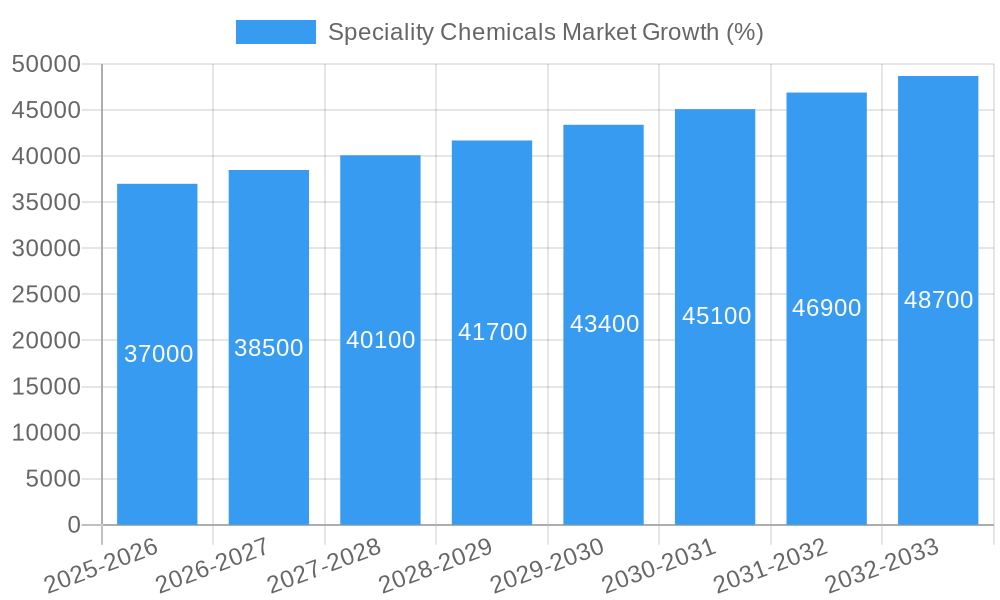
Speciality Chemicals Market Growth Trends & Insights
The global speciality chemicals market exhibited a CAGR of xx% during the historical period (2019-2024), reaching a value of xx Million in 2024. This growth is primarily driven by increasing demand across various end-use sectors, fueled by factors such as rising industrialization, urbanization, and technological advancements. Adoption rates for speciality chemicals vary widely depending on the application and region. Technological disruptions, such as the rise of nanotechnology and additive manufacturing, are creating new opportunities and reshaping market dynamics. Consumer behavior shifts, including increasing demand for sustainable and eco-friendly products, are also influencing market growth. The market is projected to maintain a steady growth trajectory, with a forecasted CAGR of xx% during the forecast period (2025-2033), reaching an estimated value of xx Million by 2033. Market penetration in developing economies is expected to accelerate significantly, contributing considerably to overall market expansion. Specific segments experiencing the fastest growth include xx and xx.
Dominant Regions, Countries, or Segments in Speciality Chemicals Market
North America currently holds the largest market share in the speciality chemicals sector, followed by Europe and Asia Pacific. However, the Asia Pacific region is expected to witness the fastest growth rate during the forecast period, driven by rapid industrialization and infrastructure development in countries like China and India. Within specific segments, the dominant applications and regions are:
- Water Treatment Chemicals: North America dominates due to stringent regulations, while Asia Pacific shows high growth potential. Functionally, the demand for coagulants and flocculants is highest.
- Lubricant Additives: Strong demand from the automotive industry in North America and Europe; product type wise, dispersants and viscosity modifiers dominate.
- Adhesives and Sealants: Construction and automotive sectors drive demand, particularly in North America and Europe; polyurethane-based technologies are prevalent.
- Plastic Additives: Asia Pacific dominates due to high plastic production; demand is highest for plastic types used in packaging.
- Construction Chemicals: High growth in developing economies like India and China; applications like concrete admixtures and waterproofing are major contributors.
- Electronic Chemicals: North America and Asia (especially East Asia) are major markets; applications in semiconductor manufacturing drive growth.
- Dyes, Inks, and Pigments: Asia Pacific dominates due to a large textile industry; demand for azo dyes is high.
- Specialty Polymers: Demand is high in North America and Europe, driven by the automotive and aerospace industries.
- Oilfield Chemicals: The Middle East and North America are key markets due to extensive oil and gas operations; applications focus on drilling and production chemicals.
- Rubber Processing Chemicals: Asia Pacific (especially China) and Europe are dominant regions; focus is on tire production chemicals.
- Textile Chemicals: Asia Pacific (especially India and Bangladesh) leads due to a vast textile industry; finishing agents and dyes are most demanded.
- Catalysts: Demand is high globally in the chemical, petrochemical, and pharmaceutical industries; catalysts for polymerization and oxidation reactions are most used.
- Agrochemicals: High demand in regions with extensive agricultural lands like North America, Europe, and Asia Pacific; herbicides and pesticides are primary types.
- Food Additives: Demand is widespread globally; preservatives and antioxidants dominate.
- Industrial and Institutional Cleaners: Demand is high in developed economies due to hygiene standards; applications are diverse and spread across industries.
- Mining Chemicals: Demand is concentrated in regions with significant mining activity; flocculants and collectors are extensively used.
- Paints and Coatings: High demand in developed and developing economies; automotive and building coatings dominate.
- Cosmetic Chemicals: Demand is high in developed economies due to rising consumer spending on beauty and personal care; various types cater to different needs.
Speciality Chemicals Market Product Landscape
The speciality chemicals market is characterized by continuous product innovation, focusing on improved performance, enhanced sustainability, and cost-effectiveness. New products are developed with advanced functionalities and tailored properties to meet specific application requirements. Key innovations include the development of bio-based alternatives, high-performance polymers, and nanomaterials-based products. These innovations lead to better efficiency, reduced environmental impact, and improved product quality. Companies are focusing on unique selling propositions such as enhanced durability, increased efficacy, and improved safety.
Key Drivers, Barriers & Challenges in Speciality Chemicals Market
Key Drivers:
- Increasing industrialization and urbanization globally drive demand across various sectors.
- Technological advancements are constantly creating new applications and opportunities.
- Stringent environmental regulations incentivize the development of sustainable alternatives.
Key Challenges and Restraints:
- Fluctuations in raw material prices impact production costs and profitability. This effect is currently estimated at xx% variance on profitability yearly.
- Stringent regulatory compliance requirements increase development and manufacturing costs.
- Intense competition from existing players and new entrants necessitates continuous innovation.
Emerging Opportunities in Speciality Chemicals Market
- Growing demand for sustainable and bio-based chemicals presents significant opportunities.
- Expanding applications in emerging technologies, such as 3D printing and nanotechnology, offer new growth avenues.
- Untapped markets in developing economies represent a considerable potential for market expansion.
Growth Accelerators in the Speciality Chemicals Market Industry
Technological breakthroughs, particularly in nanotechnology and bio-based chemistry, are expected to drive significant growth in the speciality chemicals market. Strategic partnerships and collaborations among companies enhance innovation and market penetration. Expansion into emerging markets and diversification into new application areas further contribute to long-term market growth.
Key Players Shaping the Speciality Chemicals Market Market
- Ferro Corporation
- Infineum International Limited
- Henkel AG & Co KGaA
- DIC Corporation
- Corteva
- Clariant
- Ecolab
- GCP Applied Technologies Inc
- Holcim
- Nouryon
Notable Milestones in Speciality Chemicals Market Sector
- December 2022: Clariant AG announced expansion of its care chemicals facility in China, strengthening its position in the pharmaceutical, personal care, home care, and industrial applications markets.
- April 2022: Evonik invested in increasing production capacity for isobutene derivatives by 50%, enhancing its offerings for the pharmaceutical industry (Tertiary Butanol).
In-Depth Speciality Chemicals Market Market Outlook
The speciality chemicals market is poised for substantial growth in the coming years, driven by several factors including increasing industrialization, technological advancements, and the growing demand for sustainable solutions. Strategic partnerships, acquisitions, and product innovations are expected to shape the competitive landscape. Companies focusing on sustainability and innovation will be best positioned to capture significant market share and capitalize on emerging opportunities in diverse end-use sectors.
Speciality Chemicals Market Segmentation
-
1. Paints and Coatings
- 1.1. Dynamics
-
1.2. Application
- 1.2.1. Architectural
- 1.2.2. Automotive
- 1.2.3. Industrial
- 1.2.4. Wood
- 1.2.5. Other Applications
-
2. Catalysts
- 2.1. Dynamics
-
2.2. Function
- 2.2.1. Chemical Synthesis Catalysts
- 2.2.2. Petroleum Refining Catalysts
- 2.2.3. Polymerization Catalysts
-
3. Construction Chemicals
- 3.1. Dynamics
-
3.2. Application
- 3.2.1. Commercial
- 3.2.2. Industrial
- 3.2.3. Infrastructure
- 3.2.4. Residential
- 3.2.5. Public Space
-
4. Cosmetic Chemicals
- 4.1. Dynamics
-
4.2. Application
- 4.2.1. Hair Care
- 4.2.2. Skin Care
- 4.2.3. Oral Care
- 4.2.4. Personal Hygiene
- 4.2.5. Other Applications
-
5. Dyes, Inks, and Pigments
- 5.1. Dynamics
-
5.2. Type
- 5.2.1. Organic Pigments
- 5.2.2. Inorganic Pigments
-
6. Electronic Chemicals
- 6.1. Dynamics
-
6.2. Application
- 6.2.1. Semiconductors and Integrated Circuits
- 6.2.2. Printed Circuit Boards
-
7. Water Treatment Chemicals
- 7.1. Dynamics
-
7.2. Function
- 7.2.1. Flocculants
- 7.2.2. Coagulants
- 7.2.3. Biocides and Disinfectants
- 7.2.4. Defoamers and Defoaming Agents
- 7.2.5. pH Adjusters and Softeners
- 7.2.6. Other Functions
-
8. Food Additives
- 8.1. Dynamics
-
8.2. Type
- 8.2.1. Natural Additives
- 8.2.2. Synthetic Additives
-
9. Agrochemicals
- 9.1. Dynamics
-
9.2. Type
- 9.2.1. Fertilizers
- 9.2.2. Herbicide
- 9.2.3. Fungicide
- 9.2.4. Insecticide
- 9.2.5. Nematicide
- 9.2.6. Molluscicide
- 9.2.7. Other Crop Protection Chemicals
-
10. Industrial and Institutional Cleaners
- 10.1. Dynamics
-
10.2. Application
- 10.2.1. General Purpose Cleaners
- 10.2.2. Disinfectants and Sanitizers
- 10.2.3. Laundry Care Products
- 10.2.4. Vehicle Wash Products
-
11. Lubricant Additives
- 11.1. Dynamics
-
11.2. Product Type
- 11.2.1. Dispersants and Emulsifiers
- 11.2.2. Detergents
- 11.2.3. Oxidation Inhibitors
- 11.2.4. Extreme-pressure Additives and Anti-wear Additives
- 11.2.5. Viscosity Index Modifiers
- 11.2.6. Friction Modifiers
- 11.2.7. Corrosion Inhibitors
- 11.2.8. Other Product Types
-
12. Mining Chemicals
- 12.1. Dynamics
-
12.2. Function
- 12.2.1. Flotation Chemicals
- 12.2.2. Extraction Chemicals
- 12.2.3. Grinding Aids
-
13. Oilfield Chemicals
- 13.1. Dynamics
-
13.2. Application
- 13.2.1. Biocide
- 13.2.2. Corrosion and Scale Inhibitor
- 13.2.3. Demulsifier
- 13.2.4. Polymer
- 13.2.5. Surfactant
- 13.2.6. Other Chemical Types
-
14. Adhesives and Sealants
- 14.1. Dynamics
-
14.2. Technology
- 14.2.1. Water-borne Adhesives
- 14.2.2. Solvent-borne Adhesives
- 14.2.3. Hot-melt Adhesives
- 14.2.4. Reactive Adhesives
- 14.2.5. Other Adhesives
-
15. Plastic Additives
- 15.1. Dynamics
-
15.2. Plastic Type
- 15.2.1. Polyethylene (PE)
- 15.2.2. Polystyrene (PS)
- 15.2.3. Polypropylene (PP)
- 15.2.4. Polyamide (PA)
- 15.2.5. Polyethylene Terephthalate (PET)
- 15.2.6. Polyvinyl Chloride (PVC)
- 15.2.7. Polycarbonate (PC)
- 15.2.8. Other Plastic Types
-
16. Rubber Processing Chemicals
- 16.1. Dynamics
-
16.2. Application
- 16.2.1. Tire
- 16.2.2. Non-tire
-
17. Specialty Polymers
- 17.1. Dynamics
-
18. Textile Chemicals
- 18.1. Dynamics
-
18.2. Application
- 18.2.1. Coating and Sizing Chemicals
- 18.2.2. Colorants and Auxiliaries
- 18.2.3. Finishing Agents
- 18.2.4. Desizing Agents
- 18.2.5. Other Application
Speciality Chemicals Market Segmentation By Geography
-
1. Asia Pacific
- 1.1. China
- 1.2. India
- 1.3. Japan
- 1.4. South Korea
- 1.5. ASEAN Countries
- 1.6. Rest of Asia Pacific
-
2. North America
- 2.1. United States
- 2.2. Canada
- 2.3. Mexico
- 2.4. Rest of North America
-
3. Europe
- 3.1. Germany
- 3.2. United Kingdom
- 3.3. Italy
- 3.4. France
- 3.5. Spain
- 3.6. Rest of Europe
-
4. South America
- 4.1. Brazil
- 4.2. Argentina
- 4.3. Rest of South America
-
5. Middle East and Africa
- 5.1. Saudi Arabia
- 5.2. South Africa
- 5.3. Rest of Middle East and Africa
Speciality Chemicals Market REPORT HIGHLIGHTS
| Aspects | Details |
|---|---|
| Study Period | 2019-2033 |
| Base Year | 2024 |
| Estimated Year | 2025 |
| Forecast Period | 2025-2033 |
| Historical Period | 2019-2024 |
| Growth Rate | CAGR of 3.31% from 2019-2033 |
| Segmentation |
|
Table of Contents
- 1. Introduction
- 1.1. Research Scope
- 1.2. Market Segmentation
- 1.3. Research Methodology
- 1.4. Definitions and Assumptions
- 2. Executive Summary
- 2.1. Introduction
- 3. Market Dynamics
- 3.1. Introduction
- 3.2. Market Drivers
- 3.2.1 Robust Growth of Construction Activities in Asia-Pacific
- 3.2.2 and Middle East and Africa; Growing Population is Propelling the Demand for Food Worldwide
- 3.3. Market Restrains
- 3.3.1. Low Resistance to Extreme Weather Conditions; Rising Global Regulations on its Usage
- 3.4. Market Trends
- 3.4.1. Agrochemicals Segment to Dominate the Market Demand
- 4. Market Factor Analysis
- 4.1. Porters Five Forces
- 4.2. Supply/Value Chain
- 4.3. PESTEL analysis
- 4.4. Market Entropy
- 4.5. Patent/Trademark Analysis
- 5. Global Speciality Chemicals Market Analysis, Insights and Forecast, 2019-2031
- 5.1. Market Analysis, Insights and Forecast - by Paints and Coatings
- 5.1.1. Dynamics
- 5.1.2. Application
- 5.1.2.1. Architectural
- 5.1.2.2. Automotive
- 5.1.2.3. Industrial
- 5.1.2.4. Wood
- 5.1.2.5. Other Applications
- 5.2. Market Analysis, Insights and Forecast - by Catalysts
- 5.2.1. Dynamics
- 5.2.2. Function
- 5.2.2.1. Chemical Synthesis Catalysts
- 5.2.2.2. Petroleum Refining Catalysts
- 5.2.2.3. Polymerization Catalysts
- 5.3. Market Analysis, Insights and Forecast - by Construction Chemicals
- 5.3.1. Dynamics
- 5.3.2. Application
- 5.3.2.1. Commercial
- 5.3.2.2. Industrial
- 5.3.2.3. Infrastructure
- 5.3.2.4. Residential
- 5.3.2.5. Public Space
- 5.4. Market Analysis, Insights and Forecast - by Cosmetic Chemicals
- 5.4.1. Dynamics
- 5.4.2. Application
- 5.4.2.1. Hair Care
- 5.4.2.2. Skin Care
- 5.4.2.3. Oral Care
- 5.4.2.4. Personal Hygiene
- 5.4.2.5. Other Applications
- 5.5. Market Analysis, Insights and Forecast - by Dyes, Inks, and Pigments
- 5.5.1. Dynamics
- 5.5.2. Type
- 5.5.2.1. Organic Pigments
- 5.5.2.2. Inorganic Pigments
- 5.6. Market Analysis, Insights and Forecast - by Electronic Chemicals
- 5.6.1. Dynamics
- 5.6.2. Application
- 5.6.2.1. Semiconductors and Integrated Circuits
- 5.6.2.2. Printed Circuit Boards
- 5.7. Market Analysis, Insights and Forecast - by Water Treatment Chemicals
- 5.7.1. Dynamics
- 5.7.2. Function
- 5.7.2.1. Flocculants
- 5.7.2.2. Coagulants
- 5.7.2.3. Biocides and Disinfectants
- 5.7.2.4. Defoamers and Defoaming Agents
- 5.7.2.5. pH Adjusters and Softeners
- 5.7.2.6. Other Functions
- 5.8. Market Analysis, Insights and Forecast - by Food Additives
- 5.8.1. Dynamics
- 5.8.2. Type
- 5.8.2.1. Natural Additives
- 5.8.2.2. Synthetic Additives
- 5.9. Market Analysis, Insights and Forecast - by Agrochemicals
- 5.9.1. Dynamics
- 5.9.2. Type
- 5.9.2.1. Fertilizers
- 5.9.2.2. Herbicide
- 5.9.2.3. Fungicide
- 5.9.2.4. Insecticide
- 5.9.2.5. Nematicide
- 5.9.2.6. Molluscicide
- 5.9.2.7. Other Crop Protection Chemicals
- 5.10. Market Analysis, Insights and Forecast - by Industrial and Institutional Cleaners
- 5.10.1. Dynamics
- 5.10.2. Application
- 5.10.2.1. General Purpose Cleaners
- 5.10.2.2. Disinfectants and Sanitizers
- 5.10.2.3. Laundry Care Products
- 5.10.2.4. Vehicle Wash Products
- 5.11. Market Analysis, Insights and Forecast - by Lubricant Additives
- 5.11.1. Dynamics
- 5.11.2. Product Type
- 5.11.2.1. Dispersants and Emulsifiers
- 5.11.2.2. Detergents
- 5.11.2.3. Oxidation Inhibitors
- 5.11.2.4. Extreme-pressure Additives and Anti-wear Additives
- 5.11.2.5. Viscosity Index Modifiers
- 5.11.2.6. Friction Modifiers
- 5.11.2.7. Corrosion Inhibitors
- 5.11.2.8. Other Product Types
- 5.12. Market Analysis, Insights and Forecast - by Mining Chemicals
- 5.12.1. Dynamics
- 5.12.2. Function
- 5.12.2.1. Flotation Chemicals
- 5.12.2.2. Extraction Chemicals
- 5.12.2.3. Grinding Aids
- 5.13. Market Analysis, Insights and Forecast - by Oilfield Chemicals
- 5.13.1. Dynamics
- 5.13.2. Application
- 5.13.2.1. Biocide
- 5.13.2.2. Corrosion and Scale Inhibitor
- 5.13.2.3. Demulsifier
- 5.13.2.4. Polymer
- 5.13.2.5. Surfactant
- 5.13.2.6. Other Chemical Types
- 5.14. Market Analysis, Insights and Forecast - by Adhesives and Sealants
- 5.14.1. Dynamics
- 5.14.2. Technology
- 5.14.2.1. Water-borne Adhesives
- 5.14.2.2. Solvent-borne Adhesives
- 5.14.2.3. Hot-melt Adhesives
- 5.14.2.4. Reactive Adhesives
- 5.14.2.5. Other Adhesives
- 5.15. Market Analysis, Insights and Forecast - by Plastic Additives
- 5.15.1. Dynamics
- 5.15.2. Plastic Type
- 5.15.2.1. Polyethylene (PE)
- 5.15.2.2. Polystyrene (PS)
- 5.15.2.3. Polypropylene (PP)
- 5.15.2.4. Polyamide (PA)
- 5.15.2.5. Polyethylene Terephthalate (PET)
- 5.15.2.6. Polyvinyl Chloride (PVC)
- 5.15.2.7. Polycarbonate (PC)
- 5.15.2.8. Other Plastic Types
- 5.16. Market Analysis, Insights and Forecast - by Rubber Processing Chemicals
- 5.16.1. Dynamics
- 5.16.2. Application
- 5.16.2.1. Tire
- 5.16.2.2. Non-tire
- 5.17. Market Analysis, Insights and Forecast - by Specialty Polymers
- 5.17.1. Dynamics
- 5.18. Market Analysis, Insights and Forecast - by Textile Chemicals
- 5.18.1. Dynamics
- 5.18.2. Application
- 5.18.2.1. Coating and Sizing Chemicals
- 5.18.2.2. Colorants and Auxiliaries
- 5.18.2.3. Finishing Agents
- 5.18.2.4. Desizing Agents
- 5.18.2.5. Other Application
- 5.19. Market Analysis, Insights and Forecast - by Region
- 5.19.1. Asia Pacific
- 5.19.2. North America
- 5.19.3. Europe
- 5.19.4. South America
- 5.19.5. Middle East and Africa
- 5.1. Market Analysis, Insights and Forecast - by Paints and Coatings
- 6. Asia Pacific Speciality Chemicals Market Analysis, Insights and Forecast, 2019-2031
- 6.1. Market Analysis, Insights and Forecast - by Paints and Coatings
- 6.1.1. Dynamics
- 6.1.2. Application
- 6.1.2.1. Architectural
- 6.1.2.2. Automotive
- 6.1.2.3. Industrial
- 6.1.2.4. Wood
- 6.1.2.5. Other Applications
- 6.2. Market Analysis, Insights and Forecast - by Catalysts
- 6.2.1. Dynamics
- 6.2.2. Function
- 6.2.2.1. Chemical Synthesis Catalysts
- 6.2.2.2. Petroleum Refining Catalysts
- 6.2.2.3. Polymerization Catalysts
- 6.3. Market Analysis, Insights and Forecast - by Construction Chemicals
- 6.3.1. Dynamics
- 6.3.2. Application
- 6.3.2.1. Commercial
- 6.3.2.2. Industrial
- 6.3.2.3. Infrastructure
- 6.3.2.4. Residential
- 6.3.2.5. Public Space
- 6.4. Market Analysis, Insights and Forecast - by Cosmetic Chemicals
- 6.4.1. Dynamics
- 6.4.2. Application
- 6.4.2.1. Hair Care
- 6.4.2.2. Skin Care
- 6.4.2.3. Oral Care
- 6.4.2.4. Personal Hygiene
- 6.4.2.5. Other Applications
- 6.5. Market Analysis, Insights and Forecast - by Dyes, Inks, and Pigments
- 6.5.1. Dynamics
- 6.5.2. Type
- 6.5.2.1. Organic Pigments
- 6.5.2.2. Inorganic Pigments
- 6.6. Market Analysis, Insights and Forecast - by Electronic Chemicals
- 6.6.1. Dynamics
- 6.6.2. Application
- 6.6.2.1. Semiconductors and Integrated Circuits
- 6.6.2.2. Printed Circuit Boards
- 6.7. Market Analysis, Insights and Forecast - by Water Treatment Chemicals
- 6.7.1. Dynamics
- 6.7.2. Function
- 6.7.2.1. Flocculants
- 6.7.2.2. Coagulants
- 6.7.2.3. Biocides and Disinfectants
- 6.7.2.4. Defoamers and Defoaming Agents
- 6.7.2.5. pH Adjusters and Softeners
- 6.7.2.6. Other Functions
- 6.8. Market Analysis, Insights and Forecast - by Food Additives
- 6.8.1. Dynamics
- 6.8.2. Type
- 6.8.2.1. Natural Additives
- 6.8.2.2. Synthetic Additives
- 6.9. Market Analysis, Insights and Forecast - by Agrochemicals
- 6.9.1. Dynamics
- 6.9.2. Type
- 6.9.2.1. Fertilizers
- 6.9.2.2. Herbicide
- 6.9.2.3. Fungicide
- 6.9.2.4. Insecticide
- 6.9.2.5. Nematicide
- 6.9.2.6. Molluscicide
- 6.9.2.7. Other Crop Protection Chemicals
- 6.10. Market Analysis, Insights and Forecast - by Industrial and Institutional Cleaners
- 6.10.1. Dynamics
- 6.10.2. Application
- 6.10.2.1. General Purpose Cleaners
- 6.10.2.2. Disinfectants and Sanitizers
- 6.10.2.3. Laundry Care Products
- 6.10.2.4. Vehicle Wash Products
- 6.11. Market Analysis, Insights and Forecast - by Lubricant Additives
- 6.11.1. Dynamics
- 6.11.2. Product Type
- 6.11.2.1. Dispersants and Emulsifiers
- 6.11.2.2. Detergents
- 6.11.2.3. Oxidation Inhibitors
- 6.11.2.4. Extreme-pressure Additives and Anti-wear Additives
- 6.11.2.5. Viscosity Index Modifiers
- 6.11.2.6. Friction Modifiers
- 6.11.2.7. Corrosion Inhibitors
- 6.11.2.8. Other Product Types
- 6.12. Market Analysis, Insights and Forecast - by Mining Chemicals
- 6.12.1. Dynamics
- 6.12.2. Function
- 6.12.2.1. Flotation Chemicals
- 6.12.2.2. Extraction Chemicals
- 6.12.2.3. Grinding Aids
- 6.13. Market Analysis, Insights and Forecast - by Oilfield Chemicals
- 6.13.1. Dynamics
- 6.13.2. Application
- 6.13.2.1. Biocide
- 6.13.2.2. Corrosion and Scale Inhibitor
- 6.13.2.3. Demulsifier
- 6.13.2.4. Polymer
- 6.13.2.5. Surfactant
- 6.13.2.6. Other Chemical Types
- 6.14. Market Analysis, Insights and Forecast - by Adhesives and Sealants
- 6.14.1. Dynamics
- 6.14.2. Technology
- 6.14.2.1. Water-borne Adhesives
- 6.14.2.2. Solvent-borne Adhesives
- 6.14.2.3. Hot-melt Adhesives
- 6.14.2.4. Reactive Adhesives
- 6.14.2.5. Other Adhesives
- 6.15. Market Analysis, Insights and Forecast - by Plastic Additives
- 6.15.1. Dynamics
- 6.15.2. Plastic Type
- 6.15.2.1. Polyethylene (PE)
- 6.15.2.2. Polystyrene (PS)
- 6.15.2.3. Polypropylene (PP)
- 6.15.2.4. Polyamide (PA)
- 6.15.2.5. Polyethylene Terephthalate (PET)
- 6.15.2.6. Polyvinyl Chloride (PVC)
- 6.15.2.7. Polycarbonate (PC)
- 6.15.2.8. Other Plastic Types
- 6.16. Market Analysis, Insights and Forecast - by Rubber Processing Chemicals
- 6.16.1. Dynamics
- 6.16.2. Application
- 6.16.2.1. Tire
- 6.16.2.2. Non-tire
- 6.17. Market Analysis, Insights and Forecast - by Specialty Polymers
- 6.17.1. Dynamics
- 6.18. Market Analysis, Insights and Forecast - by Textile Chemicals
- 6.18.1. Dynamics
- 6.18.2. Application
- 6.18.2.1. Coating and Sizing Chemicals
- 6.18.2.2. Colorants and Auxiliaries
- 6.18.2.3. Finishing Agents
- 6.18.2.4. Desizing Agents
- 6.18.2.5. Other Application
- 6.1. Market Analysis, Insights and Forecast - by Paints and Coatings
- 7. North America Speciality Chemicals Market Analysis, Insights and Forecast, 2019-2031
- 7.1. Market Analysis, Insights and Forecast - by Paints and Coatings
- 7.1.1. Dynamics
- 7.1.2. Application
- 7.1.2.1. Architectural
- 7.1.2.2. Automotive
- 7.1.2.3. Industrial
- 7.1.2.4. Wood
- 7.1.2.5. Other Applications
- 7.2. Market Analysis, Insights and Forecast - by Catalysts
- 7.2.1. Dynamics
- 7.2.2. Function
- 7.2.2.1. Chemical Synthesis Catalysts
- 7.2.2.2. Petroleum Refining Catalysts
- 7.2.2.3. Polymerization Catalysts
- 7.3. Market Analysis, Insights and Forecast - by Construction Chemicals
- 7.3.1. Dynamics
- 7.3.2. Application
- 7.3.2.1. Commercial
- 7.3.2.2. Industrial
- 7.3.2.3. Infrastructure
- 7.3.2.4. Residential
- 7.3.2.5. Public Space
- 7.4. Market Analysis, Insights and Forecast - by Cosmetic Chemicals
- 7.4.1. Dynamics
- 7.4.2. Application
- 7.4.2.1. Hair Care
- 7.4.2.2. Skin Care
- 7.4.2.3. Oral Care
- 7.4.2.4. Personal Hygiene
- 7.4.2.5. Other Applications
- 7.5. Market Analysis, Insights and Forecast - by Dyes, Inks, and Pigments
- 7.5.1. Dynamics
- 7.5.2. Type
- 7.5.2.1. Organic Pigments
- 7.5.2.2. Inorganic Pigments
- 7.6. Market Analysis, Insights and Forecast - by Electronic Chemicals
- 7.6.1. Dynamics
- 7.6.2. Application
- 7.6.2.1. Semiconductors and Integrated Circuits
- 7.6.2.2. Printed Circuit Boards
- 7.7. Market Analysis, Insights and Forecast - by Water Treatment Chemicals
- 7.7.1. Dynamics
- 7.7.2. Function
- 7.7.2.1. Flocculants
- 7.7.2.2. Coagulants
- 7.7.2.3. Biocides and Disinfectants
- 7.7.2.4. Defoamers and Defoaming Agents
- 7.7.2.5. pH Adjusters and Softeners
- 7.7.2.6. Other Functions
- 7.8. Market Analysis, Insights and Forecast - by Food Additives
- 7.8.1. Dynamics
- 7.8.2. Type
- 7.8.2.1. Natural Additives
- 7.8.2.2. Synthetic Additives
- 7.9. Market Analysis, Insights and Forecast - by Agrochemicals
- 7.9.1. Dynamics
- 7.9.2. Type
- 7.9.2.1. Fertilizers
- 7.9.2.2. Herbicide
- 7.9.2.3. Fungicide
- 7.9.2.4. Insecticide
- 7.9.2.5. Nematicide
- 7.9.2.6. Molluscicide
- 7.9.2.7. Other Crop Protection Chemicals
- 7.10. Market Analysis, Insights and Forecast - by Industrial and Institutional Cleaners
- 7.10.1. Dynamics
- 7.10.2. Application
- 7.10.2.1. General Purpose Cleaners
- 7.10.2.2. Disinfectants and Sanitizers
- 7.10.2.3. Laundry Care Products
- 7.10.2.4. Vehicle Wash Products
- 7.11. Market Analysis, Insights and Forecast - by Lubricant Additives
- 7.11.1. Dynamics
- 7.11.2. Product Type
- 7.11.2.1. Dispersants and Emulsifiers
- 7.11.2.2. Detergents
- 7.11.2.3. Oxidation Inhibitors
- 7.11.2.4. Extreme-pressure Additives and Anti-wear Additives
- 7.11.2.5. Viscosity Index Modifiers
- 7.11.2.6. Friction Modifiers
- 7.11.2.7. Corrosion Inhibitors
- 7.11.2.8. Other Product Types
- 7.12. Market Analysis, Insights and Forecast - by Mining Chemicals
- 7.12.1. Dynamics
- 7.12.2. Function
- 7.12.2.1. Flotation Chemicals
- 7.12.2.2. Extraction Chemicals
- 7.12.2.3. Grinding Aids
- 7.13. Market Analysis, Insights and Forecast - by Oilfield Chemicals
- 7.13.1. Dynamics
- 7.13.2. Application
- 7.13.2.1. Biocide
- 7.13.2.2. Corrosion and Scale Inhibitor
- 7.13.2.3. Demulsifier
- 7.13.2.4. Polymer
- 7.13.2.5. Surfactant
- 7.13.2.6. Other Chemical Types
- 7.14. Market Analysis, Insights and Forecast - by Adhesives and Sealants
- 7.14.1. Dynamics
- 7.14.2. Technology
- 7.14.2.1. Water-borne Adhesives
- 7.14.2.2. Solvent-borne Adhesives
- 7.14.2.3. Hot-melt Adhesives
- 7.14.2.4. Reactive Adhesives
- 7.14.2.5. Other Adhesives
- 7.15. Market Analysis, Insights and Forecast - by Plastic Additives
- 7.15.1. Dynamics
- 7.15.2. Plastic Type
- 7.15.2.1. Polyethylene (PE)
- 7.15.2.2. Polystyrene (PS)
- 7.15.2.3. Polypropylene (PP)
- 7.15.2.4. Polyamide (PA)
- 7.15.2.5. Polyethylene Terephthalate (PET)
- 7.15.2.6. Polyvinyl Chloride (PVC)
- 7.15.2.7. Polycarbonate (PC)
- 7.15.2.8. Other Plastic Types
- 7.16. Market Analysis, Insights and Forecast - by Rubber Processing Chemicals
- 7.16.1. Dynamics
- 7.16.2. Application
- 7.16.2.1. Tire
- 7.16.2.2. Non-tire
- 7.17. Market Analysis, Insights and Forecast - by Specialty Polymers
- 7.17.1. Dynamics
- 7.18. Market Analysis, Insights and Forecast - by Textile Chemicals
- 7.18.1. Dynamics
- 7.18.2. Application
- 7.18.2.1. Coating and Sizing Chemicals
- 7.18.2.2. Colorants and Auxiliaries
- 7.18.2.3. Finishing Agents
- 7.18.2.4. Desizing Agents
- 7.18.2.5. Other Application
- 7.1. Market Analysis, Insights and Forecast - by Paints and Coatings
- 8. Europe Speciality Chemicals Market Analysis, Insights and Forecast, 2019-2031
- 8.1. Market Analysis, Insights and Forecast - by Paints and Coatings
- 8.1.1. Dynamics
- 8.1.2. Application
- 8.1.2.1. Architectural
- 8.1.2.2. Automotive
- 8.1.2.3. Industrial
- 8.1.2.4. Wood
- 8.1.2.5. Other Applications
- 8.2. Market Analysis, Insights and Forecast - by Catalysts
- 8.2.1. Dynamics
- 8.2.2. Function
- 8.2.2.1. Chemical Synthesis Catalysts
- 8.2.2.2. Petroleum Refining Catalysts
- 8.2.2.3. Polymerization Catalysts
- 8.3. Market Analysis, Insights and Forecast - by Construction Chemicals
- 8.3.1. Dynamics
- 8.3.2. Application
- 8.3.2.1. Commercial
- 8.3.2.2. Industrial
- 8.3.2.3. Infrastructure
- 8.3.2.4. Residential
- 8.3.2.5. Public Space
- 8.4. Market Analysis, Insights and Forecast - by Cosmetic Chemicals
- 8.4.1. Dynamics
- 8.4.2. Application
- 8.4.2.1. Hair Care
- 8.4.2.2. Skin Care
- 8.4.2.3. Oral Care
- 8.4.2.4. Personal Hygiene
- 8.4.2.5. Other Applications
- 8.5. Market Analysis, Insights and Forecast - by Dyes, Inks, and Pigments
- 8.5.1. Dynamics
- 8.5.2. Type
- 8.5.2.1. Organic Pigments
- 8.5.2.2. Inorganic Pigments
- 8.6. Market Analysis, Insights and Forecast - by Electronic Chemicals
- 8.6.1. Dynamics
- 8.6.2. Application
- 8.6.2.1. Semiconductors and Integrated Circuits
- 8.6.2.2. Printed Circuit Boards
- 8.7. Market Analysis, Insights and Forecast - by Water Treatment Chemicals
- 8.7.1. Dynamics
- 8.7.2. Function
- 8.7.2.1. Flocculants
- 8.7.2.2. Coagulants
- 8.7.2.3. Biocides and Disinfectants
- 8.7.2.4. Defoamers and Defoaming Agents
- 8.7.2.5. pH Adjusters and Softeners
- 8.7.2.6. Other Functions
- 8.8. Market Analysis, Insights and Forecast - by Food Additives
- 8.8.1. Dynamics
- 8.8.2. Type
- 8.8.2.1. Natural Additives
- 8.8.2.2. Synthetic Additives
- 8.9. Market Analysis, Insights and Forecast - by Agrochemicals
- 8.9.1. Dynamics
- 8.9.2. Type
- 8.9.2.1. Fertilizers
- 8.9.2.2. Herbicide
- 8.9.2.3. Fungicide
- 8.9.2.4. Insecticide
- 8.9.2.5. Nematicide
- 8.9.2.6. Molluscicide
- 8.9.2.7. Other Crop Protection Chemicals
- 8.10. Market Analysis, Insights and Forecast - by Industrial and Institutional Cleaners
- 8.10.1. Dynamics
- 8.10.2. Application
- 8.10.2.1. General Purpose Cleaners
- 8.10.2.2. Disinfectants and Sanitizers
- 8.10.2.3. Laundry Care Products
- 8.10.2.4. Vehicle Wash Products
- 8.11. Market Analysis, Insights and Forecast - by Lubricant Additives
- 8.11.1. Dynamics
- 8.11.2. Product Type
- 8.11.2.1. Dispersants and Emulsifiers
- 8.11.2.2. Detergents
- 8.11.2.3. Oxidation Inhibitors
- 8.11.2.4. Extreme-pressure Additives and Anti-wear Additives
- 8.11.2.5. Viscosity Index Modifiers
- 8.11.2.6. Friction Modifiers
- 8.11.2.7. Corrosion Inhibitors
- 8.11.2.8. Other Product Types
- 8.12. Market Analysis, Insights and Forecast - by Mining Chemicals
- 8.12.1. Dynamics
- 8.12.2. Function
- 8.12.2.1. Flotation Chemicals
- 8.12.2.2. Extraction Chemicals
- 8.12.2.3. Grinding Aids
- 8.13. Market Analysis, Insights and Forecast - by Oilfield Chemicals
- 8.13.1. Dynamics
- 8.13.2. Application
- 8.13.2.1. Biocide
- 8.13.2.2. Corrosion and Scale Inhibitor
- 8.13.2.3. Demulsifier
- 8.13.2.4. Polymer
- 8.13.2.5. Surfactant
- 8.13.2.6. Other Chemical Types
- 8.14. Market Analysis, Insights and Forecast - by Adhesives and Sealants
- 8.14.1. Dynamics
- 8.14.2. Technology
- 8.14.2.1. Water-borne Adhesives
- 8.14.2.2. Solvent-borne Adhesives
- 8.14.2.3. Hot-melt Adhesives
- 8.14.2.4. Reactive Adhesives
- 8.14.2.5. Other Adhesives
- 8.15. Market Analysis, Insights and Forecast - by Plastic Additives
- 8.15.1. Dynamics
- 8.15.2. Plastic Type
- 8.15.2.1. Polyethylene (PE)
- 8.15.2.2. Polystyrene (PS)
- 8.15.2.3. Polypropylene (PP)
- 8.15.2.4. Polyamide (PA)
- 8.15.2.5. Polyethylene Terephthalate (PET)
- 8.15.2.6. Polyvinyl Chloride (PVC)
- 8.15.2.7. Polycarbonate (PC)
- 8.15.2.8. Other Plastic Types
- 8.16. Market Analysis, Insights and Forecast - by Rubber Processing Chemicals
- 8.16.1. Dynamics
- 8.16.2. Application
- 8.16.2.1. Tire
- 8.16.2.2. Non-tire
- 8.17. Market Analysis, Insights and Forecast - by Specialty Polymers
- 8.17.1. Dynamics
- 8.18. Market Analysis, Insights and Forecast - by Textile Chemicals
- 8.18.1. Dynamics
- 8.18.2. Application
- 8.18.2.1. Coating and Sizing Chemicals
- 8.18.2.2. Colorants and Auxiliaries
- 8.18.2.3. Finishing Agents
- 8.18.2.4. Desizing Agents
- 8.18.2.5. Other Application
- 8.1. Market Analysis, Insights and Forecast - by Paints and Coatings
- 9. South America Speciality Chemicals Market Analysis, Insights and Forecast, 2019-2031
- 9.1. Market Analysis, Insights and Forecast - by Paints and Coatings
- 9.1.1. Dynamics
- 9.1.2. Application
- 9.1.2.1. Architectural
- 9.1.2.2. Automotive
- 9.1.2.3. Industrial
- 9.1.2.4. Wood
- 9.1.2.5. Other Applications
- 9.2. Market Analysis, Insights and Forecast - by Catalysts
- 9.2.1. Dynamics
- 9.2.2. Function
- 9.2.2.1. Chemical Synthesis Catalysts
- 9.2.2.2. Petroleum Refining Catalysts
- 9.2.2.3. Polymerization Catalysts
- 9.3. Market Analysis, Insights and Forecast - by Construction Chemicals
- 9.3.1. Dynamics
- 9.3.2. Application
- 9.3.2.1. Commercial
- 9.3.2.2. Industrial
- 9.3.2.3. Infrastructure
- 9.3.2.4. Residential
- 9.3.2.5. Public Space
- 9.4. Market Analysis, Insights and Forecast - by Cosmetic Chemicals
- 9.4.1. Dynamics
- 9.4.2. Application
- 9.4.2.1. Hair Care
- 9.4.2.2. Skin Care
- 9.4.2.3. Oral Care
- 9.4.2.4. Personal Hygiene
- 9.4.2.5. Other Applications
- 9.5. Market Analysis, Insights and Forecast - by Dyes, Inks, and Pigments
- 9.5.1. Dynamics
- 9.5.2. Type
- 9.5.2.1. Organic Pigments
- 9.5.2.2. Inorganic Pigments
- 9.6. Market Analysis, Insights and Forecast - by Electronic Chemicals
- 9.6.1. Dynamics
- 9.6.2. Application
- 9.6.2.1. Semiconductors and Integrated Circuits
- 9.6.2.2. Printed Circuit Boards
- 9.7. Market Analysis, Insights and Forecast - by Water Treatment Chemicals
- 9.7.1. Dynamics
- 9.7.2. Function
- 9.7.2.1. Flocculants
- 9.7.2.2. Coagulants
- 9.7.2.3. Biocides and Disinfectants
- 9.7.2.4. Defoamers and Defoaming Agents
- 9.7.2.5. pH Adjusters and Softeners
- 9.7.2.6. Other Functions
- 9.8. Market Analysis, Insights and Forecast - by Food Additives
- 9.8.1. Dynamics
- 9.8.2. Type
- 9.8.2.1. Natural Additives
- 9.8.2.2. Synthetic Additives
- 9.9. Market Analysis, Insights and Forecast - by Agrochemicals
- 9.9.1. Dynamics
- 9.9.2. Type
- 9.9.2.1. Fertilizers
- 9.9.2.2. Herbicide
- 9.9.2.3. Fungicide
- 9.9.2.4. Insecticide
- 9.9.2.5. Nematicide
- 9.9.2.6. Molluscicide
- 9.9.2.7. Other Crop Protection Chemicals
- 9.10. Market Analysis, Insights and Forecast - by Industrial and Institutional Cleaners
- 9.10.1. Dynamics
- 9.10.2. Application
- 9.10.2.1. General Purpose Cleaners
- 9.10.2.2. Disinfectants and Sanitizers
- 9.10.2.3. Laundry Care Products
- 9.10.2.4. Vehicle Wash Products
- 9.11. Market Analysis, Insights and Forecast - by Lubricant Additives
- 9.11.1. Dynamics
- 9.11.2. Product Type
- 9.11.2.1. Dispersants and Emulsifiers
- 9.11.2.2. Detergents
- 9.11.2.3. Oxidation Inhibitors
- 9.11.2.4. Extreme-pressure Additives and Anti-wear Additives
- 9.11.2.5. Viscosity Index Modifiers
- 9.11.2.6. Friction Modifiers
- 9.11.2.7. Corrosion Inhibitors
- 9.11.2.8. Other Product Types
- 9.12. Market Analysis, Insights and Forecast - by Mining Chemicals
- 9.12.1. Dynamics
- 9.12.2. Function
- 9.12.2.1. Flotation Chemicals
- 9.12.2.2. Extraction Chemicals
- 9.12.2.3. Grinding Aids
- 9.13. Market Analysis, Insights and Forecast - by Oilfield Chemicals
- 9.13.1. Dynamics
- 9.13.2. Application
- 9.13.2.1. Biocide
- 9.13.2.2. Corrosion and Scale Inhibitor
- 9.13.2.3. Demulsifier
- 9.13.2.4. Polymer
- 9.13.2.5. Surfactant
- 9.13.2.6. Other Chemical Types
- 9.14. Market Analysis, Insights and Forecast - by Adhesives and Sealants
- 9.14.1. Dynamics
- 9.14.2. Technology
- 9.14.2.1. Water-borne Adhesives
- 9.14.2.2. Solvent-borne Adhesives
- 9.14.2.3. Hot-melt Adhesives
- 9.14.2.4. Reactive Adhesives
- 9.14.2.5. Other Adhesives
- 9.15. Market Analysis, Insights and Forecast - by Plastic Additives
- 9.15.1. Dynamics
- 9.15.2. Plastic Type
- 9.15.2.1. Polyethylene (PE)
- 9.15.2.2. Polystyrene (PS)
- 9.15.2.3. Polypropylene (PP)
- 9.15.2.4. Polyamide (PA)
- 9.15.2.5. Polyethylene Terephthalate (PET)
- 9.15.2.6. Polyvinyl Chloride (PVC)
- 9.15.2.7. Polycarbonate (PC)
- 9.15.2.8. Other Plastic Types
- 9.16. Market Analysis, Insights and Forecast - by Rubber Processing Chemicals
- 9.16.1. Dynamics
- 9.16.2. Application
- 9.16.2.1. Tire
- 9.16.2.2. Non-tire
- 9.17. Market Analysis, Insights and Forecast - by Specialty Polymers
- 9.17.1. Dynamics
- 9.18. Market Analysis, Insights and Forecast - by Textile Chemicals
- 9.18.1. Dynamics
- 9.18.2. Application
- 9.18.2.1. Coating and Sizing Chemicals
- 9.18.2.2. Colorants and Auxiliaries
- 9.18.2.3. Finishing Agents
- 9.18.2.4. Desizing Agents
- 9.18.2.5. Other Application
- 9.1. Market Analysis, Insights and Forecast - by Paints and Coatings
- 10. Middle East and Africa Speciality Chemicals Market Analysis, Insights and Forecast, 2019-2031
- 10.1. Market Analysis, Insights and Forecast - by Paints and Coatings
- 10.1.1. Dynamics
- 10.1.2. Application
- 10.1.2.1. Architectural
- 10.1.2.2. Automotive
- 10.1.2.3. Industrial
- 10.1.2.4. Wood
- 10.1.2.5. Other Applications
- 10.2. Market Analysis, Insights and Forecast - by Catalysts
- 10.2.1. Dynamics
- 10.2.2. Function
- 10.2.2.1. Chemical Synthesis Catalysts
- 10.2.2.2. Petroleum Refining Catalysts
- 10.2.2.3. Polymerization Catalysts
- 10.3. Market Analysis, Insights and Forecast - by Construction Chemicals
- 10.3.1. Dynamics
- 10.3.2. Application
- 10.3.2.1. Commercial
- 10.3.2.2. Industrial
- 10.3.2.3. Infrastructure
- 10.3.2.4. Residential
- 10.3.2.5. Public Space
- 10.4. Market Analysis, Insights and Forecast - by Cosmetic Chemicals
- 10.4.1. Dynamics
- 10.4.2. Application
- 10.4.2.1. Hair Care
- 10.4.2.2. Skin Care
- 10.4.2.3. Oral Care
- 10.4.2.4. Personal Hygiene
- 10.4.2.5. Other Applications
- 10.5. Market Analysis, Insights and Forecast - by Dyes, Inks, and Pigments
- 10.5.1. Dynamics
- 10.5.2. Type
- 10.5.2.1. Organic Pigments
- 10.5.2.2. Inorganic Pigments
- 10.6. Market Analysis, Insights and Forecast - by Electronic Chemicals
- 10.6.1. Dynamics
- 10.6.2. Application
- 10.6.2.1. Semiconductors and Integrated Circuits
- 10.6.2.2. Printed Circuit Boards
- 10.7. Market Analysis, Insights and Forecast - by Water Treatment Chemicals
- 10.7.1. Dynamics
- 10.7.2. Function
- 10.7.2.1. Flocculants
- 10.7.2.2. Coagulants
- 10.7.2.3. Biocides and Disinfectants
- 10.7.2.4. Defoamers and Defoaming Agents
- 10.7.2.5. pH Adjusters and Softeners
- 10.7.2.6. Other Functions
- 10.8. Market Analysis, Insights and Forecast - by Food Additives
- 10.8.1. Dynamics
- 10.8.2. Type
- 10.8.2.1. Natural Additives
- 10.8.2.2. Synthetic Additives
- 10.9. Market Analysis, Insights and Forecast - by Agrochemicals
- 10.9.1. Dynamics
- 10.9.2. Type
- 10.9.2.1. Fertilizers
- 10.9.2.2. Herbicide
- 10.9.2.3. Fungicide
- 10.9.2.4. Insecticide
- 10.9.2.5. Nematicide
- 10.9.2.6. Molluscicide
- 10.9.2.7. Other Crop Protection Chemicals
- 10.10. Market Analysis, Insights and Forecast - by Industrial and Institutional Cleaners
- 10.10.1. Dynamics
- 10.10.2. Application
- 10.10.2.1. General Purpose Cleaners
- 10.10.2.2. Disinfectants and Sanitizers
- 10.10.2.3. Laundry Care Products
- 10.10.2.4. Vehicle Wash Products
- 10.11. Market Analysis, Insights and Forecast - by Lubricant Additives
- 10.11.1. Dynamics
- 10.11.2. Product Type
- 10.11.2.1. Dispersants and Emulsifiers
- 10.11.2.2. Detergents
- 10.11.2.3. Oxidation Inhibitors
- 10.11.2.4. Extreme-pressure Additives and Anti-wear Additives
- 10.11.2.5. Viscosity Index Modifiers
- 10.11.2.6. Friction Modifiers
- 10.11.2.7. Corrosion Inhibitors
- 10.11.2.8. Other Product Types
- 10.12. Market Analysis, Insights and Forecast - by Mining Chemicals
- 10.12.1. Dynamics
- 10.12.2. Function
- 10.12.2.1. Flotation Chemicals
- 10.12.2.2. Extraction Chemicals
- 10.12.2.3. Grinding Aids
- 10.13. Market Analysis, Insights and Forecast - by Oilfield Chemicals
- 10.13.1. Dynamics
- 10.13.2. Application
- 10.13.2.1. Biocide
- 10.13.2.2. Corrosion and Scale Inhibitor
- 10.13.2.3. Demulsifier
- 10.13.2.4. Polymer
- 10.13.2.5. Surfactant
- 10.13.2.6. Other Chemical Types
- 10.14. Market Analysis, Insights and Forecast - by Adhesives and Sealants
- 10.14.1. Dynamics
- 10.14.2. Technology
- 10.14.2.1. Water-borne Adhesives
- 10.14.2.2. Solvent-borne Adhesives
- 10.14.2.3. Hot-melt Adhesives
- 10.14.2.4. Reactive Adhesives
- 10.14.2.5. Other Adhesives
- 10.15. Market Analysis, Insights and Forecast - by Plastic Additives
- 10.15.1. Dynamics
- 10.15.2. Plastic Type
- 10.15.2.1. Polyethylene (PE)
- 10.15.2.2. Polystyrene (PS)
- 10.15.2.3. Polypropylene (PP)
- 10.15.2.4. Polyamide (PA)
- 10.15.2.5. Polyethylene Terephthalate (PET)
- 10.15.2.6. Polyvinyl Chloride (PVC)
- 10.15.2.7. Polycarbonate (PC)
- 10.15.2.8. Other Plastic Types
- 10.16. Market Analysis, Insights and Forecast - by Rubber Processing Chemicals
- 10.16.1. Dynamics
- 10.16.2. Application
- 10.16.2.1. Tire
- 10.16.2.2. Non-tire
- 10.17. Market Analysis, Insights and Forecast - by Specialty Polymers
- 10.17.1. Dynamics
- 10.18. Market Analysis, Insights and Forecast - by Textile Chemicals
- 10.18.1. Dynamics
- 10.18.2. Application
- 10.18.2.1. Coating and Sizing Chemicals
- 10.18.2.2. Colorants and Auxiliaries
- 10.18.2.3. Finishing Agents
- 10.18.2.4. Desizing Agents
- 10.18.2.5. Other Application
- 10.1. Market Analysis, Insights and Forecast - by Paints and Coatings
- 11. Asia Pacific Speciality Chemicals Market Analysis, Insights and Forecast, 2019-2031
- 11.1. Market Analysis, Insights and Forecast - By Country/Sub-region
- 11.1.1 China
- 11.1.2 India
- 11.1.3 Japan
- 11.1.4 South Korea
- 11.1.5 ASEAN Countries
- 11.1.6 Rest of Asia Pacific
- 12. North America Speciality Chemicals Market Analysis, Insights and Forecast, 2019-2031
- 12.1. Market Analysis, Insights and Forecast - By Country/Sub-region
- 12.1.1 United States
- 12.1.2 Canada
- 12.1.3 Mexico
- 12.1.4 Rest of North America
- 13. Europe Speciality Chemicals Market Analysis, Insights and Forecast, 2019-2031
- 13.1. Market Analysis, Insights and Forecast - By Country/Sub-region
- 13.1.1 Germany
- 13.1.2 United Kingdom
- 13.1.3 Italy
- 13.1.4 France
- 13.1.5 Spain
- 13.1.6 Rest of Europe
- 14. South America Speciality Chemicals Market Analysis, Insights and Forecast, 2019-2031
- 14.1. Market Analysis, Insights and Forecast - By Country/Sub-region
- 14.1.1 Brazil
- 14.1.2 Argentina
- 14.1.3 Rest of South America
- 15. Middle East and Africa Speciality Chemicals Market Analysis, Insights and Forecast, 2019-2031
- 15.1. Market Analysis, Insights and Forecast - By Country/Sub-region
- 15.1.1 Saudi Arabia
- 15.1.2 South Africa
- 15.1.3 Rest of Middle East and Africa
- 16. Competitive Analysis
- 16.1. Global Market Share Analysis 2024
- 16.2. Company Profiles
- 16.2.1 Ferro Corporation
- 16.2.1.1. Overview
- 16.2.1.2. Products
- 16.2.1.3. SWOT Analysis
- 16.2.1.4. Recent Developments
- 16.2.1.5. Financials (Based on Availability)
- 16.2.2 Infineum International Limited
- 16.2.2.1. Overview
- 16.2.2.2. Products
- 16.2.2.3. SWOT Analysis
- 16.2.2.4. Recent Developments
- 16.2.2.5. Financials (Based on Availability)
- 16.2.3 Henkel AG & Co KGaA
- 16.2.3.1. Overview
- 16.2.3.2. Products
- 16.2.3.3. SWOT Analysis
- 16.2.3.4. Recent Developments
- 16.2.3.5. Financials (Based on Availability)
- 16.2.4 DIC Corporation
- 16.2.4.1. Overview
- 16.2.4.2. Products
- 16.2.4.3. SWOT Analysis
- 16.2.4.4. Recent Developments
- 16.2.4.5. Financials (Based on Availability)
- 16.2.5 Corteva
- 16.2.5.1. Overview
- 16.2.5.2. Products
- 16.2.5.3. SWOT Analysis
- 16.2.5.4. Recent Developments
- 16.2.5.5. Financials (Based on Availability)
- 16.2.6 Clariant
- 16.2.6.1. Overview
- 16.2.6.2. Products
- 16.2.6.3. SWOT Analysis
- 16.2.6.4. Recent Developments
- 16.2.6.5. Financials (Based on Availability)
- 16.2.7 Ecolab
- 16.2.7.1. Overview
- 16.2.7.2. Products
- 16.2.7.3. SWOT Analysis
- 16.2.7.4. Recent Developments
- 16.2.7.5. Financials (Based on Availability)
- 16.2.8 GCP Applied Technologies Inc
- 16.2.8.1. Overview
- 16.2.8.2. Products
- 16.2.8.3. SWOT Analysis
- 16.2.8.4. Recent Developments
- 16.2.8.5. Financials (Based on Availability)
- 16.2.9 Holcim
- 16.2.9.1. Overview
- 16.2.9.2. Products
- 16.2.9.3. SWOT Analysis
- 16.2.9.4. Recent Developments
- 16.2.9.5. Financials (Based on Availability)
- 16.2.10 Nouryon
- 16.2.10.1. Overview
- 16.2.10.2. Products
- 16.2.10.3. SWOT Analysis
- 16.2.10.4. Recent Developments
- 16.2.10.5. Financials (Based on Availability)
- 16.2.1 Ferro Corporation
List of Figures
- Figure 1: Global Speciality Chemicals Market Revenue Breakdown (Million, %) by Region 2024 & 2032
- Figure 2: Asia Pacific Speciality Chemicals Market Revenue (Million), by Country 2024 & 2032
- Figure 3: Asia Pacific Speciality Chemicals Market Revenue Share (%), by Country 2024 & 2032
- Figure 4: North America Speciality Chemicals Market Revenue (Million), by Country 2024 & 2032
- Figure 5: North America Speciality Chemicals Market Revenue Share (%), by Country 2024 & 2032
- Figure 6: Europe Speciality Chemicals Market Revenue (Million), by Country 2024 & 2032
- Figure 7: Europe Speciality Chemicals Market Revenue Share (%), by Country 2024 & 2032
- Figure 8: South America Speciality Chemicals Market Revenue (Million), by Country 2024 & 2032
- Figure 9: South America Speciality Chemicals Market Revenue Share (%), by Country 2024 & 2032
- Figure 10: Middle East and Africa Speciality Chemicals Market Revenue (Million), by Country 2024 & 2032
- Figure 11: Middle East and Africa Speciality Chemicals Market Revenue Share (%), by Country 2024 & 2032
- Figure 12: Asia Pacific Speciality Chemicals Market Revenue (Million), by Paints and Coatings 2024 & 2032
- Figure 13: Asia Pacific Speciality Chemicals Market Revenue Share (%), by Paints and Coatings 2024 & 2032
- Figure 14: Asia Pacific Speciality Chemicals Market Revenue (Million), by Catalysts 2024 & 2032
- Figure 15: Asia Pacific Speciality Chemicals Market Revenue Share (%), by Catalysts 2024 & 2032
- Figure 16: Asia Pacific Speciality Chemicals Market Revenue (Million), by Construction Chemicals 2024 & 2032
- Figure 17: Asia Pacific Speciality Chemicals Market Revenue Share (%), by Construction Chemicals 2024 & 2032
- Figure 18: Asia Pacific Speciality Chemicals Market Revenue (Million), by Cosmetic Chemicals 2024 & 2032
- Figure 19: Asia Pacific Speciality Chemicals Market Revenue Share (%), by Cosmetic Chemicals 2024 & 2032
- Figure 20: Asia Pacific Speciality Chemicals Market Revenue (Million), by Dyes, Inks, and Pigments 2024 & 2032
- Figure 21: Asia Pacific Speciality Chemicals Market Revenue Share (%), by Dyes, Inks, and Pigments 2024 & 2032
- Figure 22: Asia Pacific Speciality Chemicals Market Revenue (Million), by Electronic Chemicals 2024 & 2032
- Figure 23: Asia Pacific Speciality Chemicals Market Revenue Share (%), by Electronic Chemicals 2024 & 2032
- Figure 24: Asia Pacific Speciality Chemicals Market Revenue (Million), by Water Treatment Chemicals 2024 & 2032
- Figure 25: Asia Pacific Speciality Chemicals Market Revenue Share (%), by Water Treatment Chemicals 2024 & 2032
- Figure 26: Asia Pacific Speciality Chemicals Market Revenue (Million), by Food Additives 2024 & 2032
- Figure 27: Asia Pacific Speciality Chemicals Market Revenue Share (%), by Food Additives 2024 & 2032
- Figure 28: Asia Pacific Speciality Chemicals Market Revenue (Million), by Agrochemicals 2024 & 2032
- Figure 29: Asia Pacific Speciality Chemicals Market Revenue Share (%), by Agrochemicals 2024 & 2032
- Figure 30: Asia Pacific Speciality Chemicals Market Revenue (Million), by Industrial and Institutional Cleaners 2024 & 2032
- Figure 31: Asia Pacific Speciality Chemicals Market Revenue Share (%), by Industrial and Institutional Cleaners 2024 & 2032
- Figure 32: Asia Pacific Speciality Chemicals Market Revenue (Million), by Lubricant Additives 2024 & 2032
- Figure 33: Asia Pacific Speciality Chemicals Market Revenue Share (%), by Lubricant Additives 2024 & 2032
- Figure 34: Asia Pacific Speciality Chemicals Market Revenue (Million), by Mining Chemicals 2024 & 2032
- Figure 35: Asia Pacific Speciality Chemicals Market Revenue Share (%), by Mining Chemicals 2024 & 2032
- Figure 36: Asia Pacific Speciality Chemicals Market Revenue (Million), by Oilfield Chemicals 2024 & 2032
- Figure 37: Asia Pacific Speciality Chemicals Market Revenue Share (%), by Oilfield Chemicals 2024 & 2032
- Figure 38: Asia Pacific Speciality Chemicals Market Revenue (Million), by Adhesives and Sealants 2024 & 2032
- Figure 39: Asia Pacific Speciality Chemicals Market Revenue Share (%), by Adhesives and Sealants 2024 & 2032
- Figure 40: Asia Pacific Speciality Chemicals Market Revenue (Million), by Plastic Additives 2024 & 2032
- Figure 41: Asia Pacific Speciality Chemicals Market Revenue Share (%), by Plastic Additives 2024 & 2032
- Figure 42: Asia Pacific Speciality Chemicals Market Revenue (Million), by Rubber Processing Chemicals 2024 & 2032
- Figure 43: Asia Pacific Speciality Chemicals Market Revenue Share (%), by Rubber Processing Chemicals 2024 & 2032
- Figure 44: Asia Pacific Speciality Chemicals Market Revenue (Million), by Specialty Polymers 2024 & 2032
- Figure 45: Asia Pacific Speciality Chemicals Market Revenue Share (%), by Specialty Polymers 2024 & 2032
- Figure 46: Asia Pacific Speciality Chemicals Market Revenue (Million), by Textile Chemicals 2024 & 2032
- Figure 47: Asia Pacific Speciality Chemicals Market Revenue Share (%), by Textile Chemicals 2024 & 2032
- Figure 48: Asia Pacific Speciality Chemicals Market Revenue (Million), by Country 2024 & 2032
- Figure 49: Asia Pacific Speciality Chemicals Market Revenue Share (%), by Country 2024 & 2032
- Figure 50: North America Speciality Chemicals Market Revenue (Million), by Paints and Coatings 2024 & 2032
- Figure 51: North America Speciality Chemicals Market Revenue Share (%), by Paints and Coatings 2024 & 2032
- Figure 52: North America Speciality Chemicals Market Revenue (Million), by Catalysts 2024 & 2032
- Figure 53: North America Speciality Chemicals Market Revenue Share (%), by Catalysts 2024 & 2032
- Figure 54: North America Speciality Chemicals Market Revenue (Million), by Construction Chemicals 2024 & 2032
- Figure 55: North America Speciality Chemicals Market Revenue Share (%), by Construction Chemicals 2024 & 2032
- Figure 56: North America Speciality Chemicals Market Revenue (Million), by Cosmetic Chemicals 2024 & 2032
- Figure 57: North America Speciality Chemicals Market Revenue Share (%), by Cosmetic Chemicals 2024 & 2032
- Figure 58: North America Speciality Chemicals Market Revenue (Million), by Dyes, Inks, and Pigments 2024 & 2032
- Figure 59: North America Speciality Chemicals Market Revenue Share (%), by Dyes, Inks, and Pigments 2024 & 2032
- Figure 60: North America Speciality Chemicals Market Revenue (Million), by Electronic Chemicals 2024 & 2032
- Figure 61: North America Speciality Chemicals Market Revenue Share (%), by Electronic Chemicals 2024 & 2032
- Figure 62: North America Speciality Chemicals Market Revenue (Million), by Water Treatment Chemicals 2024 & 2032
- Figure 63: North America Speciality Chemicals Market Revenue Share (%), by Water Treatment Chemicals 2024 & 2032
- Figure 64: North America Speciality Chemicals Market Revenue (Million), by Food Additives 2024 & 2032
- Figure 65: North America Speciality Chemicals Market Revenue Share (%), by Food Additives 2024 & 2032
- Figure 66: North America Speciality Chemicals Market Revenue (Million), by Agrochemicals 2024 & 2032
- Figure 67: North America Speciality Chemicals Market Revenue Share (%), by Agrochemicals 2024 & 2032
- Figure 68: North America Speciality Chemicals Market Revenue (Million), by Industrial and Institutional Cleaners 2024 & 2032
- Figure 69: North America Speciality Chemicals Market Revenue Share (%), by Industrial and Institutional Cleaners 2024 & 2032
- Figure 70: North America Speciality Chemicals Market Revenue (Million), by Lubricant Additives 2024 & 2032
- Figure 71: North America Speciality Chemicals Market Revenue Share (%), by Lubricant Additives 2024 & 2032
- Figure 72: North America Speciality Chemicals Market Revenue (Million), by Mining Chemicals 2024 & 2032
- Figure 73: North America Speciality Chemicals Market Revenue Share (%), by Mining Chemicals 2024 & 2032
- Figure 74: North America Speciality Chemicals Market Revenue (Million), by Oilfield Chemicals 2024 & 2032
- Figure 75: North America Speciality Chemicals Market Revenue Share (%), by Oilfield Chemicals 2024 & 2032
- Figure 76: North America Speciality Chemicals Market Revenue (Million), by Adhesives and Sealants 2024 & 2032
- Figure 77: North America Speciality Chemicals Market Revenue Share (%), by Adhesives and Sealants 2024 & 2032
- Figure 78: North America Speciality Chemicals Market Revenue (Million), by Plastic Additives 2024 & 2032
- Figure 79: North America Speciality Chemicals Market Revenue Share (%), by Plastic Additives 2024 & 2032
- Figure 80: North America Speciality Chemicals Market Revenue (Million), by Rubber Processing Chemicals 2024 & 2032
- Figure 81: North America Speciality Chemicals Market Revenue Share (%), by Rubber Processing Chemicals 2024 & 2032
- Figure 82: North America Speciality Chemicals Market Revenue (Million), by Specialty Polymers 2024 & 2032
- Figure 83: North America Speciality Chemicals Market Revenue Share (%), by Specialty Polymers 2024 & 2032
- Figure 84: North America Speciality Chemicals Market Revenue (Million), by Textile Chemicals 2024 & 2032
- Figure 85: North America Speciality Chemicals Market Revenue Share (%), by Textile Chemicals 2024 & 2032
- Figure 86: North America Speciality Chemicals Market Revenue (Million), by Country 2024 & 2032
- Figure 87: North America Speciality Chemicals Market Revenue Share (%), by Country 2024 & 2032
- Figure 88: Europe Speciality Chemicals Market Revenue (Million), by Paints and Coatings 2024 & 2032
- Figure 89: Europe Speciality Chemicals Market Revenue Share (%), by Paints and Coatings 2024 & 2032
- Figure 90: Europe Speciality Chemicals Market Revenue (Million), by Catalysts 2024 & 2032
- Figure 91: Europe Speciality Chemicals Market Revenue Share (%), by Catalysts 2024 & 2032
- Figure 92: Europe Speciality Chemicals Market Revenue (Million), by Construction Chemicals 2024 & 2032
- Figure 93: Europe Speciality Chemicals Market Revenue Share (%), by Construction Chemicals 2024 & 2032
- Figure 94: Europe Speciality Chemicals Market Revenue (Million), by Cosmetic Chemicals 2024 & 2032
- Figure 95: Europe Speciality Chemicals Market Revenue Share (%), by Cosmetic Chemicals 2024 & 2032
- Figure 96: Europe Speciality Chemicals Market Revenue (Million), by Dyes, Inks, and Pigments 2024 & 2032
- Figure 97: Europe Speciality Chemicals Market Revenue Share (%), by Dyes, Inks, and Pigments 2024 & 2032
- Figure 98: Europe Speciality Chemicals Market Revenue (Million), by Electronic Chemicals 2024 & 2032
- Figure 99: Europe Speciality Chemicals Market Revenue Share (%), by Electronic Chemicals 2024 & 2032
- Figure 100: Europe Speciality Chemicals Market Revenue (Million), by Water Treatment Chemicals 2024 & 2032
- Figure 101: Europe Speciality Chemicals Market Revenue Share (%), by Water Treatment Chemicals 2024 & 2032
- Figure 102: Europe Speciality Chemicals Market Revenue (Million), by Food Additives 2024 & 2032
- Figure 103: Europe Speciality Chemicals Market Revenue Share (%), by Food Additives 2024 & 2032
- Figure 104: Europe Speciality Chemicals Market Revenue (Million), by Agrochemicals 2024 & 2032
- Figure 105: Europe Speciality Chemicals Market Revenue Share (%), by Agrochemicals 2024 & 2032
- Figure 106: Europe Speciality Chemicals Market Revenue (Million), by Industrial and Institutional Cleaners 2024 & 2032
- Figure 107: Europe Speciality Chemicals Market Revenue Share (%), by Industrial and Institutional Cleaners 2024 & 2032
- Figure 108: Europe Speciality Chemicals Market Revenue (Million), by Lubricant Additives 2024 & 2032
- Figure 109: Europe Speciality Chemicals Market Revenue Share (%), by Lubricant Additives 2024 & 2032
- Figure 110: Europe Speciality Chemicals Market Revenue (Million), by Mining Chemicals 2024 & 2032
- Figure 111: Europe Speciality Chemicals Market Revenue Share (%), by Mining Chemicals 2024 & 2032
- Figure 112: Europe Speciality Chemicals Market Revenue (Million), by Oilfield Chemicals 2024 & 2032
- Figure 113: Europe Speciality Chemicals Market Revenue Share (%), by Oilfield Chemicals 2024 & 2032
- Figure 114: Europe Speciality Chemicals Market Revenue (Million), by Adhesives and Sealants 2024 & 2032
- Figure 115: Europe Speciality Chemicals Market Revenue Share (%), by Adhesives and Sealants 2024 & 2032
- Figure 116: Europe Speciality Chemicals Market Revenue (Million), by Plastic Additives 2024 & 2032
- Figure 117: Europe Speciality Chemicals Market Revenue Share (%), by Plastic Additives 2024 & 2032
- Figure 118: Europe Speciality Chemicals Market Revenue (Million), by Rubber Processing Chemicals 2024 & 2032
- Figure 119: Europe Speciality Chemicals Market Revenue Share (%), by Rubber Processing Chemicals 2024 & 2032
- Figure 120: Europe Speciality Chemicals Market Revenue (Million), by Specialty Polymers 2024 & 2032
- Figure 121: Europe Speciality Chemicals Market Revenue Share (%), by Specialty Polymers 2024 & 2032
- Figure 122: Europe Speciality Chemicals Market Revenue (Million), by Textile Chemicals 2024 & 2032
- Figure 123: Europe Speciality Chemicals Market Revenue Share (%), by Textile Chemicals 2024 & 2032
- Figure 124: Europe Speciality Chemicals Market Revenue (Million), by Country 2024 & 2032
- Figure 125: Europe Speciality Chemicals Market Revenue Share (%), by Country 2024 & 2032
- Figure 126: South America Speciality Chemicals Market Revenue (Million), by Paints and Coatings 2024 & 2032
- Figure 127: South America Speciality Chemicals Market Revenue Share (%), by Paints and Coatings 2024 & 2032
- Figure 128: South America Speciality Chemicals Market Revenue (Million), by Catalysts 2024 & 2032
- Figure 129: South America Speciality Chemicals Market Revenue Share (%), by Catalysts 2024 & 2032
- Figure 130: South America Speciality Chemicals Market Revenue (Million), by Construction Chemicals 2024 & 2032
- Figure 131: South America Speciality Chemicals Market Revenue Share (%), by Construction Chemicals 2024 & 2032
- Figure 132: South America Speciality Chemicals Market Revenue (Million), by Cosmetic Chemicals 2024 & 2032
- Figure 133: South America Speciality Chemicals Market Revenue Share (%), by Cosmetic Chemicals 2024 & 2032
- Figure 134: South America Speciality Chemicals Market Revenue (Million), by Dyes, Inks, and Pigments 2024 & 2032
- Figure 135: South America Speciality Chemicals Market Revenue Share (%), by Dyes, Inks, and Pigments 2024 & 2032
- Figure 136: South America Speciality Chemicals Market Revenue (Million), by Electronic Chemicals 2024 & 2032
- Figure 137: South America Speciality Chemicals Market Revenue Share (%), by Electronic Chemicals 2024 & 2032
- Figure 138: South America Speciality Chemicals Market Revenue (Million), by Water Treatment Chemicals 2024 & 2032
- Figure 139: South America Speciality Chemicals Market Revenue Share (%), by Water Treatment Chemicals 2024 & 2032
- Figure 140: South America Speciality Chemicals Market Revenue (Million), by Food Additives 2024 & 2032
- Figure 141: South America Speciality Chemicals Market Revenue Share (%), by Food Additives 2024 & 2032
- Figure 142: South America Speciality Chemicals Market Revenue (Million), by Agrochemicals 2024 & 2032
- Figure 143: South America Speciality Chemicals Market Revenue Share (%), by Agrochemicals 2024 & 2032
- Figure 144: South America Speciality Chemicals Market Revenue (Million), by Industrial and Institutional Cleaners 2024 & 2032
- Figure 145: South America Speciality Chemicals Market Revenue Share (%), by Industrial and Institutional Cleaners 2024 & 2032
- Figure 146: South America Speciality Chemicals Market Revenue (Million), by Lubricant Additives 2024 & 2032
- Figure 147: South America Speciality Chemicals Market Revenue Share (%), by Lubricant Additives 2024 & 2032
- Figure 148: South America Speciality Chemicals Market Revenue (Million), by Mining Chemicals 2024 & 2032
- Figure 149: South America Speciality Chemicals Market Revenue Share (%), by Mining Chemicals 2024 & 2032
- Figure 150: South America Speciality Chemicals Market Revenue (Million), by Oilfield Chemicals 2024 & 2032
- Figure 151: South America Speciality Chemicals Market Revenue Share (%), by Oilfield Chemicals 2024 & 2032
- Figure 152: South America Speciality Chemicals Market Revenue (Million), by Adhesives and Sealants 2024 & 2032
- Figure 153: South America Speciality Chemicals Market Revenue Share (%), by Adhesives and Sealants 2024 & 2032
- Figure 154: South America Speciality Chemicals Market Revenue (Million), by Plastic Additives 2024 & 2032
- Figure 155: South America Speciality Chemicals Market Revenue Share (%), by Plastic Additives 2024 & 2032
- Figure 156: South America Speciality Chemicals Market Revenue (Million), by Rubber Processing Chemicals 2024 & 2032
- Figure 157: South America Speciality Chemicals Market Revenue Share (%), by Rubber Processing Chemicals 2024 & 2032
- Figure 158: South America Speciality Chemicals Market Revenue (Million), by Specialty Polymers 2024 & 2032
- Figure 159: South America Speciality Chemicals Market Revenue Share (%), by Specialty Polymers 2024 & 2032
- Figure 160: South America Speciality Chemicals Market Revenue (Million), by Textile Chemicals 2024 & 2032
- Figure 161: South America Speciality Chemicals Market Revenue Share (%), by Textile Chemicals 2024 & 2032
- Figure 162: South America Speciality Chemicals Market Revenue (Million), by Country 2024 & 2032
- Figure 163: South America Speciality Chemicals Market Revenue Share (%), by Country 2024 & 2032
- Figure 164: Middle East and Africa Speciality Chemicals Market Revenue (Million), by Paints and Coatings 2024 & 2032
- Figure 165: Middle East and Africa Speciality Chemicals Market Revenue Share (%), by Paints and Coatings 2024 & 2032
- Figure 166: Middle East and Africa Speciality Chemicals Market Revenue (Million), by Catalysts 2024 & 2032
- Figure 167: Middle East and Africa Speciality Chemicals Market Revenue Share (%), by Catalysts 2024 & 2032
- Figure 168: Middle East and Africa Speciality Chemicals Market Revenue (Million), by Construction Chemicals 2024 & 2032
- Figure 169: Middle East and Africa Speciality Chemicals Market Revenue Share (%), by Construction Chemicals 2024 & 2032
- Figure 170: Middle East and Africa Speciality Chemicals Market Revenue (Million), by Cosmetic Chemicals 2024 & 2032
- Figure 171: Middle East and Africa Speciality Chemicals Market Revenue Share (%), by Cosmetic Chemicals 2024 & 2032
- Figure 172: Middle East and Africa Speciality Chemicals Market Revenue (Million), by Dyes, Inks, and Pigments 2024 & 2032
- Figure 173: Middle East and Africa Speciality Chemicals Market Revenue Share (%), by Dyes, Inks, and Pigments 2024 & 2032
- Figure 174: Middle East and Africa Speciality Chemicals Market Revenue (Million), by Electronic Chemicals 2024 & 2032
- Figure 175: Middle East and Africa Speciality Chemicals Market Revenue Share (%), by Electronic Chemicals 2024 & 2032
- Figure 176: Middle East and Africa Speciality Chemicals Market Revenue (Million), by Water Treatment Chemicals 2024 & 2032
- Figure 177: Middle East and Africa Speciality Chemicals Market Revenue Share (%), by Water Treatment Chemicals 2024 & 2032
- Figure 178: Middle East and Africa Speciality Chemicals Market Revenue (Million), by Food Additives 2024 & 2032
- Figure 179: Middle East and Africa Speciality Chemicals Market Revenue Share (%), by Food Additives 2024 & 2032
- Figure 180: Middle East and Africa Speciality Chemicals Market Revenue (Million), by Agrochemicals 2024 & 2032
- Figure 181: Middle East and Africa Speciality Chemicals Market Revenue Share (%), by Agrochemicals 2024 & 2032
- Figure 182: Middle East and Africa Speciality Chemicals Market Revenue (Million), by Industrial and Institutional Cleaners 2024 & 2032
- Figure 183: Middle East and Africa Speciality Chemicals Market Revenue Share (%), by Industrial and Institutional Cleaners 2024 & 2032
- Figure 184: Middle East and Africa Speciality Chemicals Market Revenue (Million), by Lubricant Additives 2024 & 2032
- Figure 185: Middle East and Africa Speciality Chemicals Market Revenue Share (%), by Lubricant Additives 2024 & 2032
- Figure 186: Middle East and Africa Speciality Chemicals Market Revenue (Million), by Mining Chemicals 2024 & 2032
- Figure 187: Middle East and Africa Speciality Chemicals Market Revenue Share (%), by Mining Chemicals 2024 & 2032
- Figure 188: Middle East and Africa Speciality Chemicals Market Revenue (Million), by Oilfield Chemicals 2024 & 2032
- Figure 189: Middle East and Africa Speciality Chemicals Market Revenue Share (%), by Oilfield Chemicals 2024 & 2032
- Figure 190: Middle East and Africa Speciality Chemicals Market Revenue (Million), by Adhesives and Sealants 2024 & 2032
- Figure 191: Middle East and Africa Speciality Chemicals Market Revenue Share (%), by Adhesives and Sealants 2024 & 2032
- Figure 192: Middle East and Africa Speciality Chemicals Market Revenue (Million), by Plastic Additives 2024 & 2032
- Figure 193: Middle East and Africa Speciality Chemicals Market Revenue Share (%), by Plastic Additives 2024 & 2032
- Figure 194: Middle East and Africa Speciality Chemicals Market Revenue (Million), by Rubber Processing Chemicals 2024 & 2032
- Figure 195: Middle East and Africa Speciality Chemicals Market Revenue Share (%), by Rubber Processing Chemicals 2024 & 2032
- Figure 196: Middle East and Africa Speciality Chemicals Market Revenue (Million), by Specialty Polymers 2024 & 2032
- Figure 197: Middle East and Africa Speciality Chemicals Market Revenue Share (%), by Specialty Polymers 2024 & 2032
- Figure 198: Middle East and Africa Speciality Chemicals Market Revenue (Million), by Textile Chemicals 2024 & 2032
- Figure 199: Middle East and Africa Speciality Chemicals Market Revenue Share (%), by Textile Chemicals 2024 & 2032
- Figure 200: Middle East and Africa Speciality Chemicals Market Revenue (Million), by Country 2024 & 2032
- Figure 201: Middle East and Africa Speciality Chemicals Market Revenue Share (%), by Country 2024 & 2032
List of Tables
- Table 1: Global Speciality Chemicals Market Revenue Million Forecast, by Region 2019 & 2032
- Table 2: Global Speciality Chemicals Market Revenue Million Forecast, by Paints and Coatings 2019 & 2032
- Table 3: Global Speciality Chemicals Market Revenue Million Forecast, by Catalysts 2019 & 2032
- Table 4: Global Speciality Chemicals Market Revenue Million Forecast, by Construction Chemicals 2019 & 2032
- Table 5: Global Speciality Chemicals Market Revenue Million Forecast, by Cosmetic Chemicals 2019 & 2032
- Table 6: Global Speciality Chemicals Market Revenue Million Forecast, by Dyes, Inks, and Pigments 2019 & 2032
- Table 7: Global Speciality Chemicals Market Revenue Million Forecast, by Electronic Chemicals 2019 & 2032
- Table 8: Global Speciality Chemicals Market Revenue Million Forecast, by Water Treatment Chemicals 2019 & 2032
- Table 9: Global Speciality Chemicals Market Revenue Million Forecast, by Food Additives 2019 & 2032
- Table 10: Global Speciality Chemicals Market Revenue Million Forecast, by Agrochemicals 2019 & 2032
- Table 11: Global Speciality Chemicals Market Revenue Million Forecast, by Industrial and Institutional Cleaners 2019 & 2032
- Table 12: Global Speciality Chemicals Market Revenue Million Forecast, by Lubricant Additives 2019 & 2032
- Table 13: Global Speciality Chemicals Market Revenue Million Forecast, by Mining Chemicals 2019 & 2032
- Table 14: Global Speciality Chemicals Market Revenue Million Forecast, by Oilfield Chemicals 2019 & 2032
- Table 15: Global Speciality Chemicals Market Revenue Million Forecast, by Adhesives and Sealants 2019 & 2032
- Table 16: Global Speciality Chemicals Market Revenue Million Forecast, by Plastic Additives 2019 & 2032
- Table 17: Global Speciality Chemicals Market Revenue Million Forecast, by Rubber Processing Chemicals 2019 & 2032
- Table 18: Global Speciality Chemicals Market Revenue Million Forecast, by Specialty Polymers 2019 & 2032
- Table 19: Global Speciality Chemicals Market Revenue Million Forecast, by Textile Chemicals 2019 & 2032
- Table 20: Global Speciality Chemicals Market Revenue Million Forecast, by Region 2019 & 2032
- Table 21: Global Speciality Chemicals Market Revenue Million Forecast, by Country 2019 & 2032
- Table 22: China Speciality Chemicals Market Revenue (Million) Forecast, by Application 2019 & 2032
- Table 23: India Speciality Chemicals Market Revenue (Million) Forecast, by Application 2019 & 2032
- Table 24: Japan Speciality Chemicals Market Revenue (Million) Forecast, by Application 2019 & 2032
- Table 25: South Korea Speciality Chemicals Market Revenue (Million) Forecast, by Application 2019 & 2032
- Table 26: ASEAN Countries Speciality Chemicals Market Revenue (Million) Forecast, by Application 2019 & 2032
- Table 27: Rest of Asia Pacific Speciality Chemicals Market Revenue (Million) Forecast, by Application 2019 & 2032
- Table 28: Global Speciality Chemicals Market Revenue Million Forecast, by Country 2019 & 2032
- Table 29: United States Speciality Chemicals Market Revenue (Million) Forecast, by Application 2019 & 2032
- Table 30: Canada Speciality Chemicals Market Revenue (Million) Forecast, by Application 2019 & 2032
- Table 31: Mexico Speciality Chemicals Market Revenue (Million) Forecast, by Application 2019 & 2032
- Table 32: Rest of North America Speciality Chemicals Market Revenue (Million) Forecast, by Application 2019 & 2032
- Table 33: Global Speciality Chemicals Market Revenue Million Forecast, by Country 2019 & 2032
- Table 34: Germany Speciality Chemicals Market Revenue (Million) Forecast, by Application 2019 & 2032
- Table 35: United Kingdom Speciality Chemicals Market Revenue (Million) Forecast, by Application 2019 & 2032
- Table 36: Italy Speciality Chemicals Market Revenue (Million) Forecast, by Application 2019 & 2032
- Table 37: France Speciality Chemicals Market Revenue (Million) Forecast, by Application 2019 & 2032
- Table 38: Spain Speciality Chemicals Market Revenue (Million) Forecast, by Application 2019 & 2032
- Table 39: Rest of Europe Speciality Chemicals Market Revenue (Million) Forecast, by Application 2019 & 2032
- Table 40: Global Speciality Chemicals Market Revenue Million Forecast, by Country 2019 & 2032
- Table 41: Brazil Speciality Chemicals Market Revenue (Million) Forecast, by Application 2019 & 2032
- Table 42: Argentina Speciality Chemicals Market Revenue (Million) Forecast, by Application 2019 & 2032
- Table 43: Rest of South America Speciality Chemicals Market Revenue (Million) Forecast, by Application 2019 & 2032
- Table 44: Global Speciality Chemicals Market Revenue Million Forecast, by Country 2019 & 2032
- Table 45: Saudi Arabia Speciality Chemicals Market Revenue (Million) Forecast, by Application 2019 & 2032
- Table 46: South Africa Speciality Chemicals Market Revenue (Million) Forecast, by Application 2019 & 2032
- Table 47: Rest of Middle East and Africa Speciality Chemicals Market Revenue (Million) Forecast, by Application 2019 & 2032
- Table 48: Global Speciality Chemicals Market Revenue Million Forecast, by Paints and Coatings 2019 & 2032
- Table 49: Global Speciality Chemicals Market Revenue Million Forecast, by Catalysts 2019 & 2032
- Table 50: Global Speciality Chemicals Market Revenue Million Forecast, by Construction Chemicals 2019 & 2032
- Table 51: Global Speciality Chemicals Market Revenue Million Forecast, by Cosmetic Chemicals 2019 & 2032
- Table 52: Global Speciality Chemicals Market Revenue Million Forecast, by Dyes, Inks, and Pigments 2019 & 2032
- Table 53: Global Speciality Chemicals Market Revenue Million Forecast, by Electronic Chemicals 2019 & 2032
- Table 54: Global Speciality Chemicals Market Revenue Million Forecast, by Water Treatment Chemicals 2019 & 2032
- Table 55: Global Speciality Chemicals Market Revenue Million Forecast, by Food Additives 2019 & 2032
- Table 56: Global Speciality Chemicals Market Revenue Million Forecast, by Agrochemicals 2019 & 2032
- Table 57: Global Speciality Chemicals Market Revenue Million Forecast, by Industrial and Institutional Cleaners 2019 & 2032
- Table 58: Global Speciality Chemicals Market Revenue Million Forecast, by Lubricant Additives 2019 & 2032
- Table 59: Global Speciality Chemicals Market Revenue Million Forecast, by Mining Chemicals 2019 & 2032
- Table 60: Global Speciality Chemicals Market Revenue Million Forecast, by Oilfield Chemicals 2019 & 2032
- Table 61: Global Speciality Chemicals Market Revenue Million Forecast, by Adhesives and Sealants 2019 & 2032
- Table 62: Global Speciality Chemicals Market Revenue Million Forecast, by Plastic Additives 2019 & 2032
- Table 63: Global Speciality Chemicals Market Revenue Million Forecast, by Rubber Processing Chemicals 2019 & 2032
- Table 64: Global Speciality Chemicals Market Revenue Million Forecast, by Specialty Polymers 2019 & 2032
- Table 65: Global Speciality Chemicals Market Revenue Million Forecast, by Textile Chemicals 2019 & 2032
- Table 66: Global Speciality Chemicals Market Revenue Million Forecast, by Country 2019 & 2032
- Table 67: China Speciality Chemicals Market Revenue (Million) Forecast, by Application 2019 & 2032
- Table 68: India Speciality Chemicals Market Revenue (Million) Forecast, by Application 2019 & 2032
- Table 69: Japan Speciality Chemicals Market Revenue (Million) Forecast, by Application 2019 & 2032
- Table 70: South Korea Speciality Chemicals Market Revenue (Million) Forecast, by Application 2019 & 2032
- Table 71: ASEAN Countries Speciality Chemicals Market Revenue (Million) Forecast, by Application 2019 & 2032
- Table 72: Rest of Asia Pacific Speciality Chemicals Market Revenue (Million) Forecast, by Application 2019 & 2032
- Table 73: Global Speciality Chemicals Market Revenue Million Forecast, by Paints and Coatings 2019 & 2032
- Table 74: Global Speciality Chemicals Market Revenue Million Forecast, by Catalysts 2019 & 2032
- Table 75: Global Speciality Chemicals Market Revenue Million Forecast, by Construction Chemicals 2019 & 2032
- Table 76: Global Speciality Chemicals Market Revenue Million Forecast, by Cosmetic Chemicals 2019 & 2032
- Table 77: Global Speciality Chemicals Market Revenue Million Forecast, by Dyes, Inks, and Pigments 2019 & 2032
- Table 78: Global Speciality Chemicals Market Revenue Million Forecast, by Electronic Chemicals 2019 & 2032
- Table 79: Global Speciality Chemicals Market Revenue Million Forecast, by Water Treatment Chemicals 2019 & 2032
- Table 80: Global Speciality Chemicals Market Revenue Million Forecast, by Food Additives 2019 & 2032
- Table 81: Global Speciality Chemicals Market Revenue Million Forecast, by Agrochemicals 2019 & 2032
- Table 82: Global Speciality Chemicals Market Revenue Million Forecast, by Industrial and Institutional Cleaners 2019 & 2032
- Table 83: Global Speciality Chemicals Market Revenue Million Forecast, by Lubricant Additives 2019 & 2032
- Table 84: Global Speciality Chemicals Market Revenue Million Forecast, by Mining Chemicals 2019 & 2032
- Table 85: Global Speciality Chemicals Market Revenue Million Forecast, by Oilfield Chemicals 2019 & 2032
- Table 86: Global Speciality Chemicals Market Revenue Million Forecast, by Adhesives and Sealants 2019 & 2032
- Table 87: Global Speciality Chemicals Market Revenue Million Forecast, by Plastic Additives 2019 & 2032
- Table 88: Global Speciality Chemicals Market Revenue Million Forecast, by Rubber Processing Chemicals 2019 & 2032
- Table 89: Global Speciality Chemicals Market Revenue Million Forecast, by Specialty Polymers 2019 & 2032
- Table 90: Global Speciality Chemicals Market Revenue Million Forecast, by Textile Chemicals 2019 & 2032
- Table 91: Global Speciality Chemicals Market Revenue Million Forecast, by Country 2019 & 2032
- Table 92: United States Speciality Chemicals Market Revenue (Million) Forecast, by Application 2019 & 2032
- Table 93: Canada Speciality Chemicals Market Revenue (Million) Forecast, by Application 2019 & 2032
- Table 94: Mexico Speciality Chemicals Market Revenue (Million) Forecast, by Application 2019 & 2032
- Table 95: Rest of North America Speciality Chemicals Market Revenue (Million) Forecast, by Application 2019 & 2032
- Table 96: Global Speciality Chemicals Market Revenue Million Forecast, by Paints and Coatings 2019 & 2032
- Table 97: Global Speciality Chemicals Market Revenue Million Forecast, by Catalysts 2019 & 2032
- Table 98: Global Speciality Chemicals Market Revenue Million Forecast, by Construction Chemicals 2019 & 2032
- Table 99: Global Speciality Chemicals Market Revenue Million Forecast, by Cosmetic Chemicals 2019 & 2032
- Table 100: Global Speciality Chemicals Market Revenue Million Forecast, by Dyes, Inks, and Pigments 2019 & 2032
- Table 101: Global Speciality Chemicals Market Revenue Million Forecast, by Electronic Chemicals 2019 & 2032
- Table 102: Global Speciality Chemicals Market Revenue Million Forecast, by Water Treatment Chemicals 2019 & 2032
- Table 103: Global Speciality Chemicals Market Revenue Million Forecast, by Food Additives 2019 & 2032
- Table 104: Global Speciality Chemicals Market Revenue Million Forecast, by Agrochemicals 2019 & 2032
- Table 105: Global Speciality Chemicals Market Revenue Million Forecast, by Industrial and Institutional Cleaners 2019 & 2032
- Table 106: Global Speciality Chemicals Market Revenue Million Forecast, by Lubricant Additives 2019 & 2032
- Table 107: Global Speciality Chemicals Market Revenue Million Forecast, by Mining Chemicals 2019 & 2032
- Table 108: Global Speciality Chemicals Market Revenue Million Forecast, by Oilfield Chemicals 2019 & 2032
- Table 109: Global Speciality Chemicals Market Revenue Million Forecast, by Adhesives and Sealants 2019 & 2032
- Table 110: Global Speciality Chemicals Market Revenue Million Forecast, by Plastic Additives 2019 & 2032
- Table 111: Global Speciality Chemicals Market Revenue Million Forecast, by Rubber Processing Chemicals 2019 & 2032
- Table 112: Global Speciality Chemicals Market Revenue Million Forecast, by Specialty Polymers 2019 & 2032
- Table 113: Global Speciality Chemicals Market Revenue Million Forecast, by Textile Chemicals 2019 & 2032
- Table 114: Global Speciality Chemicals Market Revenue Million Forecast, by Country 2019 & 2032
- Table 115: Germany Speciality Chemicals Market Revenue (Million) Forecast, by Application 2019 & 2032
- Table 116: United Kingdom Speciality Chemicals Market Revenue (Million) Forecast, by Application 2019 & 2032
- Table 117: Italy Speciality Chemicals Market Revenue (Million) Forecast, by Application 2019 & 2032
- Table 118: France Speciality Chemicals Market Revenue (Million) Forecast, by Application 2019 & 2032
- Table 119: Spain Speciality Chemicals Market Revenue (Million) Forecast, by Application 2019 & 2032
- Table 120: Rest of Europe Speciality Chemicals Market Revenue (Million) Forecast, by Application 2019 & 2032
- Table 121: Global Speciality Chemicals Market Revenue Million Forecast, by Paints and Coatings 2019 & 2032
- Table 122: Global Speciality Chemicals Market Revenue Million Forecast, by Catalysts 2019 & 2032
- Table 123: Global Speciality Chemicals Market Revenue Million Forecast, by Construction Chemicals 2019 & 2032
- Table 124: Global Speciality Chemicals Market Revenue Million Forecast, by Cosmetic Chemicals 2019 & 2032
- Table 125: Global Speciality Chemicals Market Revenue Million Forecast, by Dyes, Inks, and Pigments 2019 & 2032
- Table 126: Global Speciality Chemicals Market Revenue Million Forecast, by Electronic Chemicals 2019 & 2032
- Table 127: Global Speciality Chemicals Market Revenue Million Forecast, by Water Treatment Chemicals 2019 & 2032
- Table 128: Global Speciality Chemicals Market Revenue Million Forecast, by Food Additives 2019 & 2032
- Table 129: Global Speciality Chemicals Market Revenue Million Forecast, by Agrochemicals 2019 & 2032
- Table 130: Global Speciality Chemicals Market Revenue Million Forecast, by Industrial and Institutional Cleaners 2019 & 2032
- Table 131: Global Speciality Chemicals Market Revenue Million Forecast, by Lubricant Additives 2019 & 2032
- Table 132: Global Speciality Chemicals Market Revenue Million Forecast, by Mining Chemicals 2019 & 2032
- Table 133: Global Speciality Chemicals Market Revenue Million Forecast, by Oilfield Chemicals 2019 & 2032
- Table 134: Global Speciality Chemicals Market Revenue Million Forecast, by Adhesives and Sealants 2019 & 2032
- Table 135: Global Speciality Chemicals Market Revenue Million Forecast, by Plastic Additives 2019 & 2032
- Table 136: Global Speciality Chemicals Market Revenue Million Forecast, by Rubber Processing Chemicals 2019 & 2032
- Table 137: Global Speciality Chemicals Market Revenue Million Forecast, by Specialty Polymers 2019 & 2032
- Table 138: Global Speciality Chemicals Market Revenue Million Forecast, by Textile Chemicals 2019 & 2032
- Table 139: Global Speciality Chemicals Market Revenue Million Forecast, by Country 2019 & 2032
- Table 140: Brazil Speciality Chemicals Market Revenue (Million) Forecast, by Application 2019 & 2032
- Table 141: Argentina Speciality Chemicals Market Revenue (Million) Forecast, by Application 2019 & 2032
- Table 142: Rest of South America Speciality Chemicals Market Revenue (Million) Forecast, by Application 2019 & 2032
- Table 143: Global Speciality Chemicals Market Revenue Million Forecast, by Paints and Coatings 2019 & 2032
- Table 144: Global Speciality Chemicals Market Revenue Million Forecast, by Catalysts 2019 & 2032
- Table 145: Global Speciality Chemicals Market Revenue Million Forecast, by Construction Chemicals 2019 & 2032
- Table 146: Global Speciality Chemicals Market Revenue Million Forecast, by Cosmetic Chemicals 2019 & 2032
- Table 147: Global Speciality Chemicals Market Revenue Million Forecast, by Dyes, Inks, and Pigments 2019 & 2032
- Table 148: Global Speciality Chemicals Market Revenue Million Forecast, by Electronic Chemicals 2019 & 2032
- Table 149: Global Speciality Chemicals Market Revenue Million Forecast, by Water Treatment Chemicals 2019 & 2032
- Table 150: Global Speciality Chemicals Market Revenue Million Forecast, by Food Additives 2019 & 2032
- Table 151: Global Speciality Chemicals Market Revenue Million Forecast, by Agrochemicals 2019 & 2032
- Table 152: Global Speciality Chemicals Market Revenue Million Forecast, by Industrial and Institutional Cleaners 2019 & 2032
- Table 153: Global Speciality Chemicals Market Revenue Million Forecast, by Lubricant Additives 2019 & 2032
- Table 154: Global Speciality Chemicals Market Revenue Million Forecast, by Mining Chemicals 2019 & 2032
- Table 155: Global Speciality Chemicals Market Revenue Million Forecast, by Oilfield Chemicals 2019 & 2032
- Table 156: Global Speciality Chemicals Market Revenue Million Forecast, by Adhesives and Sealants 2019 & 2032
- Table 157: Global Speciality Chemicals Market Revenue Million Forecast, by Plastic Additives 2019 & 2032
- Table 158: Global Speciality Chemicals Market Revenue Million Forecast, by Rubber Processing Chemicals 2019 & 2032
- Table 159: Global Speciality Chemicals Market Revenue Million Forecast, by Specialty Polymers 2019 & 2032
- Table 160: Global Speciality Chemicals Market Revenue Million Forecast, by Textile Chemicals 2019 & 2032
- Table 161: Global Speciality Chemicals Market Revenue Million Forecast, by Country 2019 & 2032
- Table 162: Saudi Arabia Speciality Chemicals Market Revenue (Million) Forecast, by Application 2019 & 2032
- Table 163: South Africa Speciality Chemicals Market Revenue (Million) Forecast, by Application 2019 & 2032
- Table 164: Rest of Middle East and Africa Speciality Chemicals Market Revenue (Million) Forecast, by Application 2019 & 2032
Frequently Asked Questions
1. What is the projected Compound Annual Growth Rate (CAGR) of the Speciality Chemicals Market?
The projected CAGR is approximately 3.31%.
2. Which companies are prominent players in the Speciality Chemicals Market?
Key companies in the market include Ferro Corporation, Infineum International Limited, Henkel AG & Co KGaA, DIC Corporation, Corteva, Clariant, Ecolab, GCP Applied Technologies Inc, Holcim, Nouryon.
3. What are the main segments of the Speciality Chemicals Market?
The market segments include Paints and Coatings, Catalysts, Construction Chemicals, Cosmetic Chemicals, Dyes, Inks, and Pigments, Electronic Chemicals, Water Treatment Chemicals, Food Additives, Agrochemicals, Industrial and Institutional Cleaners, Lubricant Additives, Mining Chemicals, Oilfield Chemicals, Adhesives and Sealants, Plastic Additives, Rubber Processing Chemicals, Specialty Polymers, Textile Chemicals.
4. Can you provide details about the market size?
The market size is estimated to be USD 1.07 Million as of 2022.
5. What are some drivers contributing to market growth?
Robust Growth of Construction Activities in Asia-Pacific. and Middle East and Africa; Growing Population is Propelling the Demand for Food Worldwide.
6. What are the notable trends driving market growth?
Agrochemicals Segment to Dominate the Market Demand.
7. Are there any restraints impacting market growth?
Low Resistance to Extreme Weather Conditions; Rising Global Regulations on its Usage.
8. Can you provide examples of recent developments in the market?
December 2022: Clariant AG announced to strengthen its position in China and expand its care chemicals facility in the country, including pharmaceutical, personal care, home care, and industrial applications. The company provides care chemicals under its specialty segment.
9. What pricing options are available for accessing the report?
Pricing options include single-user, multi-user, and enterprise licenses priced at USD 4750, USD 5250, and USD 8750 respectively.
10. Is the market size provided in terms of value or volume?
The market size is provided in terms of value, measured in Million.
11. Are there any specific market keywords associated with the report?
Yes, the market keyword associated with the report is "Speciality Chemicals Market," which aids in identifying and referencing the specific market segment covered.
12. How do I determine which pricing option suits my needs best?
The pricing options vary based on user requirements and access needs. Individual users may opt for single-user licenses, while businesses requiring broader access may choose multi-user or enterprise licenses for cost-effective access to the report.
13. Are there any additional resources or data provided in the Speciality Chemicals Market report?
While the report offers comprehensive insights, it's advisable to review the specific contents or supplementary materials provided to ascertain if additional resources or data are available.
14. How can I stay updated on further developments or reports in the Speciality Chemicals Market?
To stay informed about further developments, trends, and reports in the Speciality Chemicals Market, consider subscribing to industry newsletters, following relevant companies and organizations, or regularly checking reputable industry news sources and publications.
Methodology
Step 1 - Identification of Relevant Samples Size from Population Database


Step 2 - Approaches for Defining Global Market Size (Value, Volume* & Price*)

Note*: In applicable scenarios
Step 3 - Data Sources
Primary Research
- Web Analytics
- Survey Reports
- Research Institute
- Latest Research Reports
- Opinion Leaders
Secondary Research
- Annual Reports
- White Paper
- Latest Press Release
- Industry Association
- Paid Database
- Investor Presentations

Step 4 - Data Triangulation
Involves using different sources of information in order to increase the validity of a study
These sources are likely to be stakeholders in a program - participants, other researchers, program staff, other community members, and so on.
Then we put all data in single framework & apply various statistical tools to find out the dynamic on the market.
During the analysis stage, feedback from the stakeholder groups would be compared to determine areas of agreement as well as areas of divergence
