

Key Insights
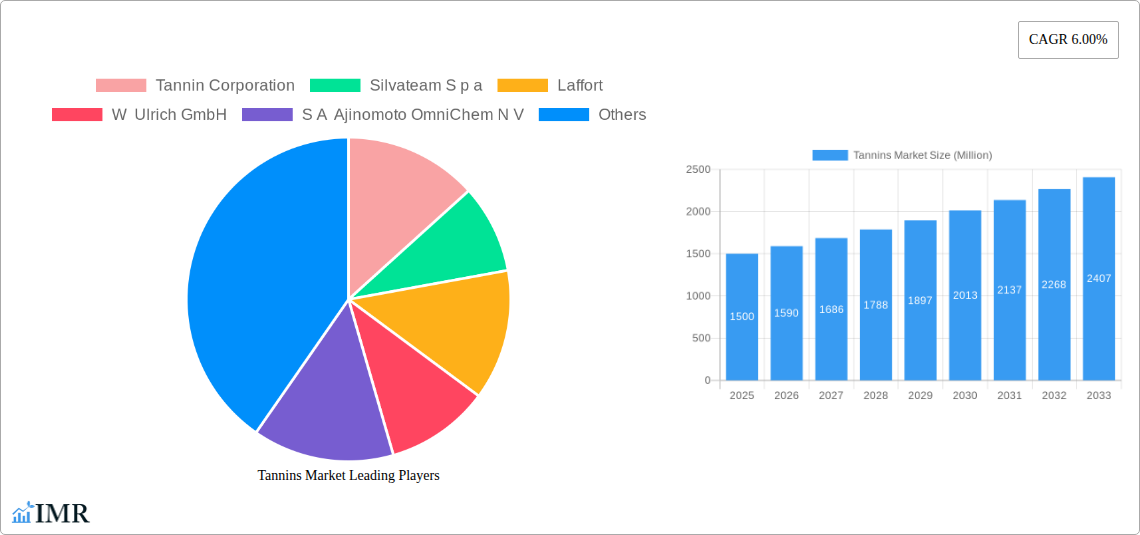
The global tannins market, valued at approximately $XX million in 2025, is projected to experience robust growth, exhibiting a Compound Annual Growth Rate (CAGR) of 6.00% from 2025 to 2033. This expansion is driven by several key factors. The increasing demand for natural and sustainable ingredients in the food and beverage industry is a significant catalyst, with natural tannin extracts gaining preference over synthetic alternatives due to consumer preference for clean-label products. Furthermore, the burgeoning pharmaceutical and leather industries are contributing to market growth, leveraging tannins' inherent properties for applications such as drug delivery systems and leather tanning respectively. Growth is further fueled by ongoing research exploring new applications of tannins in diverse sectors, potentially unlocking new market segments and accelerating overall market expansion.
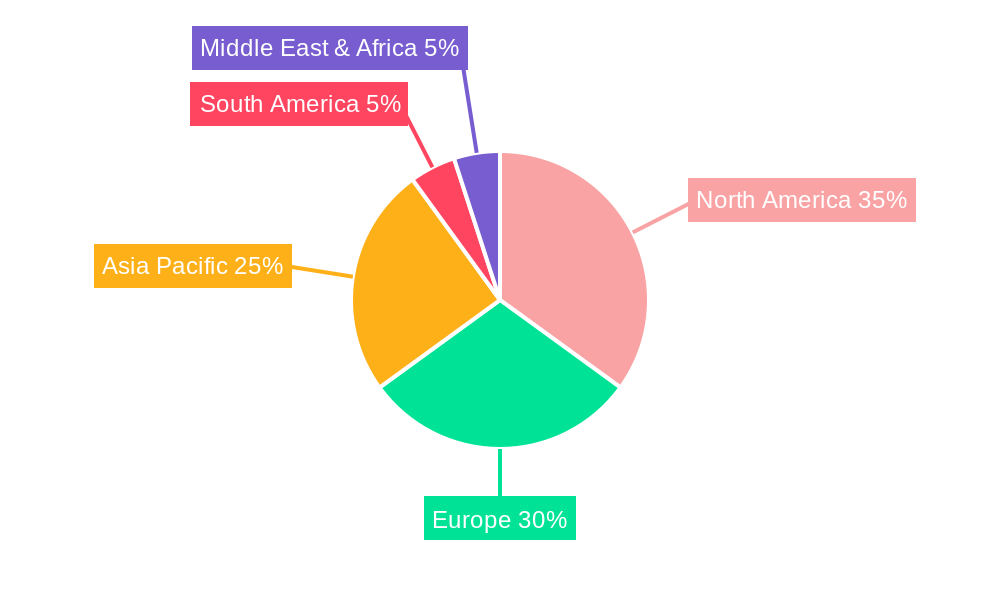
However, certain restraints are expected to influence market trajectory. Fluctuations in raw material prices, particularly for natural tannin extracts, can impact profitability and market stability. Additionally, the competitive landscape, characterized by established players like Tannin Corporation and Silvateam S.p.A alongside emerging regional players, necessitates continuous innovation and strategic partnerships to maintain market share. Geographical distribution shows robust growth across various regions, with North America and Europe exhibiting strong market presence currently, while Asia-Pacific is anticipated to witness significant growth in the coming years due to rising demand and economic development. The market segmentation by source (natural vs. synthetic) and application (food & beverage, pharmaceuticals, leather, etc.) presents various opportunities for specialized market penetration strategies.
Tannins Market: A Comprehensive Analysis (2019-2033)
This in-depth report provides a comprehensive analysis of the global Tannins Market, encompassing market dynamics, growth trends, regional dominance, product landscape, key players, and future outlook. The study period covers 2019-2033, with 2025 as the base and estimated year. The report segments the market by Source (Natural Tannin Extract, Synthetic Tannin Extract) and Application (Food & Beverage, Pharmaceutical, Leather, Others), offering granular insights into each segment's performance. The market value is presented in million units.
Tannins Market Market Dynamics & Structure
This section analyzes the competitive landscape of the tannins market, examining market concentration, technological advancements, regulatory influences, and industry trends. The market is moderately fragmented, with key players like Tannin Corporation, Silvateam S.p.A, Laffort, W Ulrich GmbH, S.A. Ajinomoto OmniChem N.V., Jyoti Dye Chem Agency, Tanac S.A, and EVER s.r.l. competing for market share. However, the emergence of new technologies and the increasing demand for natural and sustainable tannins are reshaping the industry dynamics.
- Market Concentration: The market exhibits a moderately concentrated structure, with the top 5 players holding approximately xx% of the global market share in 2025.
- Technological Innovation: Ongoing R&D efforts focus on improving extraction methods, enhancing product quality, and developing new applications for tannins. However, high R&D costs and regulatory hurdles pose significant barriers to innovation.
- Regulatory Frameworks: Stringent regulations concerning food safety and environmental impact influence the production and application of tannins, particularly in the food and beverage industry.
- Competitive Product Substitutes: Synthetic polymers and other alternatives pose a competitive threat to natural tannins, particularly in specific applications like leather tanning.
- End-User Demographics: The growing demand for natural and sustainable ingredients across diverse industries, especially in food and beverage and pharmaceuticals, significantly influences market growth.
- M&A Trends: The past five years have witnessed xx M&A deals in the tannins market, primarily driven by companies seeking to expand their product portfolio and geographic reach.
Tannins Market Growth Trends & Insights
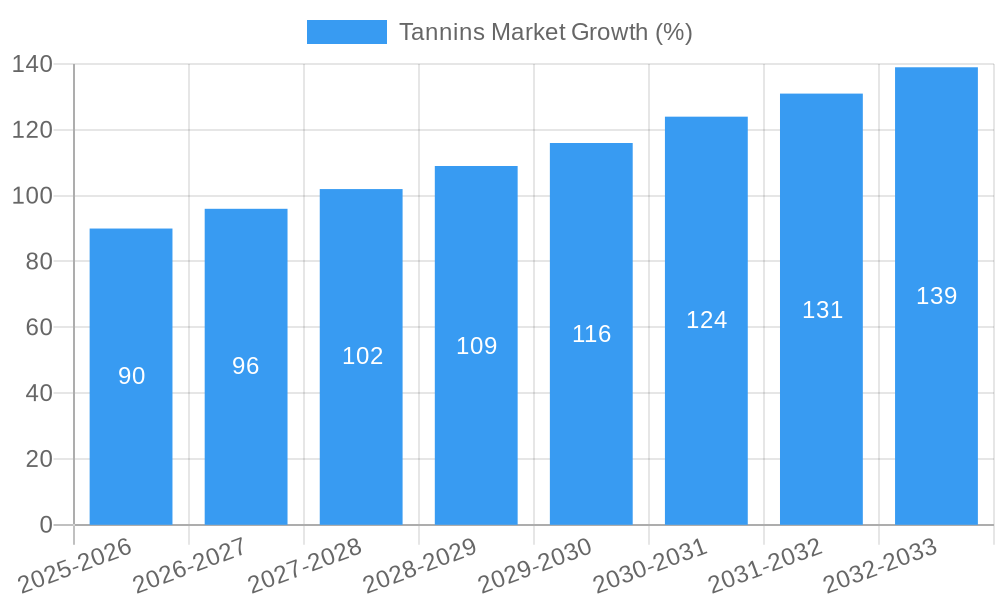
The global tannins market is projected to witness robust growth throughout the forecast period (2025-2033). Driven by increasing demand from the food & beverage and pharmaceutical industries, the market size is estimated at xx million units in 2025, exhibiting a CAGR of xx% from 2019 to 2024 and a projected CAGR of xx% from 2025 to 2033. The rising consumer preference for natural and sustainable products, coupled with technological advancements in extraction and purification techniques, is fueling this growth. Specific market penetration rates in key segments like natural tannin extracts in the food and beverage sector show significant progress, with xx% penetration achieved by 2025 and expected to reach xx% by 2033. Technological disruptions, such as the introduction of novel extraction methods, further accelerate market expansion. Shifting consumer behaviors, particularly towards health-conscious choices, drive substantial demand for tannins in functional foods and nutraceuticals.
Dominant Regions, Countries, or Segments in Tannins Market
The [Region - e.g., Europe] region dominates the global tannins market, accounting for approximately xx% of the market share in 2025. This dominance is primarily attributed to:
- Strong Presence of Key Players: A significant number of major tannin producers and processors are located in Europe.
- Established Infrastructure: Well-established processing infrastructure and robust supply chains facilitate efficient tannin production and distribution.
- Favorable Regulatory Environment: Relatively supportive regulatory frameworks encourage innovation and growth within the industry.
- High Demand from Diverse Sectors: Significant demand from the food and beverage and pharmaceutical sectors drives market growth within the region.
Within the segments, the Natural Tannin Extract segment holds the largest market share, driven by growing consumer preference for natural and sustainably sourced ingredients. The Food & Beverage application segment leads in market value, propelled by the increasing use of tannins as natural food additives and preservatives.
Tannins Market Product Landscape
The tannins market showcases a diverse range of products, encompassing various grades and forms tailored to specific applications. Recent product innovations focus on enhancing the purity, solubility, and functionality of tannin extracts. Technological advancements in extraction methods, such as supercritical fluid extraction, allow for the production of higher-quality tannins with improved performance characteristics. Unique selling propositions include enhanced functionalities, such as antioxidant and antimicrobial properties.
Key Drivers, Barriers & Challenges in Tannins Market
Key Drivers: The increasing demand for natural and sustainable ingredients in various industries is a primary driver. Technological advancements, especially in extraction methods, enhance product quality and efficiency. Favorable government policies and regulations supporting sustainable practices further stimulate market growth.
Key Challenges: Fluctuations in raw material prices, particularly of plant-based sources, pose significant challenges. Stringent regulatory requirements, particularly regarding food safety and environmental standards, impose compliance costs. Intense competition from synthetic substitutes and other alternatives requires companies to innovate and enhance value propositions.
Emerging Opportunities in Tannins Market
Untapped markets in developing economies present significant growth potential. The increasing demand for natural preservatives in the food and beverage industry creates new avenues. Innovative applications in areas like cosmetics and biomedicine are emerging.
Growth Accelerators in the Tannins Market Industry
Technological breakthroughs in extraction and purification methods lead to higher-quality and more cost-effective tannins. Strategic partnerships and collaborations among industry players facilitate market expansion. Expansion into new geographical markets and diversification into high-growth applications accelerate market growth.
Key Players Shaping the Tannins Market Market
- Tannin Corporation
- Silvateam S.p.A
- Laffort
- W Ulrich GmbH
- S.A. Ajinomoto OmniChem N.V.
- Jyoti Dye Chem Agency
- Tanac S.A
- EVER s.r.l
Notable Milestones in Tannins Market Sector
- 2022: Launch of a new, sustainably sourced tannin extract by Silvateam S.p.A.
- 2021: Acquisition of a smaller tannin producer by Tannin Corporation, expanding its market presence.
- 2020: Introduction of a novel tannin-based antimicrobial agent by Laffort.
- 2019: Implementation of stricter environmental regulations in the European Union impacting tannin production processes.
In-Depth Tannins Market Market Outlook
The tannins market is poised for continued robust growth, driven by increasing demand for natural ingredients across multiple sectors and ongoing technological advancements. Strategic partnerships and expansion into new applications will unlock significant future market potential. Companies focusing on sustainability and innovation will be best positioned to capitalize on emerging opportunities.
Tannins Market Segmentation
-
1. Source
- 1.1. Naural Tannin Extract
- 1.2. Synthetic Tannin extract
-
2. Application
-
2.1. Food & Beverage
- 2.1.1. Wine
- 2.1.2. RTD Drinks
- 2.1.3. Others
- 2.2. Pharmaceutical
- 2.3. Leather
-
2.1. Food & Beverage
Tannins Market Segmentation By Geography
-
1. North America
- 1.1. United States
- 1.2. Canada
- 1.3. Mexico
- 1.4. Rest of North America
-
2. Europe
- 2.1. United Kingdom
- 2.2. Germany
- 2.3. France
- 2.4. Russia
- 2.5. Italy
- 2.6. Spain
- 2.7. Rest of Europe
-
3. Asia Pacific
- 3.1. India
- 3.2. China
- 3.3. Japan
- 3.4. Australia
- 3.5. Rest of Asia Pacific
-
4. South America
- 4.1. Brazil
- 4.2. Argentina
- 4.3. Rest of South America
- 5. Middle East
-
6. South Africa
- 6.1. Saudi Arabia
- 6.2. Rest of MEA
Tannins Market REPORT HIGHLIGHTS
| Aspects | Details |
|---|---|
| Study Period | 2019-2033 |
| Base Year | 2024 |
| Estimated Year | 2025 |
| Forecast Period | 2025-2033 |
| Historical Period | 2019-2024 |
| Growth Rate | CAGR of 6.00% from 2019-2033 |
| Segmentation |
|
Table of Contents
- 1. Introduction
- 1.1. Research Scope
- 1.2. Market Segmentation
- 1.3. Research Methodology
- 1.4. Definitions and Assumptions
- 2. Executive Summary
- 2.1. Introduction
- 3. Market Dynamics
- 3.1. Introduction
- 3.2. Market Drivers
- 3.2.1. Increasing Demand for Protein-Rich Food; Increasing Demand for Plant-Based and Organic Ingredients
- 3.3. Market Restrains
- 3.3.1. Presence of Alternative Proteins
- 3.4. Market Trends
- 3.4.1. Rising Demand For Plant-based Tannin Extracts
- 4. Market Factor Analysis
- 4.1. Porters Five Forces
- 4.2. Supply/Value Chain
- 4.3. PESTEL analysis
- 4.4. Market Entropy
- 4.5. Patent/Trademark Analysis
- 5. Global Tannins Market Analysis, Insights and Forecast, 2019-2031
- 5.1. Market Analysis, Insights and Forecast - by Source
- 5.1.1. Naural Tannin Extract
- 5.1.2. Synthetic Tannin extract
- 5.2. Market Analysis, Insights and Forecast - by Application
- 5.2.1. Food & Beverage
- 5.2.1.1. Wine
- 5.2.1.2. RTD Drinks
- 5.2.1.3. Others
- 5.2.2. Pharmaceutical
- 5.2.3. Leather
- 5.2.1. Food & Beverage
- 5.3. Market Analysis, Insights and Forecast - by Region
- 5.3.1. North America
- 5.3.2. Europe
- 5.3.3. Asia Pacific
- 5.3.4. South America
- 5.3.5. Middle East
- 5.3.6. South Africa
- 5.1. Market Analysis, Insights and Forecast - by Source
- 6. North America Tannins Market Analysis, Insights and Forecast, 2019-2031
- 6.1. Market Analysis, Insights and Forecast - by Source
- 6.1.1. Naural Tannin Extract
- 6.1.2. Synthetic Tannin extract
- 6.2. Market Analysis, Insights and Forecast - by Application
- 6.2.1. Food & Beverage
- 6.2.1.1. Wine
- 6.2.1.2. RTD Drinks
- 6.2.1.3. Others
- 6.2.2. Pharmaceutical
- 6.2.3. Leather
- 6.2.1. Food & Beverage
- 6.1. Market Analysis, Insights and Forecast - by Source
- 7. Europe Tannins Market Analysis, Insights and Forecast, 2019-2031
- 7.1. Market Analysis, Insights and Forecast - by Source
- 7.1.1. Naural Tannin Extract
- 7.1.2. Synthetic Tannin extract
- 7.2. Market Analysis, Insights and Forecast - by Application
- 7.2.1. Food & Beverage
- 7.2.1.1. Wine
- 7.2.1.2. RTD Drinks
- 7.2.1.3. Others
- 7.2.2. Pharmaceutical
- 7.2.3. Leather
- 7.2.1. Food & Beverage
- 7.1. Market Analysis, Insights and Forecast - by Source
- 8. Asia Pacific Tannins Market Analysis, Insights and Forecast, 2019-2031
- 8.1. Market Analysis, Insights and Forecast - by Source
- 8.1.1. Naural Tannin Extract
- 8.1.2. Synthetic Tannin extract
- 8.2. Market Analysis, Insights and Forecast - by Application
- 8.2.1. Food & Beverage
- 8.2.1.1. Wine
- 8.2.1.2. RTD Drinks
- 8.2.1.3. Others
- 8.2.2. Pharmaceutical
- 8.2.3. Leather
- 8.2.1. Food & Beverage
- 8.1. Market Analysis, Insights and Forecast - by Source
- 9. South America Tannins Market Analysis, Insights and Forecast, 2019-2031
- 9.1. Market Analysis, Insights and Forecast - by Source
- 9.1.1. Naural Tannin Extract
- 9.1.2. Synthetic Tannin extract
- 9.2. Market Analysis, Insights and Forecast - by Application
- 9.2.1. Food & Beverage
- 9.2.1.1. Wine
- 9.2.1.2. RTD Drinks
- 9.2.1.3. Others
- 9.2.2. Pharmaceutical
- 9.2.3. Leather
- 9.2.1. Food & Beverage
- 9.1. Market Analysis, Insights and Forecast - by Source
- 10. Middle East Tannins Market Analysis, Insights and Forecast, 2019-2031
- 10.1. Market Analysis, Insights and Forecast - by Source
- 10.1.1. Naural Tannin Extract
- 10.1.2. Synthetic Tannin extract
- 10.2. Market Analysis, Insights and Forecast - by Application
- 10.2.1. Food & Beverage
- 10.2.1.1. Wine
- 10.2.1.2. RTD Drinks
- 10.2.1.3. Others
- 10.2.2. Pharmaceutical
- 10.2.3. Leather
- 10.2.1. Food & Beverage
- 10.1. Market Analysis, Insights and Forecast - by Source
- 11. South Africa Tannins Market Analysis, Insights and Forecast, 2019-2031
- 11.1. Market Analysis, Insights and Forecast - by Source
- 11.1.1. Naural Tannin Extract
- 11.1.2. Synthetic Tannin extract
- 11.2. Market Analysis, Insights and Forecast - by Application
- 11.2.1. Food & Beverage
- 11.2.1.1. Wine
- 11.2.1.2. RTD Drinks
- 11.2.1.3. Others
- 11.2.2. Pharmaceutical
- 11.2.3. Leather
- 11.2.1. Food & Beverage
- 11.1. Market Analysis, Insights and Forecast - by Source
- 12. North America Tannins Market Analysis, Insights and Forecast, 2019-2031
- 12.1. Market Analysis, Insights and Forecast - By Country/Sub-region
- 12.1.1 United States
- 12.1.2 Canada
- 12.1.3 Mexico
- 12.1.4 Rest of North America
- 13. Europe Tannins Market Analysis, Insights and Forecast, 2019-2031
- 13.1. Market Analysis, Insights and Forecast - By Country/Sub-region
- 13.1.1 United Kingdom
- 13.1.2 Germany
- 13.1.3 France
- 13.1.4 Russia
- 13.1.5 Italy
- 13.1.6 Spain
- 13.1.7 Rest of Europe
- 14. Asia Pacific Tannins Market Analysis, Insights and Forecast, 2019-2031
- 14.1. Market Analysis, Insights and Forecast - By Country/Sub-region
- 14.1.1 India
- 14.1.2 China
- 14.1.3 Japan
- 14.1.4 Australia
- 14.1.5 Rest of Asia Pacific
- 15. South America Tannins Market Analysis, Insights and Forecast, 2019-2031
- 15.1. Market Analysis, Insights and Forecast - By Country/Sub-region
- 15.1.1 Brazil
- 15.1.2 Argentina
- 15.1.3 Rest of South America
- 16. Middle East Tannins Market Analysis, Insights and Forecast, 2019-2031
- 16.1. Market Analysis, Insights and Forecast - By Country/Sub-region
- 16.1.1.
- 17. South Africa Tannins Market Analysis, Insights and Forecast, 2019-2031
- 17.1. Market Analysis, Insights and Forecast - By Country/Sub-region
- 17.1.1 Saudi Arabia
- 17.1.2 Rest of MEA
- 18. Competitive Analysis
- 18.1. Global Market Share Analysis 2024
- 18.2. Company Profiles
- 18.2.1 Tannin Corporation
- 18.2.1.1. Overview
- 18.2.1.2. Products
- 18.2.1.3. SWOT Analysis
- 18.2.1.4. Recent Developments
- 18.2.1.5. Financials (Based on Availability)
- 18.2.2 Silvateam S p a
- 18.2.2.1. Overview
- 18.2.2.2. Products
- 18.2.2.3. SWOT Analysis
- 18.2.2.4. Recent Developments
- 18.2.2.5. Financials (Based on Availability)
- 18.2.3 Laffort
- 18.2.3.1. Overview
- 18.2.3.2. Products
- 18.2.3.3. SWOT Analysis
- 18.2.3.4. Recent Developments
- 18.2.3.5. Financials (Based on Availability)
- 18.2.4 W Ulrich GmbH
- 18.2.4.1. Overview
- 18.2.4.2. Products
- 18.2.4.3. SWOT Analysis
- 18.2.4.4. Recent Developments
- 18.2.4.5. Financials (Based on Availability)
- 18.2.5 S A Ajinomoto OmniChem N V
- 18.2.5.1. Overview
- 18.2.5.2. Products
- 18.2.5.3. SWOT Analysis
- 18.2.5.4. Recent Developments
- 18.2.5.5. Financials (Based on Availability)
- 18.2.6 Jyoti Dye Chem Agency*List Not Exhaustive
- 18.2.6.1. Overview
- 18.2.6.2. Products
- 18.2.6.3. SWOT Analysis
- 18.2.6.4. Recent Developments
- 18.2.6.5. Financials (Based on Availability)
- 18.2.7 Tanac S A
- 18.2.7.1. Overview
- 18.2.7.2. Products
- 18.2.7.3. SWOT Analysis
- 18.2.7.4. Recent Developments
- 18.2.7.5. Financials (Based on Availability)
- 18.2.8 EVER s r l
- 18.2.8.1. Overview
- 18.2.8.2. Products
- 18.2.8.3. SWOT Analysis
- 18.2.8.4. Recent Developments
- 18.2.8.5. Financials (Based on Availability)
- 18.2.1 Tannin Corporation
List of Figures
- Figure 1: Global Tannins Market Revenue Breakdown (Million, %) by Region 2024 & 2032
- Figure 2: North America Tannins Market Revenue (Million), by Country 2024 & 2032
- Figure 3: North America Tannins Market Revenue Share (%), by Country 2024 & 2032
- Figure 4: Europe Tannins Market Revenue (Million), by Country 2024 & 2032
- Figure 5: Europe Tannins Market Revenue Share (%), by Country 2024 & 2032
- Figure 6: Asia Pacific Tannins Market Revenue (Million), by Country 2024 & 2032
- Figure 7: Asia Pacific Tannins Market Revenue Share (%), by Country 2024 & 2032
- Figure 8: South America Tannins Market Revenue (Million), by Country 2024 & 2032
- Figure 9: South America Tannins Market Revenue Share (%), by Country 2024 & 2032
- Figure 10: Middle East Tannins Market Revenue (Million), by Country 2024 & 2032
- Figure 11: Middle East Tannins Market Revenue Share (%), by Country 2024 & 2032
- Figure 12: South Africa Tannins Market Revenue (Million), by Country 2024 & 2032
- Figure 13: South Africa Tannins Market Revenue Share (%), by Country 2024 & 2032
- Figure 14: North America Tannins Market Revenue (Million), by Source 2024 & 2032
- Figure 15: North America Tannins Market Revenue Share (%), by Source 2024 & 2032
- Figure 16: North America Tannins Market Revenue (Million), by Application 2024 & 2032
- Figure 17: North America Tannins Market Revenue Share (%), by Application 2024 & 2032
- Figure 18: North America Tannins Market Revenue (Million), by Country 2024 & 2032
- Figure 19: North America Tannins Market Revenue Share (%), by Country 2024 & 2032
- Figure 20: Europe Tannins Market Revenue (Million), by Source 2024 & 2032
- Figure 21: Europe Tannins Market Revenue Share (%), by Source 2024 & 2032
- Figure 22: Europe Tannins Market Revenue (Million), by Application 2024 & 2032
- Figure 23: Europe Tannins Market Revenue Share (%), by Application 2024 & 2032
- Figure 24: Europe Tannins Market Revenue (Million), by Country 2024 & 2032
- Figure 25: Europe Tannins Market Revenue Share (%), by Country 2024 & 2032
- Figure 26: Asia Pacific Tannins Market Revenue (Million), by Source 2024 & 2032
- Figure 27: Asia Pacific Tannins Market Revenue Share (%), by Source 2024 & 2032
- Figure 28: Asia Pacific Tannins Market Revenue (Million), by Application 2024 & 2032
- Figure 29: Asia Pacific Tannins Market Revenue Share (%), by Application 2024 & 2032
- Figure 30: Asia Pacific Tannins Market Revenue (Million), by Country 2024 & 2032
- Figure 31: Asia Pacific Tannins Market Revenue Share (%), by Country 2024 & 2032
- Figure 32: South America Tannins Market Revenue (Million), by Source 2024 & 2032
- Figure 33: South America Tannins Market Revenue Share (%), by Source 2024 & 2032
- Figure 34: South America Tannins Market Revenue (Million), by Application 2024 & 2032
- Figure 35: South America Tannins Market Revenue Share (%), by Application 2024 & 2032
- Figure 36: South America Tannins Market Revenue (Million), by Country 2024 & 2032
- Figure 37: South America Tannins Market Revenue Share (%), by Country 2024 & 2032
- Figure 38: Middle East Tannins Market Revenue (Million), by Source 2024 & 2032
- Figure 39: Middle East Tannins Market Revenue Share (%), by Source 2024 & 2032
- Figure 40: Middle East Tannins Market Revenue (Million), by Application 2024 & 2032
- Figure 41: Middle East Tannins Market Revenue Share (%), by Application 2024 & 2032
- Figure 42: Middle East Tannins Market Revenue (Million), by Country 2024 & 2032
- Figure 43: Middle East Tannins Market Revenue Share (%), by Country 2024 & 2032
- Figure 44: South Africa Tannins Market Revenue (Million), by Source 2024 & 2032
- Figure 45: South Africa Tannins Market Revenue Share (%), by Source 2024 & 2032
- Figure 46: South Africa Tannins Market Revenue (Million), by Application 2024 & 2032
- Figure 47: South Africa Tannins Market Revenue Share (%), by Application 2024 & 2032
- Figure 48: South Africa Tannins Market Revenue (Million), by Country 2024 & 2032
- Figure 49: South Africa Tannins Market Revenue Share (%), by Country 2024 & 2032
List of Tables
- Table 1: Global Tannins Market Revenue Million Forecast, by Region 2019 & 2032
- Table 2: Global Tannins Market Revenue Million Forecast, by Source 2019 & 2032
- Table 3: Global Tannins Market Revenue Million Forecast, by Application 2019 & 2032
- Table 4: Global Tannins Market Revenue Million Forecast, by Region 2019 & 2032
- Table 5: Global Tannins Market Revenue Million Forecast, by Country 2019 & 2032
- Table 6: United States Tannins Market Revenue (Million) Forecast, by Application 2019 & 2032
- Table 7: Canada Tannins Market Revenue (Million) Forecast, by Application 2019 & 2032
- Table 8: Mexico Tannins Market Revenue (Million) Forecast, by Application 2019 & 2032
- Table 9: Rest of North America Tannins Market Revenue (Million) Forecast, by Application 2019 & 2032
- Table 10: Global Tannins Market Revenue Million Forecast, by Country 2019 & 2032
- Table 11: United Kingdom Tannins Market Revenue (Million) Forecast, by Application 2019 & 2032
- Table 12: Germany Tannins Market Revenue (Million) Forecast, by Application 2019 & 2032
- Table 13: France Tannins Market Revenue (Million) Forecast, by Application 2019 & 2032
- Table 14: Russia Tannins Market Revenue (Million) Forecast, by Application 2019 & 2032
- Table 15: Italy Tannins Market Revenue (Million) Forecast, by Application 2019 & 2032
- Table 16: Spain Tannins Market Revenue (Million) Forecast, by Application 2019 & 2032
- Table 17: Rest of Europe Tannins Market Revenue (Million) Forecast, by Application 2019 & 2032
- Table 18: Global Tannins Market Revenue Million Forecast, by Country 2019 & 2032
- Table 19: India Tannins Market Revenue (Million) Forecast, by Application 2019 & 2032
- Table 20: China Tannins Market Revenue (Million) Forecast, by Application 2019 & 2032
- Table 21: Japan Tannins Market Revenue (Million) Forecast, by Application 2019 & 2032
- Table 22: Australia Tannins Market Revenue (Million) Forecast, by Application 2019 & 2032
- Table 23: Rest of Asia Pacific Tannins Market Revenue (Million) Forecast, by Application 2019 & 2032
- Table 24: Global Tannins Market Revenue Million Forecast, by Country 2019 & 2032
- Table 25: Brazil Tannins Market Revenue (Million) Forecast, by Application 2019 & 2032
- Table 26: Argentina Tannins Market Revenue (Million) Forecast, by Application 2019 & 2032
- Table 27: Rest of South America Tannins Market Revenue (Million) Forecast, by Application 2019 & 2032
- Table 28: Global Tannins Market Revenue Million Forecast, by Country 2019 & 2032
- Table 29: Tannins Market Revenue (Million) Forecast, by Application 2019 & 2032
- Table 30: Global Tannins Market Revenue Million Forecast, by Country 2019 & 2032
- Table 31: Saudi Arabia Tannins Market Revenue (Million) Forecast, by Application 2019 & 2032
- Table 32: Rest of MEA Tannins Market Revenue (Million) Forecast, by Application 2019 & 2032
- Table 33: Global Tannins Market Revenue Million Forecast, by Source 2019 & 2032
- Table 34: Global Tannins Market Revenue Million Forecast, by Application 2019 & 2032
- Table 35: Global Tannins Market Revenue Million Forecast, by Country 2019 & 2032
- Table 36: United States Tannins Market Revenue (Million) Forecast, by Application 2019 & 2032
- Table 37: Canada Tannins Market Revenue (Million) Forecast, by Application 2019 & 2032
- Table 38: Mexico Tannins Market Revenue (Million) Forecast, by Application 2019 & 2032
- Table 39: Rest of North America Tannins Market Revenue (Million) Forecast, by Application 2019 & 2032
- Table 40: Global Tannins Market Revenue Million Forecast, by Source 2019 & 2032
- Table 41: Global Tannins Market Revenue Million Forecast, by Application 2019 & 2032
- Table 42: Global Tannins Market Revenue Million Forecast, by Country 2019 & 2032
- Table 43: United Kingdom Tannins Market Revenue (Million) Forecast, by Application 2019 & 2032
- Table 44: Germany Tannins Market Revenue (Million) Forecast, by Application 2019 & 2032
- Table 45: France Tannins Market Revenue (Million) Forecast, by Application 2019 & 2032
- Table 46: Russia Tannins Market Revenue (Million) Forecast, by Application 2019 & 2032
- Table 47: Italy Tannins Market Revenue (Million) Forecast, by Application 2019 & 2032
- Table 48: Spain Tannins Market Revenue (Million) Forecast, by Application 2019 & 2032
- Table 49: Rest of Europe Tannins Market Revenue (Million) Forecast, by Application 2019 & 2032
- Table 50: Global Tannins Market Revenue Million Forecast, by Source 2019 & 2032
- Table 51: Global Tannins Market Revenue Million Forecast, by Application 2019 & 2032
- Table 52: Global Tannins Market Revenue Million Forecast, by Country 2019 & 2032
- Table 53: India Tannins Market Revenue (Million) Forecast, by Application 2019 & 2032
- Table 54: China Tannins Market Revenue (Million) Forecast, by Application 2019 & 2032
- Table 55: Japan Tannins Market Revenue (Million) Forecast, by Application 2019 & 2032
- Table 56: Australia Tannins Market Revenue (Million) Forecast, by Application 2019 & 2032
- Table 57: Rest of Asia Pacific Tannins Market Revenue (Million) Forecast, by Application 2019 & 2032
- Table 58: Global Tannins Market Revenue Million Forecast, by Source 2019 & 2032
- Table 59: Global Tannins Market Revenue Million Forecast, by Application 2019 & 2032
- Table 60: Global Tannins Market Revenue Million Forecast, by Country 2019 & 2032
- Table 61: Brazil Tannins Market Revenue (Million) Forecast, by Application 2019 & 2032
- Table 62: Argentina Tannins Market Revenue (Million) Forecast, by Application 2019 & 2032
- Table 63: Rest of South America Tannins Market Revenue (Million) Forecast, by Application 2019 & 2032
- Table 64: Global Tannins Market Revenue Million Forecast, by Source 2019 & 2032
- Table 65: Global Tannins Market Revenue Million Forecast, by Application 2019 & 2032
- Table 66: Global Tannins Market Revenue Million Forecast, by Country 2019 & 2032
- Table 67: Global Tannins Market Revenue Million Forecast, by Source 2019 & 2032
- Table 68: Global Tannins Market Revenue Million Forecast, by Application 2019 & 2032
- Table 69: Global Tannins Market Revenue Million Forecast, by Country 2019 & 2032
- Table 70: Saudi Arabia Tannins Market Revenue (Million) Forecast, by Application 2019 & 2032
- Table 71: Rest of MEA Tannins Market Revenue (Million) Forecast, by Application 2019 & 2032
Frequently Asked Questions
1. What is the projected Compound Annual Growth Rate (CAGR) of the Tannins Market?
The projected CAGR is approximately 6.00%.
2. Which companies are prominent players in the Tannins Market?
Key companies in the market include Tannin Corporation, Silvateam S p a, Laffort, W Ulrich GmbH, S A Ajinomoto OmniChem N V, Jyoti Dye Chem Agency*List Not Exhaustive, Tanac S A, EVER s r l.
3. What are the main segments of the Tannins Market?
The market segments include Source, Application.
4. Can you provide details about the market size?
The market size is estimated to be USD XX Million as of 2022.
5. What are some drivers contributing to market growth?
Increasing Demand for Protein-Rich Food; Increasing Demand for Plant-Based and Organic Ingredients.
6. What are the notable trends driving market growth?
Rising Demand For Plant-based Tannin Extracts.
7. Are there any restraints impacting market growth?
Presence of Alternative Proteins.
8. Can you provide examples of recent developments in the market?
N/A
9. What pricing options are available for accessing the report?
Pricing options include single-user, multi-user, and enterprise licenses priced at USD 4750, USD 5250, and USD 8750 respectively.
10. Is the market size provided in terms of value or volume?
The market size is provided in terms of value, measured in Million.
11. Are there any specific market keywords associated with the report?
Yes, the market keyword associated with the report is "Tannins Market," which aids in identifying and referencing the specific market segment covered.
12. How do I determine which pricing option suits my needs best?
The pricing options vary based on user requirements and access needs. Individual users may opt for single-user licenses, while businesses requiring broader access may choose multi-user or enterprise licenses for cost-effective access to the report.
13. Are there any additional resources or data provided in the Tannins Market report?
While the report offers comprehensive insights, it's advisable to review the specific contents or supplementary materials provided to ascertain if additional resources or data are available.
14. How can I stay updated on further developments or reports in the Tannins Market?
To stay informed about further developments, trends, and reports in the Tannins Market, consider subscribing to industry newsletters, following relevant companies and organizations, or regularly checking reputable industry news sources and publications.
Methodology
Step 1 - Identification of Relevant Samples Size from Population Database


Step 2 - Approaches for Defining Global Market Size (Value, Volume* & Price*)

Note*: In applicable scenarios
Step 3 - Data Sources
Primary Research
- Web Analytics
- Survey Reports
- Research Institute
- Latest Research Reports
- Opinion Leaders
Secondary Research
- Annual Reports
- White Paper
- Latest Press Release
- Industry Association
- Paid Database
- Investor Presentations

Step 4 - Data Triangulation
Involves using different sources of information in order to increase the validity of a study
These sources are likely to be stakeholders in a program - participants, other researchers, program staff, other community members, and so on.
Then we put all data in single framework & apply various statistical tools to find out the dynamic on the market.
During the analysis stage, feedback from the stakeholder groups would be compared to determine areas of agreement as well as areas of divergence
