

Key Insights
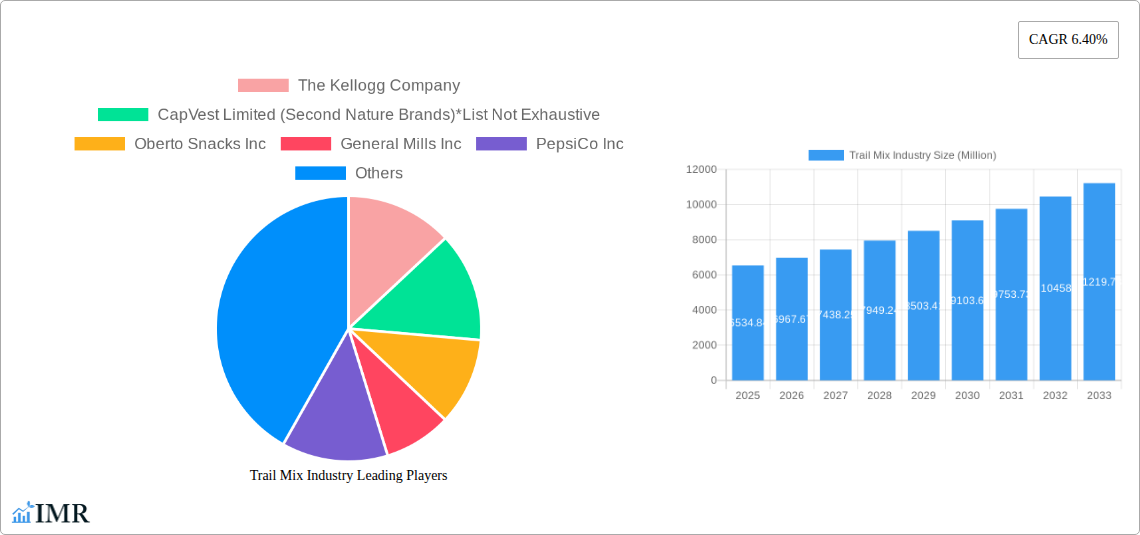
The global trail mix market, valued at $6,534.84 million in 2025, is projected to experience robust growth, driven by increasing health consciousness and the convenience of on-the-go snacking. Consumers are increasingly seeking nutritious and portable snack options, fueling demand for trail mix varieties featuring nuts, seeds, dried fruits, and chocolates. The rising popularity of fitness and active lifestyles further contributes to this market expansion. Growth is also being driven by product innovation, with manufacturers introducing new flavors, healthier ingredients (like organic options and superfoods), and convenient packaging formats (such as single-serve pouches and resealable bags). Key distribution channels include hypermarkets/supermarkets, convenience stores, and online retail, with the latter segment witnessing significant growth due to the ease of access and wider product selection. However, fluctuating raw material prices and intense competition from other snack food categories present challenges to market expansion. The market is segmented geographically, with North America and Europe currently holding significant market shares, followed by the Asia-Pacific region which is anticipated to experience substantial growth in the coming years, driven by increasing disposable incomes and changing consumer preferences. Major players, including Kellogg's, General Mills, and PepsiCo, are leveraging brand recognition and extensive distribution networks to maintain their market positions, while smaller, specialized brands are focusing on niche markets and innovative product offerings to compete effectively. The forecast period of 2025-2033 anticipates consistent growth, propelled by the aforementioned factors.
The competitive landscape is characterized by a mix of large multinational corporations and smaller, specialized companies. Larger players leverage their established brand equity and widespread distribution networks to maintain market dominance. Meanwhile, smaller companies are focusing on product innovation and catering to specific consumer segments, such as those seeking organic or specialty ingredients. This leads to a dynamic market environment where both established players and emerging brands actively compete for consumer attention. The market’s growth trajectory is expected to remain positive, driven by sustained demand for healthy and convenient snacking options, coupled with continued product innovation and expansion into new geographical markets. Strategic partnerships, mergers, and acquisitions are also anticipated, further shaping the competitive dynamics within the industry. Companies are continually adapting their strategies to meet changing consumer preferences and navigate the challenges presented by fluctuations in raw material costs and increased competition.
Trail Mix Industry Market Report: 2019-2033
This comprehensive report provides a detailed analysis of the trail mix industry, encompassing market dynamics, growth trends, competitive landscape, and future outlook. The study period covers 2019-2033, with 2025 as the base year and a forecast period of 2025-2033. This report is invaluable for industry professionals, investors, and market researchers seeking actionable insights into this dynamic sector. The parent market is the snack food industry, while the child market is the nut and seed snacks segment.
Trail Mix Industry Market Dynamics & Structure
The trail mix market is characterized by moderate concentration, with key players like Kellogg's, General Mills, and Mars Incorporated holding significant market share, but with numerous smaller, specialized brands contributing to the overall market volume. Technological innovation, primarily in packaging and ingredient sourcing (e.g., sustainable farming practices), drives market evolution. Regulatory frameworks concerning food safety and labeling significantly impact operations. Competitive substitutes include energy bars, granola, and other snack options. The end-user demographic is broad, spanning all age groups and demographics, though certain segments (health-conscious consumers, athletes) exhibit higher consumption rates. M&A activity, as exemplified by CapVest's acquisition of Second Nature Brands, indicates ongoing consolidation and expansion efforts within the industry.
- Market Concentration: Moderately concentrated, with top 5 players holding xx% market share in 2024.
- Technological Innovation: Focus on sustainable sourcing, innovative packaging (e.g., resealable pouches), and enhanced product formulations.
- Regulatory Framework: Stringent food safety regulations and labeling requirements influence production and distribution.
- Competitive Substitutes: Energy bars, granola, dried fruit, and other convenient snacks.
- End-User Demographics: Broad appeal across age groups and lifestyles, with higher consumption among health-conscious consumers and athletes.
- M&A Activity: xx M&A deals recorded between 2019 and 2024, with a total value of $xx million.
Trail Mix Industry Growth Trends & Insights
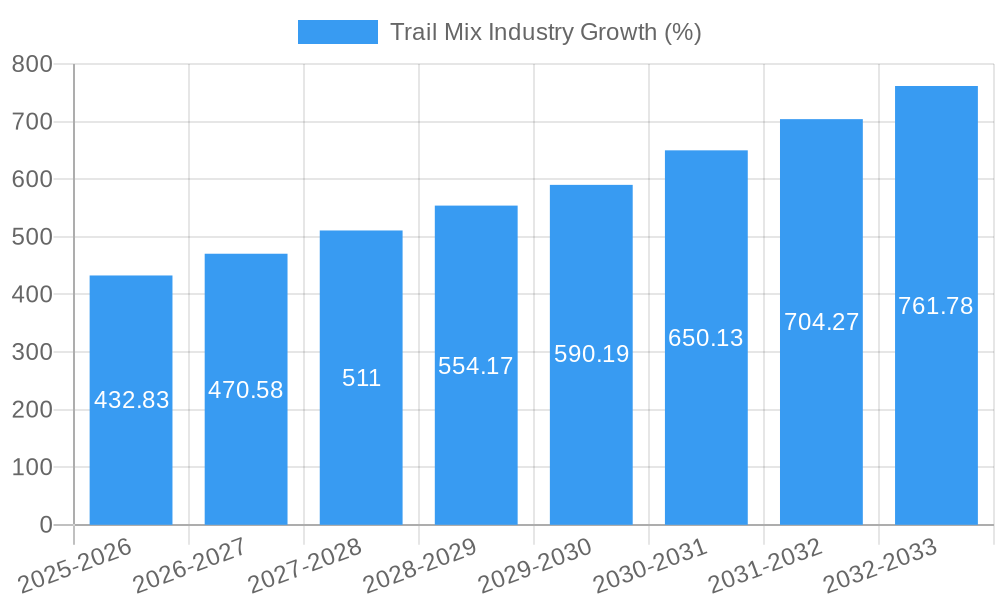
The global trail mix market experienced robust growth between 2019 and 2024, driven by increasing health consciousness, convenience, and the growing popularity of on-the-go snacking. The market size expanded from $xx million in 2019 to $xx million in 2024, reflecting a CAGR of xx%. This growth is anticipated to continue, with a projected market size of $xx million by 2033 and a forecast CAGR of xx%. Technological disruptions, such as improved processing techniques and personalized product offerings, are further contributing to market expansion. Shifting consumer preferences towards healthier, more natural snack options are fueling demand for trail mixes with organic ingredients and unique flavor combinations. Market penetration is expected to grow significantly in developing economies.
Dominant Regions, Countries, or Segments in Trail Mix Industry
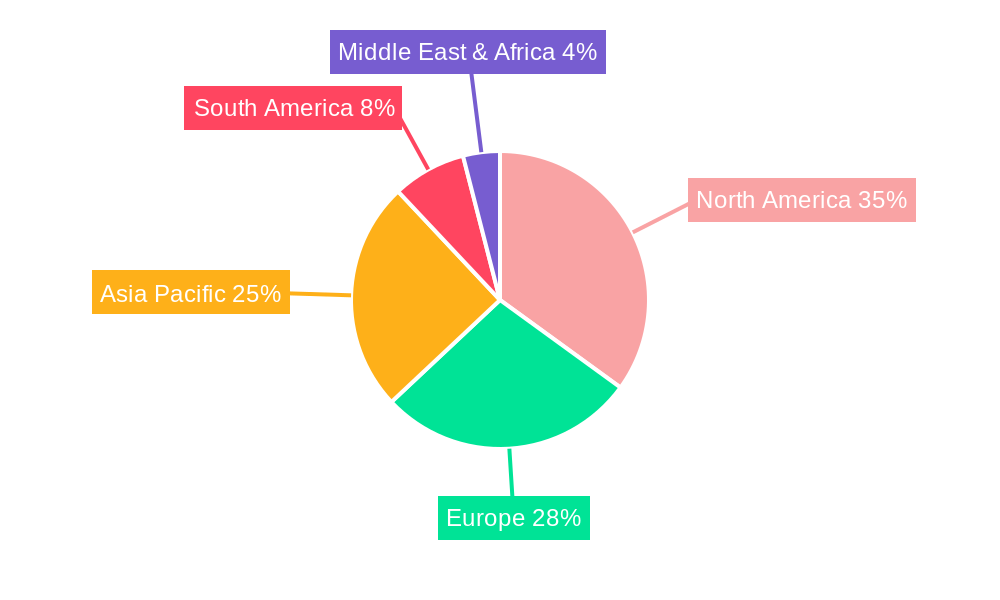
North America currently dominates the global trail mix market, followed by Europe and Asia-Pacific. Within distribution channels, hypermarkets/supermarkets represent the largest segment, driven by extensive product availability and consumer familiarity. However, online retail stores are experiencing rapid growth due to increased e-commerce penetration and the convenience of home delivery.
Hypermarkets/Supermarkets: Largest market share due to widespread availability and established distribution networks.
Online Retail Stores: Fastest-growing segment, fueled by e-commerce adoption and convenient home delivery.
Convenience Stores: Significant presence due to high foot traffic and impulse purchases.
Specialty Stores: Catering to niche consumer preferences with premium or specialized products.
Other Distribution Channels: Including direct-to-consumer sales, vending machines, and other channels.
Key Drivers: Increased consumer spending, rising disposable incomes in developing economies, and expanding distribution networks.
Trail Mix Industry Product Landscape
The trail mix market offers a diverse range of products, from classic nut and seed blends to innovative combinations incorporating dried fruits, chocolate, pretzels, and other ingredients. Product innovation focuses on healthier formulations (e.g., organic ingredients, reduced sugar), unique flavor profiles, and convenient packaging options. The key selling propositions include convenience, portability, nutritional value, and diverse flavor combinations. Technological advancements in ingredient processing and packaging contribute to product quality and shelf life.
Key Drivers, Barriers & Challenges in Trail Mix Industry
Key Drivers:
- Growing demand for healthy and convenient snacks.
- Increased consumer awareness of nutritional benefits.
- Expanding distribution channels and online retail presence.
- Product innovation and diversification.
Challenges:
- Fluctuations in raw material prices (nuts, seeds, dried fruits).
- Intense competition from substitute products.
- Maintaining consistent product quality and safety standards.
- Supply chain disruptions impacting availability and cost. The impact of xx% increase in transportation costs resulted in xx% increase in final product price in 2024.
Emerging Opportunities in Trail Mix Industry
- Untapped Markets: Expanding into developing economies with rising disposable incomes and a growing demand for convenient snacks.
- Product Innovation: Developing new and unique flavor combinations, functional ingredients (e.g., probiotics, added protein), and sustainable packaging.
- Evolving Consumer Preferences: Catering to specific dietary needs (vegan, gluten-free, keto) and preferences for organic and locally sourced ingredients.
Growth Accelerators in the Trail Mix Industry
Technological advancements in processing, packaging, and ingredient sourcing are driving efficiency and sustainability, while strategic partnerships and market expansion initiatives will create new avenues for growth. The increasing adoption of e-commerce and direct-to-consumer sales will contribute to wider market reach and accessibility.
Key Players Shaping the Trail Mix Industry Market
- The Kellogg Company
- CapVest Limited (Second Nature Brands)
- Oberto Snacks Inc
- General Mills Inc
- PepsiCo Inc
- Creative Snacks Co
- The J M Smucker Company
- Mars Incorporated
- Whitworths
- Hormel Foods Corporation
- Texas Star Nut & Food Co
Notable Milestones in Trail Mix Industry Sector
- May 2021: Mars Inc. partnered with Instacart to expand its product portfolio through the delivery system.
- July 2021: The J.M. Smucker Company launched two new snack mixes inspired by classic flavor profiles.
- April 2022: Second Nature Brands was acquired by CapVest Partners LLP.
- August 2022: Whitworths added new trail mixes featuring mixed nuts and tropical dried fruit snacking ranges to its portfolio.
In-Depth Trail Mix Industry Market Outlook
The trail mix market is poised for continued growth, driven by sustained consumer demand for healthy and convenient snacks, coupled with technological innovations and strategic market expansions. Opportunities exist in developing new product offerings, tapping into untapped markets, and leveraging the growing e-commerce sector. The focus on sustainability and ethical sourcing practices will further enhance market appeal and drive long-term growth.
Trail Mix Industry Segmentation
-
1. Distribution Channel
- 1.1. Hypermarkets/Supermarkets
- 1.2. Convenience Stores
- 1.3. Specialty Stores
- 1.4. Online Retail Stores
- 1.5. Other Distribution Channels
Trail Mix Industry Segmentation By Geography
-
1. North America
- 1.1. United States
- 1.2. Canada
- 1.3. Mexico
- 1.4. Rest of North America
-
2. Europe
- 2.1. United Kingdom
- 2.2. Germany
- 2.3. France
- 2.4. Russia
- 2.5. Italy
- 2.6. Spain
- 2.7. Rest of Europe
-
3. Asia Pacific
- 3.1. India
- 3.2. China
- 3.3. Japan
- 3.4. Australia
- 3.5. Rest of Asia Pacific
-
4. South America
- 4.1. Brazil
- 4.2. Argentina
- 4.3. Rest of South America
- 5. Middle East
-
6. South Africa
- 6.1. Saudi Arabia
- 6.2. Rest of Middle East
Trail Mix Industry REPORT HIGHLIGHTS
| Aspects | Details |
|---|---|
| Study Period | 2019-2033 |
| Base Year | 2024 |
| Estimated Year | 2025 |
| Forecast Period | 2025-2033 |
| Historical Period | 2019-2024 |
| Growth Rate | CAGR of 6.40% from 2019-2033 |
| Segmentation |
|
Table of Contents
- 1. Introduction
- 1.1. Research Scope
- 1.2. Market Segmentation
- 1.3. Research Methodology
- 1.4. Definitions and Assumptions
- 2. Executive Summary
- 2.1. Introduction
- 3. Market Dynamics
- 3.1. Introduction
- 3.2. Market Drivers
- 3.2.1. Inclination Towards Reduced Sugar and Healthier Snacking Options; Surge in Demand for Organic Food Products
- 3.3. Market Restrains
- 3.3.1. Availability of Cheaper Snacking Options
- 3.4. Market Trends
- 3.4.1. Inclination Towards Reduced Sugar and Healthier Snacking Options
- 4. Market Factor Analysis
- 4.1. Porters Five Forces
- 4.2. Supply/Value Chain
- 4.3. PESTEL analysis
- 4.4. Market Entropy
- 4.5. Patent/Trademark Analysis
- 5. Global Trail Mix Industry Analysis, Insights and Forecast, 2019-2031
- 5.1. Market Analysis, Insights and Forecast - by Distribution Channel
- 5.1.1. Hypermarkets/Supermarkets
- 5.1.2. Convenience Stores
- 5.1.3. Specialty Stores
- 5.1.4. Online Retail Stores
- 5.1.5. Other Distribution Channels
- 5.2. Market Analysis, Insights and Forecast - by Region
- 5.2.1. North America
- 5.2.2. Europe
- 5.2.3. Asia Pacific
- 5.2.4. South America
- 5.2.5. Middle East
- 5.2.6. South Africa
- 5.1. Market Analysis, Insights and Forecast - by Distribution Channel
- 6. North America Trail Mix Industry Analysis, Insights and Forecast, 2019-2031
- 6.1. Market Analysis, Insights and Forecast - by Distribution Channel
- 6.1.1. Hypermarkets/Supermarkets
- 6.1.2. Convenience Stores
- 6.1.3. Specialty Stores
- 6.1.4. Online Retail Stores
- 6.1.5. Other Distribution Channels
- 6.1. Market Analysis, Insights and Forecast - by Distribution Channel
- 7. Europe Trail Mix Industry Analysis, Insights and Forecast, 2019-2031
- 7.1. Market Analysis, Insights and Forecast - by Distribution Channel
- 7.1.1. Hypermarkets/Supermarkets
- 7.1.2. Convenience Stores
- 7.1.3. Specialty Stores
- 7.1.4. Online Retail Stores
- 7.1.5. Other Distribution Channels
- 7.1. Market Analysis, Insights and Forecast - by Distribution Channel
- 8. Asia Pacific Trail Mix Industry Analysis, Insights and Forecast, 2019-2031
- 8.1. Market Analysis, Insights and Forecast - by Distribution Channel
- 8.1.1. Hypermarkets/Supermarkets
- 8.1.2. Convenience Stores
- 8.1.3. Specialty Stores
- 8.1.4. Online Retail Stores
- 8.1.5. Other Distribution Channels
- 8.1. Market Analysis, Insights and Forecast - by Distribution Channel
- 9. South America Trail Mix Industry Analysis, Insights and Forecast, 2019-2031
- 9.1. Market Analysis, Insights and Forecast - by Distribution Channel
- 9.1.1. Hypermarkets/Supermarkets
- 9.1.2. Convenience Stores
- 9.1.3. Specialty Stores
- 9.1.4. Online Retail Stores
- 9.1.5. Other Distribution Channels
- 9.1. Market Analysis, Insights and Forecast - by Distribution Channel
- 10. Middle East Trail Mix Industry Analysis, Insights and Forecast, 2019-2031
- 10.1. Market Analysis, Insights and Forecast - by Distribution Channel
- 10.1.1. Hypermarkets/Supermarkets
- 10.1.2. Convenience Stores
- 10.1.3. Specialty Stores
- 10.1.4. Online Retail Stores
- 10.1.5. Other Distribution Channels
- 10.1. Market Analysis, Insights and Forecast - by Distribution Channel
- 11. South Africa Trail Mix Industry Analysis, Insights and Forecast, 2019-2031
- 11.1. Market Analysis, Insights and Forecast - by Distribution Channel
- 11.1.1. Hypermarkets/Supermarkets
- 11.1.2. Convenience Stores
- 11.1.3. Specialty Stores
- 11.1.4. Online Retail Stores
- 11.1.5. Other Distribution Channels
- 11.1. Market Analysis, Insights and Forecast - by Distribution Channel
- 12. North America Trail Mix Industry Analysis, Insights and Forecast, 2019-2031
- 12.1. Market Analysis, Insights and Forecast - By Country/Sub-region
- 12.1.1 United States
- 12.1.2 Canada
- 12.1.3 Mexico
- 12.1.4 Rest of North America
- 13. Europe Trail Mix Industry Analysis, Insights and Forecast, 2019-2031
- 13.1. Market Analysis, Insights and Forecast - By Country/Sub-region
- 13.1.1 United Kingdom
- 13.1.2 Germany
- 13.1.3 France
- 13.1.4 Russia
- 13.1.5 Italy
- 13.1.6 Spain
- 13.1.7 Rest of Europe
- 14. Asia Pacific Trail Mix Industry Analysis, Insights and Forecast, 2019-2031
- 14.1. Market Analysis, Insights and Forecast - By Country/Sub-region
- 14.1.1 India
- 14.1.2 China
- 14.1.3 Japan
- 14.1.4 Australia
- 14.1.5 Rest of Asia Pacific
- 15. South America Trail Mix Industry Analysis, Insights and Forecast, 2019-2031
- 15.1. Market Analysis, Insights and Forecast - By Country/Sub-region
- 15.1.1 Brazil
- 15.1.2 Argentina
- 15.1.3 Rest of South America
- 16. Middle East & Africa Trail Mix Industry Analysis, Insights and Forecast, 2019-2031
- 16.1. Market Analysis, Insights and Forecast - By Country/Sub-region
- 16.1.1 UAE
- 16.1.2 South Africa
- 16.1.3 Saudi Arabia
- 16.1.4 Rest of MEA
- 17. Competitive Analysis
- 17.1. Global Market Share Analysis 2024
- 17.2. Company Profiles
- 17.2.1 The Kellogg Company
- 17.2.1.1. Overview
- 17.2.1.2. Products
- 17.2.1.3. SWOT Analysis
- 17.2.1.4. Recent Developments
- 17.2.1.5. Financials (Based on Availability)
- 17.2.2 CapVest Limited (Second Nature Brands)*List Not Exhaustive
- 17.2.2.1. Overview
- 17.2.2.2. Products
- 17.2.2.3. SWOT Analysis
- 17.2.2.4. Recent Developments
- 17.2.2.5. Financials (Based on Availability)
- 17.2.3 Oberto Snacks Inc
- 17.2.3.1. Overview
- 17.2.3.2. Products
- 17.2.3.3. SWOT Analysis
- 17.2.3.4. Recent Developments
- 17.2.3.5. Financials (Based on Availability)
- 17.2.4 General Mills Inc
- 17.2.4.1. Overview
- 17.2.4.2. Products
- 17.2.4.3. SWOT Analysis
- 17.2.4.4. Recent Developments
- 17.2.4.5. Financials (Based on Availability)
- 17.2.5 PepsiCo Inc
- 17.2.5.1. Overview
- 17.2.5.2. Products
- 17.2.5.3. SWOT Analysis
- 17.2.5.4. Recent Developments
- 17.2.5.5. Financials (Based on Availability)
- 17.2.6 Creative Snacks Co
- 17.2.6.1. Overview
- 17.2.6.2. Products
- 17.2.6.3. SWOT Analysis
- 17.2.6.4. Recent Developments
- 17.2.6.5. Financials (Based on Availability)
- 17.2.7 The J M Smucker Company
- 17.2.7.1. Overview
- 17.2.7.2. Products
- 17.2.7.3. SWOT Analysis
- 17.2.7.4. Recent Developments
- 17.2.7.5. Financials (Based on Availability)
- 17.2.8 Mars Incorporated
- 17.2.8.1. Overview
- 17.2.8.2. Products
- 17.2.8.3. SWOT Analysis
- 17.2.8.4. Recent Developments
- 17.2.8.5. Financials (Based on Availability)
- 17.2.9 Whitworths
- 17.2.9.1. Overview
- 17.2.9.2. Products
- 17.2.9.3. SWOT Analysis
- 17.2.9.4. Recent Developments
- 17.2.9.5. Financials (Based on Availability)
- 17.2.10 Hormel Foods Corporation
- 17.2.10.1. Overview
- 17.2.10.2. Products
- 17.2.10.3. SWOT Analysis
- 17.2.10.4. Recent Developments
- 17.2.10.5. Financials (Based on Availability)
- 17.2.11 Texas Star Nut & Food Co
- 17.2.11.1. Overview
- 17.2.11.2. Products
- 17.2.11.3. SWOT Analysis
- 17.2.11.4. Recent Developments
- 17.2.11.5. Financials (Based on Availability)
- 17.2.1 The Kellogg Company
List of Figures
- Figure 1: Global Trail Mix Industry Revenue Breakdown (Million, %) by Region 2024 & 2032
- Figure 2: North America Trail Mix Industry Revenue (Million), by Country 2024 & 2032
- Figure 3: North America Trail Mix Industry Revenue Share (%), by Country 2024 & 2032
- Figure 4: Europe Trail Mix Industry Revenue (Million), by Country 2024 & 2032
- Figure 5: Europe Trail Mix Industry Revenue Share (%), by Country 2024 & 2032
- Figure 6: Asia Pacific Trail Mix Industry Revenue (Million), by Country 2024 & 2032
- Figure 7: Asia Pacific Trail Mix Industry Revenue Share (%), by Country 2024 & 2032
- Figure 8: South America Trail Mix Industry Revenue (Million), by Country 2024 & 2032
- Figure 9: South America Trail Mix Industry Revenue Share (%), by Country 2024 & 2032
- Figure 10: Middle East & Africa Trail Mix Industry Revenue (Million), by Country 2024 & 2032
- Figure 11: Middle East & Africa Trail Mix Industry Revenue Share (%), by Country 2024 & 2032
- Figure 12: North America Trail Mix Industry Revenue (Million), by Distribution Channel 2024 & 2032
- Figure 13: North America Trail Mix Industry Revenue Share (%), by Distribution Channel 2024 & 2032
- Figure 14: North America Trail Mix Industry Revenue (Million), by Country 2024 & 2032
- Figure 15: North America Trail Mix Industry Revenue Share (%), by Country 2024 & 2032
- Figure 16: Europe Trail Mix Industry Revenue (Million), by Distribution Channel 2024 & 2032
- Figure 17: Europe Trail Mix Industry Revenue Share (%), by Distribution Channel 2024 & 2032
- Figure 18: Europe Trail Mix Industry Revenue (Million), by Country 2024 & 2032
- Figure 19: Europe Trail Mix Industry Revenue Share (%), by Country 2024 & 2032
- Figure 20: Asia Pacific Trail Mix Industry Revenue (Million), by Distribution Channel 2024 & 2032
- Figure 21: Asia Pacific Trail Mix Industry Revenue Share (%), by Distribution Channel 2024 & 2032
- Figure 22: Asia Pacific Trail Mix Industry Revenue (Million), by Country 2024 & 2032
- Figure 23: Asia Pacific Trail Mix Industry Revenue Share (%), by Country 2024 & 2032
- Figure 24: South America Trail Mix Industry Revenue (Million), by Distribution Channel 2024 & 2032
- Figure 25: South America Trail Mix Industry Revenue Share (%), by Distribution Channel 2024 & 2032
- Figure 26: South America Trail Mix Industry Revenue (Million), by Country 2024 & 2032
- Figure 27: South America Trail Mix Industry Revenue Share (%), by Country 2024 & 2032
- Figure 28: Middle East Trail Mix Industry Revenue (Million), by Distribution Channel 2024 & 2032
- Figure 29: Middle East Trail Mix Industry Revenue Share (%), by Distribution Channel 2024 & 2032
- Figure 30: Middle East Trail Mix Industry Revenue (Million), by Country 2024 & 2032
- Figure 31: Middle East Trail Mix Industry Revenue Share (%), by Country 2024 & 2032
- Figure 32: South Africa Trail Mix Industry Revenue (Million), by Distribution Channel 2024 & 2032
- Figure 33: South Africa Trail Mix Industry Revenue Share (%), by Distribution Channel 2024 & 2032
- Figure 34: South Africa Trail Mix Industry Revenue (Million), by Country 2024 & 2032
- Figure 35: South Africa Trail Mix Industry Revenue Share (%), by Country 2024 & 2032
List of Tables
- Table 1: Global Trail Mix Industry Revenue Million Forecast, by Region 2019 & 2032
- Table 2: Global Trail Mix Industry Revenue Million Forecast, by Distribution Channel 2019 & 2032
- Table 3: Global Trail Mix Industry Revenue Million Forecast, by Region 2019 & 2032
- Table 4: Global Trail Mix Industry Revenue Million Forecast, by Country 2019 & 2032
- Table 5: United States Trail Mix Industry Revenue (Million) Forecast, by Application 2019 & 2032
- Table 6: Canada Trail Mix Industry Revenue (Million) Forecast, by Application 2019 & 2032
- Table 7: Mexico Trail Mix Industry Revenue (Million) Forecast, by Application 2019 & 2032
- Table 8: Rest of North America Trail Mix Industry Revenue (Million) Forecast, by Application 2019 & 2032
- Table 9: Global Trail Mix Industry Revenue Million Forecast, by Country 2019 & 2032
- Table 10: United Kingdom Trail Mix Industry Revenue (Million) Forecast, by Application 2019 & 2032
- Table 11: Germany Trail Mix Industry Revenue (Million) Forecast, by Application 2019 & 2032
- Table 12: France Trail Mix Industry Revenue (Million) Forecast, by Application 2019 & 2032
- Table 13: Russia Trail Mix Industry Revenue (Million) Forecast, by Application 2019 & 2032
- Table 14: Italy Trail Mix Industry Revenue (Million) Forecast, by Application 2019 & 2032
- Table 15: Spain Trail Mix Industry Revenue (Million) Forecast, by Application 2019 & 2032
- Table 16: Rest of Europe Trail Mix Industry Revenue (Million) Forecast, by Application 2019 & 2032
- Table 17: Global Trail Mix Industry Revenue Million Forecast, by Country 2019 & 2032
- Table 18: India Trail Mix Industry Revenue (Million) Forecast, by Application 2019 & 2032
- Table 19: China Trail Mix Industry Revenue (Million) Forecast, by Application 2019 & 2032
- Table 20: Japan Trail Mix Industry Revenue (Million) Forecast, by Application 2019 & 2032
- Table 21: Australia Trail Mix Industry Revenue (Million) Forecast, by Application 2019 & 2032
- Table 22: Rest of Asia Pacific Trail Mix Industry Revenue (Million) Forecast, by Application 2019 & 2032
- Table 23: Global Trail Mix Industry Revenue Million Forecast, by Country 2019 & 2032
- Table 24: Brazil Trail Mix Industry Revenue (Million) Forecast, by Application 2019 & 2032
- Table 25: Argentina Trail Mix Industry Revenue (Million) Forecast, by Application 2019 & 2032
- Table 26: Rest of South America Trail Mix Industry Revenue (Million) Forecast, by Application 2019 & 2032
- Table 27: Global Trail Mix Industry Revenue Million Forecast, by Country 2019 & 2032
- Table 28: UAE Trail Mix Industry Revenue (Million) Forecast, by Application 2019 & 2032
- Table 29: South Africa Trail Mix Industry Revenue (Million) Forecast, by Application 2019 & 2032
- Table 30: Saudi Arabia Trail Mix Industry Revenue (Million) Forecast, by Application 2019 & 2032
- Table 31: Rest of MEA Trail Mix Industry Revenue (Million) Forecast, by Application 2019 & 2032
- Table 32: Global Trail Mix Industry Revenue Million Forecast, by Distribution Channel 2019 & 2032
- Table 33: Global Trail Mix Industry Revenue Million Forecast, by Country 2019 & 2032
- Table 34: United States Trail Mix Industry Revenue (Million) Forecast, by Application 2019 & 2032
- Table 35: Canada Trail Mix Industry Revenue (Million) Forecast, by Application 2019 & 2032
- Table 36: Mexico Trail Mix Industry Revenue (Million) Forecast, by Application 2019 & 2032
- Table 37: Rest of North America Trail Mix Industry Revenue (Million) Forecast, by Application 2019 & 2032
- Table 38: Global Trail Mix Industry Revenue Million Forecast, by Distribution Channel 2019 & 2032
- Table 39: Global Trail Mix Industry Revenue Million Forecast, by Country 2019 & 2032
- Table 40: United Kingdom Trail Mix Industry Revenue (Million) Forecast, by Application 2019 & 2032
- Table 41: Germany Trail Mix Industry Revenue (Million) Forecast, by Application 2019 & 2032
- Table 42: France Trail Mix Industry Revenue (Million) Forecast, by Application 2019 & 2032
- Table 43: Russia Trail Mix Industry Revenue (Million) Forecast, by Application 2019 & 2032
- Table 44: Italy Trail Mix Industry Revenue (Million) Forecast, by Application 2019 & 2032
- Table 45: Spain Trail Mix Industry Revenue (Million) Forecast, by Application 2019 & 2032
- Table 46: Rest of Europe Trail Mix Industry Revenue (Million) Forecast, by Application 2019 & 2032
- Table 47: Global Trail Mix Industry Revenue Million Forecast, by Distribution Channel 2019 & 2032
- Table 48: Global Trail Mix Industry Revenue Million Forecast, by Country 2019 & 2032
- Table 49: India Trail Mix Industry Revenue (Million) Forecast, by Application 2019 & 2032
- Table 50: China Trail Mix Industry Revenue (Million) Forecast, by Application 2019 & 2032
- Table 51: Japan Trail Mix Industry Revenue (Million) Forecast, by Application 2019 & 2032
- Table 52: Australia Trail Mix Industry Revenue (Million) Forecast, by Application 2019 & 2032
- Table 53: Rest of Asia Pacific Trail Mix Industry Revenue (Million) Forecast, by Application 2019 & 2032
- Table 54: Global Trail Mix Industry Revenue Million Forecast, by Distribution Channel 2019 & 2032
- Table 55: Global Trail Mix Industry Revenue Million Forecast, by Country 2019 & 2032
- Table 56: Brazil Trail Mix Industry Revenue (Million) Forecast, by Application 2019 & 2032
- Table 57: Argentina Trail Mix Industry Revenue (Million) Forecast, by Application 2019 & 2032
- Table 58: Rest of South America Trail Mix Industry Revenue (Million) Forecast, by Application 2019 & 2032
- Table 59: Global Trail Mix Industry Revenue Million Forecast, by Distribution Channel 2019 & 2032
- Table 60: Global Trail Mix Industry Revenue Million Forecast, by Country 2019 & 2032
- Table 61: Global Trail Mix Industry Revenue Million Forecast, by Distribution Channel 2019 & 2032
- Table 62: Global Trail Mix Industry Revenue Million Forecast, by Country 2019 & 2032
- Table 63: Saudi Arabia Trail Mix Industry Revenue (Million) Forecast, by Application 2019 & 2032
- Table 64: Rest of Middle East Trail Mix Industry Revenue (Million) Forecast, by Application 2019 & 2032
Frequently Asked Questions
1. What is the projected Compound Annual Growth Rate (CAGR) of the Trail Mix Industry?
The projected CAGR is approximately 6.40%.
2. Which companies are prominent players in the Trail Mix Industry?
Key companies in the market include The Kellogg Company, CapVest Limited (Second Nature Brands)*List Not Exhaustive, Oberto Snacks Inc, General Mills Inc, PepsiCo Inc, Creative Snacks Co, The J M Smucker Company, Mars Incorporated, Whitworths, Hormel Foods Corporation, Texas Star Nut & Food Co.
3. What are the main segments of the Trail Mix Industry?
The market segments include Distribution Channel.
4. Can you provide details about the market size?
The market size is estimated to be USD 6534.84 Million as of 2022.
5. What are some drivers contributing to market growth?
Inclination Towards Reduced Sugar and Healthier Snacking Options; Surge in Demand for Organic Food Products.
6. What are the notable trends driving market growth?
Inclination Towards Reduced Sugar and Healthier Snacking Options.
7. Are there any restraints impacting market growth?
Availability of Cheaper Snacking Options.
8. Can you provide examples of recent developments in the market?
August 2022: UK-based fruit, nut, and seed snack brand Whitworths added new trail mixes featuring mixed nuts and tropical dried fruit snacking ranges to its portfolio. The range was initially available in sea salt & chardonnay vinegar, mature cheddar & red onion chutney, jalapeno & lime, and smokey maple bacon variants.
9. What pricing options are available for accessing the report?
Pricing options include single-user, multi-user, and enterprise licenses priced at USD 4750, USD 5250, and USD 8750 respectively.
10. Is the market size provided in terms of value or volume?
The market size is provided in terms of value, measured in Million.
11. Are there any specific market keywords associated with the report?
Yes, the market keyword associated with the report is "Trail Mix Industry," which aids in identifying and referencing the specific market segment covered.
12. How do I determine which pricing option suits my needs best?
The pricing options vary based on user requirements and access needs. Individual users may opt for single-user licenses, while businesses requiring broader access may choose multi-user or enterprise licenses for cost-effective access to the report.
13. Are there any additional resources or data provided in the Trail Mix Industry report?
While the report offers comprehensive insights, it's advisable to review the specific contents or supplementary materials provided to ascertain if additional resources or data are available.
14. How can I stay updated on further developments or reports in the Trail Mix Industry?
To stay informed about further developments, trends, and reports in the Trail Mix Industry, consider subscribing to industry newsletters, following relevant companies and organizations, or regularly checking reputable industry news sources and publications.
Methodology
Step 1 - Identification of Relevant Samples Size from Population Database


Step 2 - Approaches for Defining Global Market Size (Value, Volume* & Price*)

Note*: In applicable scenarios
Step 3 - Data Sources
Primary Research
- Web Analytics
- Survey Reports
- Research Institute
- Latest Research Reports
- Opinion Leaders
Secondary Research
- Annual Reports
- White Paper
- Latest Press Release
- Industry Association
- Paid Database
- Investor Presentations

Step 4 - Data Triangulation
Involves using different sources of information in order to increase the validity of a study
These sources are likely to be stakeholders in a program - participants, other researchers, program staff, other community members, and so on.
Then we put all data in single framework & apply various statistical tools to find out the dynamic on the market.
During the analysis stage, feedback from the stakeholder groups would be compared to determine areas of agreement as well as areas of divergence
